

A. Introduction
One focus of the discussions at the recent UN Conference on Climate Change (COP28) in Dubai was on reducing the emissions of methane. While emissions of carbon dioxide (which I will hereafter usually shorten to CO2) are the main reason for the increase in global temperatures since the Industrial Revolution, emissions of methane from human activities account for an estimated 30% of that increase according to the International Energy Agency (IEA). This is even though CO2 emissions are far greater (in units of weight, e.g. in tons) than emissions of methane – about 100 times as much in 2021. The reason is that methane is an especially potent greenhouse gas, where one will frequently see references to emissions of methane having “more than 80 times” the impact (over a 20 year horizon) of an equal weight of CO2, or “more than 20 times” the impact over a 100 year horizon.
But it may not always be clear to everyone what those ratios mean. This post will discuss the concept, generalize it, and illustrate it through some notional calculations that while not precise, are probably within 10 or 20% of figures from a more elaborate model. It will then discuss the implications of recognizing this far greater impact of methane than an equal weight of CO2 in the specific case of assessing the relative impacts of coal versus natural gas-burning power plants. A small share of gas delivered to the power plant (where natural gas is primarily methane) will leak into the air, and this is, as we will see, highly significant although typically ignored. The post will conclude with a discussion of the urgency required to address these issues, and on the longer-term impact on atmospheric warming from reducing methane emissions.
The basics are straightforward: The molecular structure of methane (CH4) is such that the molecular bonds holding the atoms together vibrate (i.e. absorb energy, thus creating warmth) when exposed to radiation in the infrared wavelengths. The same is true for carbon dioxide (CO2) but to a far lesser extent than for an equal weight of methane. That infrared radiation mostly comes from the ground, after the ground is heated by sunlight and then re-radiates the heat back out in the infrared.
While each molecule of methane leads to far greater warming than each molecule of CO2, methane is removed from the atmosphere at a far faster rate than CO2. Thus over time the proportion of methane to CO2 in the atmosphere from equal emissions of the two in some initial period will fall. There will be less methane still in the atmosphere to absorb the infrared radiation from the ground and release it as heat.
We can fit the data we have on the relative impact on global warming of methane over 20 and 100 year periods (which are average figures over the periods) to arrive at a curve that will show the warming impact of methane compared to that of CO2 year by year, starting from the year of emission up to whatever desired – say 100 years. A good fit is found when the relative impact of methane on global warming in the initial year is 150 times the impact of CO2. This is shown in the chart at the top of this post. From this chart, one can then calculate what the relative impact of methane would be for any individual year, as well as averages over any period chosen.
I should, however, note one simplification in this chart. While the molecules of methane will lead to atmospheric warming such as shown in the chart, the response is not instantaneous. The full effect will take several years. But to keep things simple I have ignored that lag and treated the warming that will eventually result as if it occurs immediately. I am also not saying the chart, as fitted in this way, is precisely right in terms of the specific values, including for the value of 150 for the multiple in the initial year. But an initial value of 150 leads to a curve that fits reasonably well with the information I have seen. And the primary purpose is to illustrate the concepts: to develop an understanding of what it means to say, for example, that methane has more than 80 times the impact of CO2 on atmospheric warming over a 20 year horizon or more than 20 times the impact over 100 years.
Those are the basics. The following section of this post will provide more detail on the data backing this up and the assumptions made. I should make clear, however, that I am an economist and not a climate scientist. I believe this has been done right, and it is based on estimates made by climate scientists, but simplifications have been made. However, and as just noted, the primary aim is to clarify the concepts.
And what those concepts mean is important. A focus on reducing emissions of methane as a core strategy to address global warming and consequent climate change is long overdue. Cutting back on methane emissions could have a significant impact in the upcoming decades, and those decades will be critical. As noted in an earlier post on this blog, heat records have not only been repeatedly set in 2023, but have been shattered. This must be addressed urgently, and there is much greater “bang for the buck” from cuts in methane emissions in the coming decades than from an equal weight of CO2. And during this time, technology that reduces the cost of cutting CO2 emissions will only get better.
Furthermore, the time frame for the benefits of cutting methane emissions is not all that short. Indeed, a unit cut in methane emissions in the initial period will always have a greater impact on global temperatures than a unit cut in CO2 emissions. As we will discuss below, methane is broken down by a series of chemical reactions in the atmosphere and will end up as CO2 and water vapor. That is, any methane emitted will eventually end up as CO2. Hence there will always be a greater impact from cutting methane emissions than from cutting CO2, although the difference becomes small after a point. However, at, say, 50 years, the impact (in the 50th year – not a period average) from cuts in methane in the initial period will still be 6 times greater than from an equal cut in CO2 emissions.
That leverage should not be ignored but rather should be central in the strategy to limit further deterioration in our climate.
B. Calculating the Relative Impact from Cuts in Methane Emissions
A molecule of methane (CH4) in the atmosphere will absorb far more energy in the infrared wavelength (the wavelength of heat) than a molecule of carbon dioxide (CO2). This is because of the nature of the chemical bonds holding together the atoms in each molecule. Thus, per molecule (or more precisely, measured in terms of units of weight as their molecular weights differ), methane will absorb more infrared radiation coming up from the ground and then keep that heat trapped in the atmosphere rather than passed into space. This is the greenhouse effect (first described in a basic form two centuries ago, in 1824, by Joseph Fourier). It is a property of a number of gases. CO2 and methane are just the two most important, given the tonnage of emissions we send up into the air each year.
However, methane does not linger in the atmosphere for as long as CO2 does. The most recent (2023) report of the IPCC (6th cycle) estimates the “total atmospheric lifetime” of methane as being, on average, 9.1 years (see Chapter 6, page 636). But a note on terminology: In climate science, the term “lifetime” refers to what in other contexts is generally referred to as a “half-life”. That is, at 9.1 years it is estimated that 50% of the methane emitted in year zero would have been removed from the atmosphere, with 50% remaining.
Methane is removed from the atmosphere relatively quickly as the CH4 molecules will interact with natural hydroxyl radicals in the atmosphere (OH molecules – note that water is H2O). UV radiation from sunlight will spark a series of reactions that, in the end, lead to CO2 and H2O as the final products. On average, 50% of the methane would have been broken down into CO2 and H2O in an estimated 9.1 years, but keep in mind this is an estimate and will vary based on various factors. For example, solar radiation (and hence the UV radiation) is more intense in the tropics than in the polar regions, and hence the reactions will proceed faster in the tropics. Also, the 9.1 year estimate incorporates only direct effects. With certain indirect effects, the IPCC estimates the lifetime (half-life) is 11.8 years. For the calculations here, I have only tried to set a rate of depletion that falls within this range. A rate of depletion of 6.5% per year will do this, leading to an average lifetime of about 10 1/2 years.
Carbon dioxide (CO2), in contrast to methane, does not break down chemically. Rather, it is only slowly removed from the atmosphere by various natural processes, including interactions with the world’s oceans (being absorbed by and re-emitted from the water), being absorbed by plant growth (trees), and over thousands of years being converted into calcium carbonate and other rock-like compounds through activities in the ocean.
These operate on very different time scales. Thus while the IPCC in its first assessment report (in 1990) said that the lifetime of CO2 in the atmosphere is 50 to 200 years, it changed this to a range of 5 to 200 years in its 1995 and 2000 assessment reports. By 2007 it changed this further to say it was more complicated, and that “About 50% of a CO2 increase will be removed from the atmosphere within 30 years, and a further 30% will be removed within a few centuries. The remaining 20% may stay in the atmosphere for many thousands of years.” In a 2018 technical report (page 24) the IPCC was even less willing to provide a lifetime for CO2, saying: “Carbon dioxide does not have a specific lifetime because it is continuously cycled between the atmosphere, oceans and land biosphere and its net removal from the atmosphere involves a range of processes with different time scales.”
Thus while CO2 in the atmosphere does diminish over time, it does so only slowly and within a time frame that depends on circumstances. For the calculations here, I assumed that there is simply a rate of depletion of 0.3% per year. This reduces the amount of CO2 in the air by about a quarter after 100 years, and yields a lifetime (half-life) of 230 years.
The two benchmarks we then have to fit the curve are figures for the average impact of methane relative to CO2 over a 20 year and over a 100 year horizon: the commonly cited multiples of “over 80” and “over 20” times the impact. These too are, of course, estimates, and the estimates have changed over time. Recent figures posted by various authorities place the ratios for the 20 year and 100 year average multiples to be 84 and 28, respectively, by the EU, or 81 to 83 and 27 to 30 by the US EPA, or 84 to 87 and 28 to 36 by the IEA. A broader range can be found in the current Wikipedia entry for “Global Warming Potential”, with multiples varying from 56 to 96 for the 20 year average and 21 to 40 for the 100 year average, based on various studies and reports dating as far back as 1995.
Very importantly (and not always clear when the multiples are presented), these ratios are averages of what the global warming impact will be over 20 year or 100 year periods – not what the multiples would be at the 20 year point or 100 year point. The multiple for any given year will vary year by year as methane (and to a far lesser extent, CO2) is removed from the atmosphere, starting from a high figure and eventually dropping to a multiple of 1.0 for methane (when all the methane has been converted through the reactions in the atmosphere into CO2 and water).
A question I had was how high this multiple would be for emissions in the initial year (ignoring the lag in the atmospheric response, as noted before). While I assume there will be an answer to this somewhere in the climate change literature, I could not find it. I therefore constructed the chart above, based on the figures just discussed for the rates of depletion of methane and CO2, and for the average multiples over a 20 year and a 100 year time horizon.
These assumptions yielded the curve shown at the top of this post, where at a multiple of 150 for the first year, and with the rates of depletion assumed (of 6.5% and 0.3% for methane and CO2), the 20 year and 100 year average multiples were similar to those found in the literature (i.e. within the range of uncertainty for those estimates).
From this chart, one can calculate that the average multiple over the first 5 years would then be 132, or a multiple of 114 over the first 10 years. And the multiples for any given year can be read directly. For example, while the 20 year average multiple is 87 in this chart, in just the 20th year itself the multiple would be a bit over 40. And at the 100th year the multiple will be close to 1, even though the average impact over those 100 years will be for methane to have had 24 times the effect of an equal weight of CO2 released in the same initial year.
All these multiples – at least until one gets close to the 100 year mark – are large, and in the near term are huge. The multiple itself is not the full story, of course. One also needs to look at the cost of reducing the emissions of a ton of methane relative to the cost for a ton of CO2. But at such multiples, one would still come out ahead even if it were far more expensive to reduce methane emissions than to reduce CO2 emissions.
Compounding the benefit, the cost of reducing methane emissions is often not high. Indeed, it could be cheaper per ton. Tightening up the pipes and fittings that carry the methane so that less leaks out often does not cost all that much. As an extra benefit, one then can sell the methane that did not leak, and hence not spend what would otherwise be needed to pull it from the ground.
This also has important implications when assessing tradeoffs in, for example, the generation of electric power. This will be discussed next.
C. An Example of the Implications: Burning Coal vs. Gas to Produce Power
The recognition that methane has such a dramatically greater impact on atmospheric warming than CO2 has a number of implications. Most obviously, it implies that the world should be paying much more attention than is currently the case to activities that release methane. Hopefully, the agreements reached during COP28 will begin to remedy this.
As another example, consider the comparison that is often made between burning coal or burning natural gas (where natural gas is largely methane, and which I will treat here as the same as methane) in the production of electric power. Gas, like coal, produces CO2 when it is burned. They are both fossil fuels. But the CO2 that is emitted from the burning of natural gas to produce power is roughly half that from the burning of coal for the same amount of power produced (i.e. per kilowatt-hour, or KWHr). The actual ratio will vary based on the quality of the coal that is burned and the quality of the gas (as the heat contents of each will vary, depending on the specific source of supply), as well as on the efficiency of the respective power plants (coal burning plants are generally less efficient than gas plants at converting heat into power), but half is a good rule of thumb. Because the CO2 produced from burning gas rather than coal is only about half as much, there has been much talk of natural gas serving as a “transition fuel” away from coal until totally clean production of power is possible.
But this considers only the direct impact on atmospheric warming from the CO2 produced by the burning of the respective fuels. There is also an indirect effect when one uses natural gas (methane) instead of coal, as that gas needs to be pulled out of the ground by wells and then delivered to the power plant by a pipeline network. During this process of producing and then delivering gas from the wellhead to the power plant, some of the gas will leak. Leaks release methane, and that methane has a far greater impact on atmospheric warming than CO2 has.
And there will always be at least some that leaks. I once asked a natural gas specialist at the World Bank what leakage rate one might expect (as a percentage of the gas supplied). He answered that all one can know for sure is that there will always be leaks. But how much varies a lot.
Surprisingly, estimates for average leakage rates are not very good even for the US. And they are far worse in many other countries. One often sees rule of thumb figures of leakage rates of 2 or 3% in countries where the oil and gas sector is relatively well managed, but far more in countries such as, for example, an Iraq or a Russia. The US EPA has an estimate that the leakage rate in the US is 1.4% of production, but a Stanford study using airborne sensors found the rate in fact to be 9% in the New Mexico half of the Permian Basin – one of the largest oil and gas fields in the world. Also, a study published in the journal Science concluded that actual natural gas leakage in the US was on the order of 60% higher than the EPA figures (i.e. 2.3% rather than 1.4%). This was primarily a consequence of a relatively small number of extremely large leaks resulting from abnormal operating conditions (i.e. accidents or equipment failures).
For the purposes here, I will assume an average leakage rate of 2% of the gas delivered. I will also assume that the amount of CO2 produced directly from the burning of natural gas is half that from the burning of coal.
Based on these parameters, as well as the assumptions made as discussed above on how fast methane and CO2 are depleted from the atmosphere over time and on the relative warming impact of each, one can calculate what the overall atmospheric warming impact will be from burning gas or burning coal:
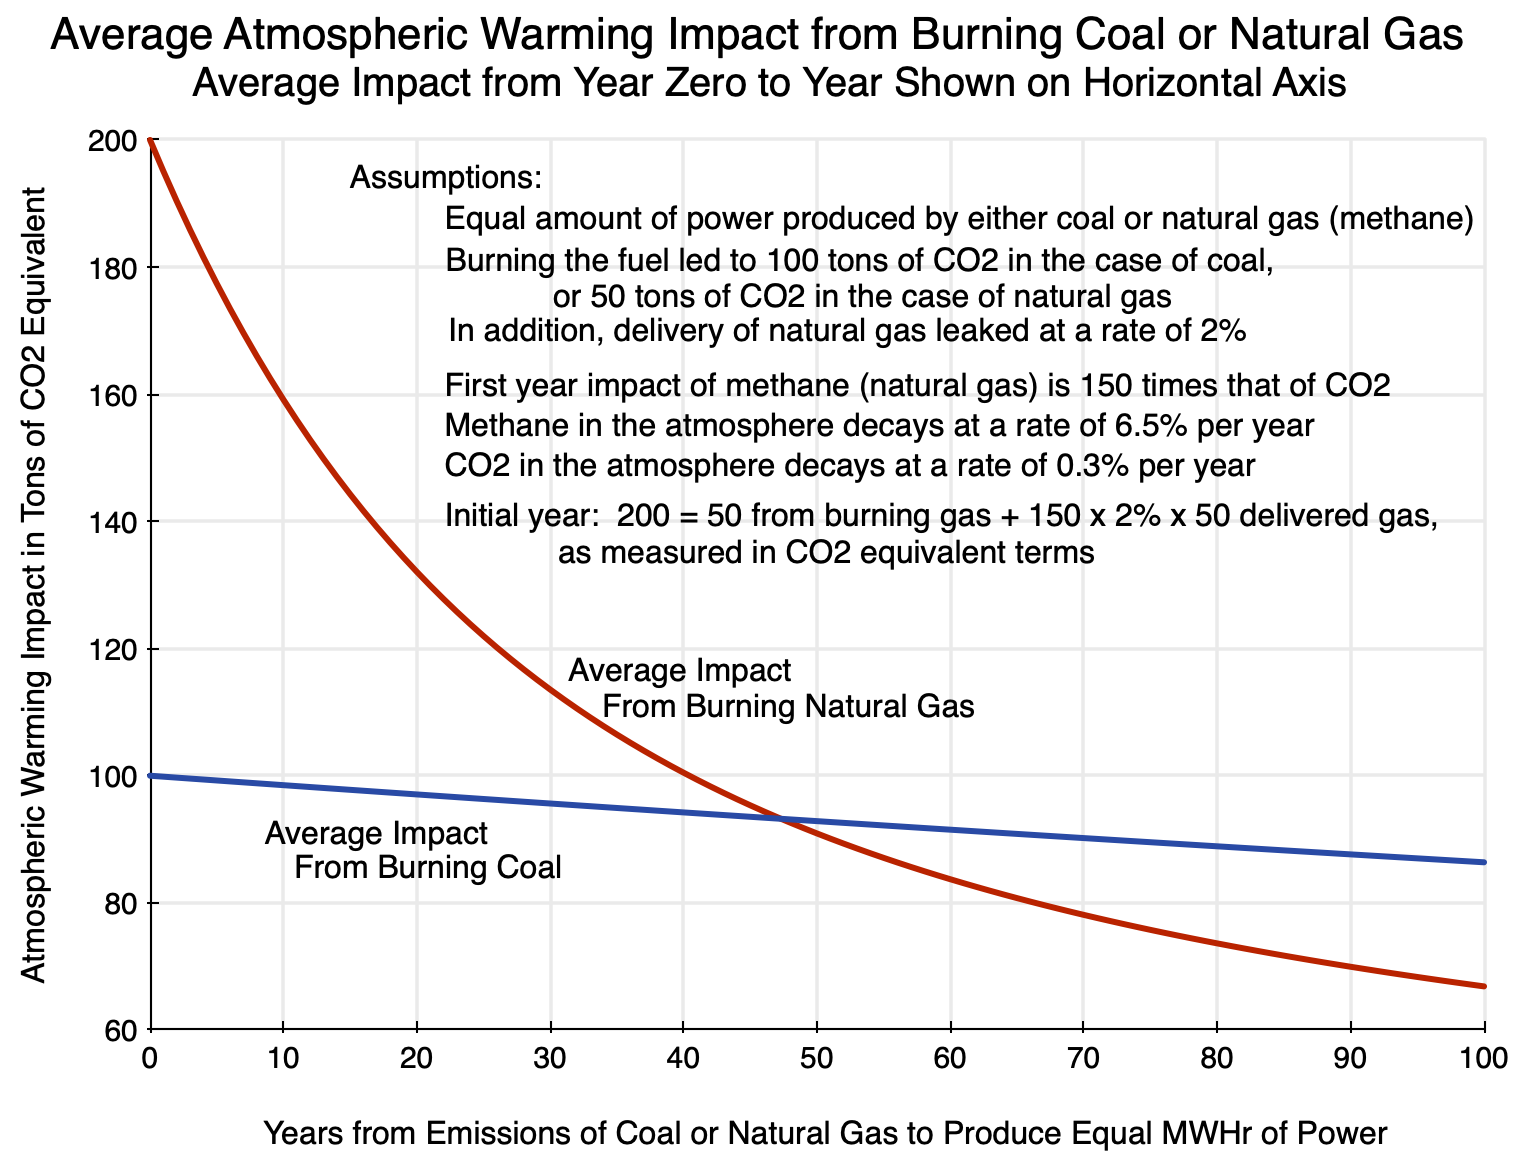
Note, importantly, that this chart shows the average warming impact for the periods from the year of the emissions (year zero) to the year shown on the horizontal axis. That is, the warming impact shown above year 20, for example, is the average warming effect for the period from year 0 to year 20. This differs from what is depicted in the chart at the top of this post, which provides the relative warming impacts only at the individual years and not over a period average.
Burning coal to produce some given amount of power is scaled to lead to an impact on atmospheric warming of 100 in the initial period. This 100 can be viewed as 100 tons of CO2 being released, or simply as an index of 100. That CO2 in the atmosphere then depletes or decays at a slow rate over time (assumed to be 0.3% a year, as discussed above), so there is a small reduction over time in the warming impact. This is the line shown in blue. As noted in the previous paragraph, the lines in this chart show the average over the periods of that warming impact (in essence indexed to 100 in year one) for the progressively longer time periods going out to year 100. That is, the value shown at year 100 represents what the average warming impact would be from that release of CO2 in the initial period over the full 100 years.
The impact from the burning of natural gas (methane) instead of coal is shown as the curve in red. In the initial year (year zero), there will be a release of CO2 from the burning of the natural gas itself to produce the given amount of power. The warming impact from that would be 50 – i.e. half that of coal. But some of the gas would have leaked along the route from the wellhead to the power plant. Assuming a 2% leakage rate, there would have been a leak of 1 unit (or, if you want to be pedantic, a leak of 1.02 as one would need to start with 51 in order to get 50 at the plant – but I will ignore this). Since methane has 150 times the warming impact of CO2 in the initial period (as derived earlier in this post), one needs to add 150 (from the leak of that 1 unit of methane) to the 50 from the CO2 directly produced by burning the gas, to get a total warming impact in the initial period of 200.
The year-by-year warming impact resulting from burning natural gas then falls over time: at the depletion rate for CO2 (0.3% per year) for the CO2 produced when burning the gas, and at the depletion rate for methane (6.5% per year) for the methane that leaked during the production and delivery of the gas to the power plant. While small, I have also added in the minor effect of the leaked methane slowly ending up as CO2 (and water vapor) after a series of reactions in the atmosphere. The line in red in the chart is then the multi-year average impact from the sum of these three sources of warming for the periods from year zero to the year shown on the horizontal axis.
The first year warming impact (ignoring lags, as noted before) of 200 is double the warming impact of 100 in the initial period from the burning of coal. That is, the initial impact from using gas is not half that from the burning of coal, but rather double. And the average impact from the burning of gas remains greater than the impact from the burning of coal for 48 years – close to a half century – for the parameters assumed. This will of course depend on those parameters, and the differences could be significant. For example, if the leakage rate is 3% rather than 2%, the average warming impact from natural gas remains higher than that from coal for an almost 80 year period.
Thus while the warming impact from coal will eventually dominate and exceed that from burning natural gas, it will be many decades before that becomes true. And the coming decades will be critical ones.
I must, however, hasten to make clear that this in no way should be seen as an advocacy for burning coal. Coal is a dirty fuel in many different ways, and the CO2 released is only one of the pollutants produced by coal. There is also particulate matter (soot), sulfur oxides (SO2 – produced from the natural sulfur in coal, and which is converted into sulfuric acid in the atmosphere), and various heavy metals as well as mercury (which can end up in the food chain and is extremely harmful to health, in particular to the developing brains of infants and children). Coal is also dirty in how it is produced, whether through underground mines (often leading to black lung in miners) or on the surface in strip mines (resulting in moonscapes). On top of all this, rain flowing through tailings at the mines can become acidic (from the sulfur content) as well as pick up other poisons, and then pollute our rivers and streams.
The term “clean coal” – promoted by some – is a misnomer. While the many types of pollutants resulting from the production and then burning of coal can be mitigated to varying degrees provided one is willing to spend the funds required, that mitigation can never be 100%. Coal is considered to be “cheap” by some, but this is only the case if one ignores the costs imposed on others not just from the global warming impact from the burning of that coal, but also from the impacts – often local – on the health of people directly exposed to the many pollutants produced by coal.
To be clear: The point of this section is not that coal is good. Rather, the point is that burning natural gas is pretty bad as well.
D. The Near-Term Danger of Tipping Points
Limiting methane emissions thus has a far greater near-term impact on atmospheric warming than would result from a similar reduction in CO2 emissions – with a “near-term” that spans a half-century or more. And the next several decades will be critical.
Global temperatures are rising, and in 2023 numerous records were not only set but were shattered. Temperatures were especially high in the second half of the year (and in fact since June), with global average surface air temperatures setting records each and every month since June.
For 2023 as a whole, the Copernicus Climate Change Service (an agency of the European Union) estimated global average surface air temperatures were a record 1.48° Celsius above their average in the pre-industrial period. While this is still only the results of one year – there are fluctuations year to year and it is the trend that matters – the trend is certainly upward and has reached or is close to a critical point.
As we have seen this past year, such temperatures have led not only to heat waves, but also droughts in some places and floods in others, stronger storms, and other such impacts from a changing climate. But in addition, and perhaps even more worrisome, these rising temperatures threaten to lead the planet past a series of “tipping points” – with catastrophic consequences.
A “tipping point” in this context would be some impact on the planet that would be triggered by global temperatures rising above some threshold, with those impacts then close to impossible – or totally impossible – to reverse once underway. An example would be deaths of coral reefs. Coral reefs cannot survive water temperatures above some level, and once they are killed they are gone. Even if water temperatures then recede for some reason, the coral reefs are dead and only a slow process of regeneration might be possible.
A recent major report produced by a group of more than 200 scientists and released just before the COP28 meetings examined 26 such possible tipping point events that may follow from our rising global temperatures, assessing each one for its likelihood, what would lead to it happening, and the consequences. While most are of concern (and one can never know what others – not foreseen now by what we currently know – might also develop), the report highlighted five as of particular concern and urgency given where temperatures already are or are heading to:
a) The melting of the Greenland Ice Sheet;
b) The melting of the West Antarctic Ice Sheet;
c) Widespread deaths of coral reefs;
d) Widespread melting of permafrost;
and e) Changes in the Subpolar Gyre circulation of ocean currents (located just to the south of Greenland).
There is, of course, a good deal of uncertainty about these and the other possible tipping points, including at what temperatures the processes will become effectively irreversible; what the feedback effects will be (with many of the tipping points inter-linked); and what the consequences will be. The report is clear that there are such uncertainties, and provides (when they are able) estimates for the ranges involved. It provides an excellent summary of what we know and our best estimates of what might develop as temperatures rise.
The tipping point for the melting of the Greenland Ice Sheet is at an estimated temperature increase of 0.8 to 3°C above the pre-industrial norm, with a central estimate of 1.5°C. As noted above, at the 1.48°C temperature in 2023, we were already within round-off of this critical 1.5°C increase (although only – so far – for one year, and there is year-to-year variability). The tipping point for the melting of the West Antarctic Ice Sheet is at an estimated increase of 1 to 3°C (with no central estimate provided).
This does not mean that once such temperatures are reached, the ice sheets will melt in full immediately. Of course not. As anyone knows when they put ice cubes in a summer drink on a hot day, it will take some time before the ice melts. Furthermore, it is also not a steady process of continuous melting. There is a seasonality, where ice builds up in the winter and melts in the summer. The tipping point is reached when the ice that melts in the summer months exceeds how much ice will on average be built up in the winter, so that over time the ice sheet that has been there for tens of thousands of years will melt away.
This does take time, and at or close to the tipping point temperatures (should those temperatures remain and not rise even further) it may take hundreds of years or more before the ice sheets are completely melted. But absent a sharp reduction in global temperatures from their critical values, the ice sheets will continue to melt and likely even accelerate the pace at which they do. For example, soil that becomes exposed in some spots as the ice sheet melts will absorb more solar radiation than ice covered with snow, as white snow reflects sunlight. This will accelerate the melting.
Should the Greenland Ice Sheet melt in full, global sea levels will rise by 23 feet for this reason alone. This does not count any further melting from other sources – where there will of course be some such melting as well if the Greenland Ice Sheet is melting. If the West Antarctic Ice Sheet also melts in full, then sea levels will rise by a further 10 feet, plus there will be the impact from at least partial melting of other sources. Such sea level rises would inundate not only all of the globe’s coastal cities but also much other land near the coasts.
As noted, the only possibly comforting aspect in this is that the entire process – once the tipping point is passed – will likely play out over hundreds of years or more. How long will depend on the path of global temperatures, as well as factors such as feedback effects and other aspects that are not yet well understood. But there is also danger in this time frame, as an impact that will play out over hundreds of years is very easy to ignore. And once the impacts become such that they can no longer be ignored, we will likely be well beyond any possibility that they could be reversed. Complacency is a danger, and a huge one.
There are similar issues with the other tipping points examined and identified. For the widespread deaths of coral reefs, for example, the report concludes the tipping point increase in global temperatures is somewhere between 1.0 and 1.5°C above pre-industrial temperatures, with a central estimate of 1.2°C. As noted above, the world in 2023 was already at a 1.48°C increase in 2023. Coral has already been dying.
Similarly, permafrost is melting, where for permafrost there is always a dividing line between it and soil not permanently frozen, with that dividing line moving northward as temperatures rise. And melting permafrost has major feedback effects as it leads to the release of both methane (from bacterial action that becomes activated) and CO2 (as what had been frozen will now dry out and burn in wildfires).
Finally, the rising temperatures as well as interaction effects resulting from the melting of the Greenland Ice Sheets (which releases fresh water, which then reduces the salinity of nearby ocean waters) will affect the operation and mixing of ocean currents. A particular concern is the Subpolar Gyre south of Greenland, where changes in those currents can be expected to have major impacts on weather in the Northern Hemisphere, particularly in Europe.
The report concluded that if global temperatures are not stabilized at or below these critical levels (with tipping point temperatures that vary depending on the particular process assessed), a range of catastrophic impacts should be expected. Thus there is an urgency to take steps to reduce the steady rise in global temperatures, and to the extent possible end or, preferably, reverse it. Addressing methane emissions should be a priority for this, not to the exclusion of measures needed to address CO2 emissions but as a complement and one that could have an especially important near-term impact.
E. Final Points and Conclusion
Addressing methane emissions therefore should be, and needs to be, a priority. The coming decades will be critical, and reducing methane emissions by some amount has a far greater impact than an equal reduction of CO2 for periods stretching for decades. But it is not always understood that there also will be important longer-term benefits as well.
There is a logical fallacy on this issue that some people fall into. As discussed above, methane has a relatively short half-life in the atmosphere – about 9.1 years according to IPCC estimates when only direct effects are taken into account, or 11.8 years when indirect effects are included. Some have therefore mistakenly concluded that control of methane emissions may not matter all that much, as methane in the atmosphere is depleted by natural processes relatively rapidly. Hence, they conclude that the only permanent solution is to control CO2 emissions.
It is certainly true that CO2 emissions need to be controlled. But the fact that the half-life of methane in the air is so much shorter than that of CO2 is an additional reason why methane should be a priority, not a reason to downgrade its importance.
First, take the case of CO2. It will remain in the atmosphere for centuries – depleting only slowly. Hence whatever CO2 that is released now will keep warming the planet for centuries. And should we eventually get to the point of net-zero CO2 emissions (as we need to do), that will essentially mean that there will be no additional warming of the planet from that point forward. But neither will temperatures go down by much for centuries (unless some technology is developed that can actually extract CO2 from the air at a reasonable cost – but we are far from that now and it may well never be possible).
Contrast this with the case of methane. As noted before, the IEA estimates that methane released into the air due to human activities accounts for approximately 30% of the increase in global temperatures we now observe compared to temperatures in the pre-industrial era. The average global surface air temperature in 2023 was already 1.48°C above the pre-industrial average, as noted above. While the Paris Accord sets the goal that global temperatures should not be allowed to rise by more than 2.0°C over the pre-industrial average by 2050 – and preferably not rise by 1.5°C – the world is already essentially at the 1.5°C line and there is little reason to believe the maximum 2.0°C goal will be reached either.
But suppose that methane emissions were dramatically cut. Based on a 6.5% per year depletion rate of methane in the air (implying a half-life of about 10 1/2 years), one can calculate that after 30 years, only 13.3% of the methane emitted in the initial period will still be in the atmosphere as methane. That is, 86.7% of it will be gone. Using the IEA estimate that methane accounts for 30% of the increase in global temperatures since the pre-industrial period (and assuming this would remain the case in the scenario where temperatures continue to rise), then if methane emissions were somehow – magically – cut to zero immediately, then after 30 years global temperatures would be reduced by 86.7% x 30% = 26%. That is, if the temperatures would otherwise rise by 2.0°C (relative to pre-industrial temperatures), they would instead rise by 2.0°C x 26% = roughly 0.5°C less. Instead of rising by 2.0°C, they would rise (due to continued even if diminished CO2 and other greenhouse gas emissions) by about 1.5°C. That would be a huge difference.
Cutting methane emissions immediately to zero is of course unrealistic. But suppose they were cut by a still ambitious but conceivable 50% over the course of a decade or so. The impact, after 30 years, would be to reduce global temperatures by roughly a still significant 0.25°C from an otherwise 2.0°C increase.
That is, it is precisely because methane will relatively soon be reduced in the atmosphere through natural processes that cutting back on methane emissions could lead to a significant reduction in global temperatures from where they would otherwise be. Cutting back on CO2 emissions, in contrast, will only keep global temperatures from rising further, with no significant fall for a very long time. The CO2, once released into the air, will remain for centuries and thus continue to keep the planet warmed for centuries. Cutting back on new methane emissions, in contrast, could actually lead to a reduction in global temperatures (relative to where they would otherwise be) on a meaningful time scale as the remaining concentration of methane in the atmosphere (from past emissions) is soon depleted away.
Methane is important. It deserves more attention than it has received.

You must be logged in to post a comment.