
A clear message from the November 5 election is that voters are upset with their economic circumstances. Much of the focus has, not surprisingly, been on the comparison households feel relative to 2020, when Trump was president. But 2020 was a special year. While the economy collapsed with the lockdowns, massive federal relief programs (first proposed by Nancy Pelosi and the Democrats in Congress, and later welcomed and signed into law by Trump) sustained and indeed added to household disposable income levels. With expenditures restrained due to the Covid pandemic, household savings and bank account balances rose. They were then spent down in the following years. A post on this blog from December 2022 estimated the excess savings balances would likely be used up by 2024 – the election year – at which time households would be in a bind. And that appears to be precisely what happened. An analysis by JPMorganChase of the bank accounts of 7.8 million of its customers found that bank balances – which had risen to more than 60% above normal levels in 2020-21 – had by 2024 fallen to below what would have been expected based on historical patterns.
But the economy has not been doing well for some time. Using up and then going beyond what had been saved in 2020-21 needs to be explained by more than households making use of those excess balances. Rather, households have grown increasingly anxious about not being able to sustain a standard of living that they had expected they would be able to enjoy. That anxiety needs to be examined in a longer-term context.
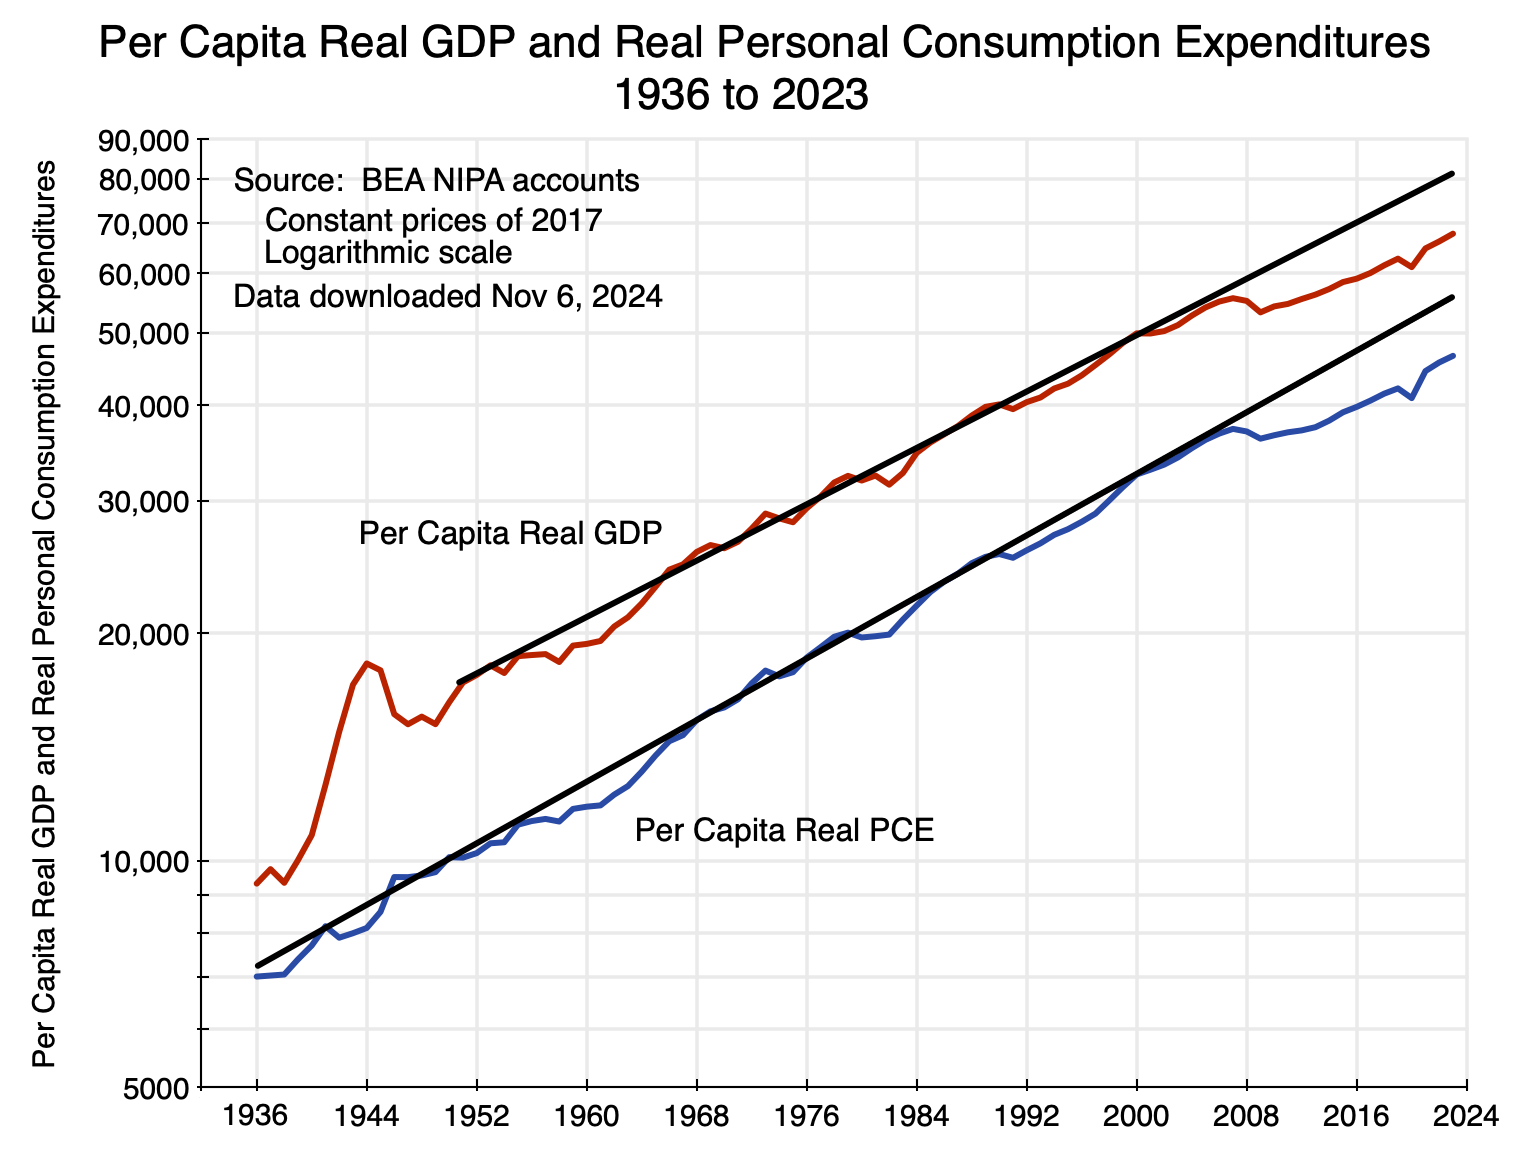
The chart at the top of this post suggests what might be underlying this. Both per capita real GDP and per capita real Personal Consumption Expenditures (PCE) grew at a remarkably steady pace from 1950 for per capita real GDP and back even further to around 1936 for per capita real PCE. Note that the chart is shown with the vertical scale in logs, and hence a constant rate of growth will be a straight line. The trend lines shown (in black) are then drawn so that they go roughly from peak to peak, although with a small excess sometimes allowed.
Growth in per capita GDP and PCE were both remarkably close to those trends – up until 2008, that is. Both GDP and PCE then fell in the economic and financial collapse in that last year of the Bush administration, with this continuing into 2009. They then stabilized and began to grow again. But unlike in prior downturns stretching back to 1936, the economy did not return to its previous path. Rather, it remained below. A gap opened up and has remained. Indeed, the gap has grown.
This can be seen more clearly in the same chart but for the period of 2000 to 2023 only: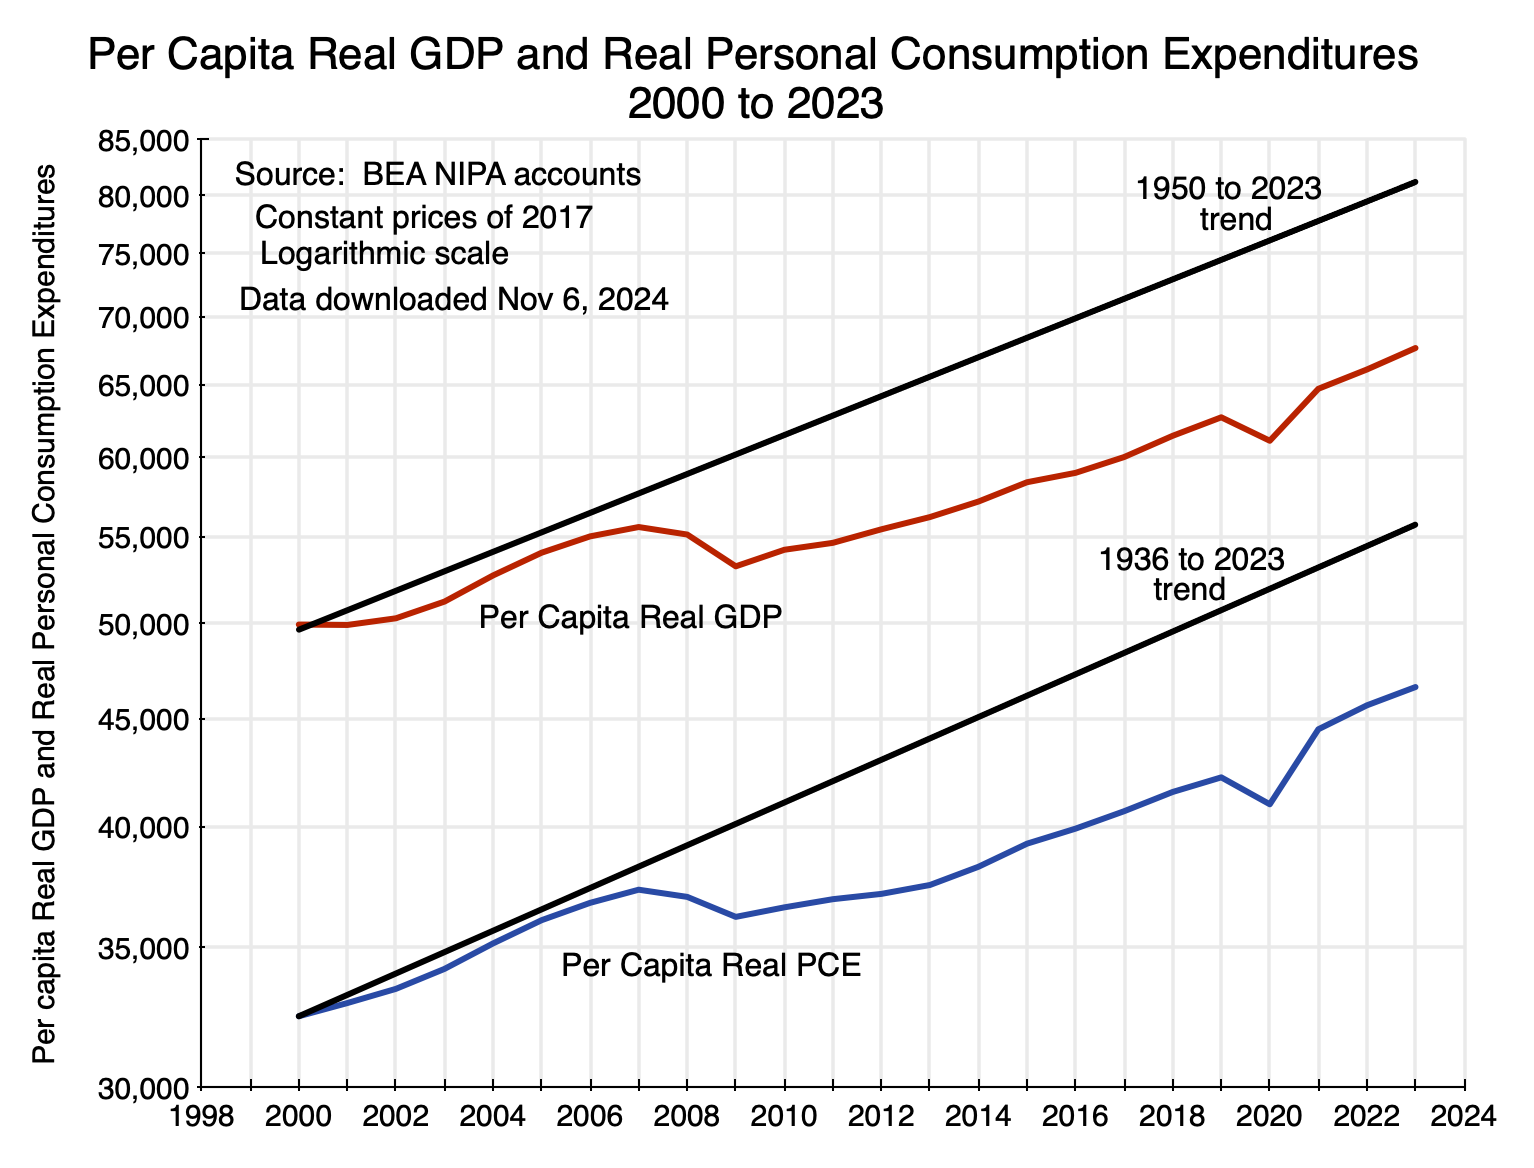
The trend lines are the same as drawn before. By 2023, real GDP (in 2017 prices) was $67,600 per person, but would have been $81,300 per person had the economy continued on the previous trend path. Real Personal Consumption Expenditures per person was $46,600 in 2023, but would have been $55,700 had it kept on the previous path. These differences are not small. Personal consumption would have been more than $9,000 higher per person (in 2017 prices), or more than $36,000 higher for a family of four. In terms of 2023 prices, personal consumption would have been close to $11,000 higher per person, or $44,000 higher for a family of four. Economic growth matters, it compounds over time, and when it slows, the impacts can soon be huge.
The figures can also be presented in percentage terms, where the following chart shows the ratio of per capita real GDP and real PCE on the trend compared to what they actually were in each year:
 There were relatively modest fluctuations around the trend as drawn up until 2008. But then one sees a bulge – far larger than anything seen before – that has been sustained and shows no sign of returning to the trend path. By 2023, both per capita GDP and per capita Personal Consumption Expenditures would have been 20% higher had the economy remained on (or had returned to) the previous trends going back to 1950 for per capita GDP and 1936 for per capita PCE. That is a huge difference.
It is also worth noting that not only has the economy not returned to the previous trend path, but – while still early, with a limited number of years – the growth rate of per capita real GDP has slowed. On the prior trend path from 1950, per capita real GDP grew at an annual rate of 2.15%. GDP then fell in 2008/2009 before stabilizing under Obama and then starting to grow. From the start of Obama’s second term (2013) through to 2023, per capita real GDP grew at an annual rate of 1.87% (with similar rates under Obama, Biden, and Trump if one excludes the collapse in Trump’s fourth year in office). That is, growth in real GDP has slowed by about 0.3% per annum, and hence one sees in the chart above that real GDP on the trend path was about 17% above the actual in 2013 and is now 20% above the actual.
Growth in per capita real Personal Consumption Expenditures, in contrast, has not slowed as much. On the trend path it grew at a rate of 2.3% per year, while from 2013 to 2023 it grew at almost the same rate of 2.2% per year. That is, households have sought to sustain their previous growth in consumption expenditures. But with GDP (and hence incomes) not growing as fast, this has become increasingly difficult.
Finally, it should be noted that these figures on per capita GDP and per capita PCE are averages, and do not take into account distributional changes. But as was shown in previous posts on this blog, the distribution of incomes became dramatically worse since about 1980 – when Reagan was elected – while wages have stagnated. Richer households have been doing better, and hence relative to the averages, poorer households have been doing worse.
Voters therefore have good reason to be upset. The economy never fully recovered from the 2008 collapse, and while growth resumed, the rate of growth has been somewhat less than what the country had before. Households have tried to sustain the previous growth in personal consumption, but that has become increasingly difficult in the face of a slower pace of GDP growth.
The critical question is, of course, why did the economy never recover in full from the 2008 collapse. I hope to address that in a future blog post. The purpose of this one has been simply to present that there is an issue. Note also that there may be multiple reasons for the lack of a full recovery. The underlying factors can be additive, and together account for an economic performance that falls short of what had previously been expected.

You must be logged in to post a comment.