The Virginia Governor’s Proposal to End the Gas Tax: A Stupendously Bad Idea

Virginia Gas Tax, 1961-2012, real and nominal terms

Introduction

On January 8, 2013, in a major policy address on how to address Virginia’s urgent transportation funding needs, Governor Bob McDonnell proposed to end Virginia’s state tax on gas and replace it with a higher rate for the state sales tax.  Along with higher vehicle registration fees, a new special charge on fuel efficient vehicles, and a shift in general state funds away from other uses (primarily education, health, and public safety), the governor’s proposal would provide for an additional $3.2 billion over five years for transportation investments.

Virginia certainly desperately needs to fund higher investment in roads and highways.  Virginia has chronically underfunded such investments for years, leading to over-crowded and poorly maintained roads, especially in Northern Virginia.  But the governor surprised many on how to provide the needed funds.

The Governor’s Proposal

Instead of increasing the tax on fuels for cars and trucks (the traditional primary source of funds for roads and highways) to make up at least partially for what has been lost to inflation over the years, he instead called for getting rid of the gasoline tax altogether.  Instead of drivers paying through a fuel tax for the building and maintenance of the roads they use, he would shift the burden onto the state sales tax.  Everyone has to pay this, drivers and non-drivers alike.  Indeed, if the governor’s proposals were to be adopted, the one product people commonly buy that would not be subject either to the sales tax or an excise tax would be gasoline!

This is stupendously bad policy.  A basic principle of economics is that for efficiency, those who benefit from some good or service should pay what it costs to the extent this is possible.  Fuel taxes, when they are set at a rate to cover what one needs to invest in road construction and for maintenance, approximates this fairly well.  Those who drive more and hence burn more fuel, pay more.  Those who drive heavy vehicles, which disproportionately account for road deterioration, also pay more as their heavier vehicles burn more fuel.  The relationship is not perfect, but is much better than dropping any link whatsoever, as the governor proposes.  The fuel tax also acts as an incentive to buy vehicles with greater fuel efficiency (a national objective) and to drive less (and hence reduce pollution and congestion).

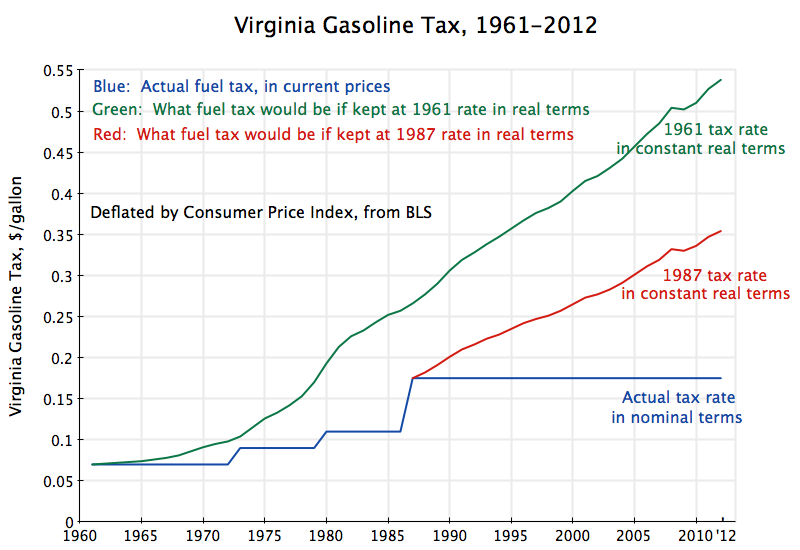
Virginia currently imposes a fuel tax of 17.5 cents per gallon for gasoline as well as diesel.  This rate has not changed since 1986 (taking effect in 1987).  The governor correctly points out that since it has not since been adjusted to reflect inflation, the 17.5 cents received today can buy only about 8 cents of what it could in 1986.  He also complains that since vehicles have become more fuel efficient, and since there are a small but growing number using alternative fuels such as ethanol, natural gas, and electricity, the state is receiving less through the fuel tax per mile driven than before.

These statements are true.  But there are obvious ways to address them instead of ending the gasoline tax altogether.  First, it is easy to index the fuel tax for inflation.  Every January 1 (or whatever anniversary date one wants to use) you adjust the rate to reflect inflation over the past year.  The adjustments each year would be small, but accumulate over time. With inflation currently running about 2% a year, a 17.5 cents per gallon fuel tax would rise to 17.85 cents, an increase of 0.35 cents – only about a third of a penny on gas that now costs $3 to $4 per gallon.

Second, one could charge similar taxes on vehicles powered by alternative fuels.  One could easily charge the same fuel tax rate for ethanol (just as one now charges the same 17.5 cents for both gasoline and diesel).  And one could work out the equivalent for natural gas and other fuels which are sold or will be sold at the equivalent of the pump for gasoline.

For electric power charging batteries it would be only slightly trickier.  Since one would normally charge the batteries at home from your household electricity supply, there is not the equivalent of a pump as the point where one could impose a tax to cover the costs of roads and highways.  But cars are inspected annually in Virginia.  At these annual inspections, one can check the mileage, see how many miles were driven in the past year, and then charge accordingly.  The amounts are not huge.  According to figures from the Federal Highway Administration, we on average drive 13,476 miles per year in the US, and the Energy Information Agency reports that the average fuel economy is 23.5 miles per gallon (as of 2010, the same as in 2009).  Dividing this out, the average driver burns 573 gallons per year, and with a tax at 17.5 cents per gallon, pays $100 in fuel taxes ($100.4 to be precise).  If the fuel tax were doubled to 35 cents, one would pay $200.  Such an amount (less if one has driven less, and more if one has driven more) could easily be charged at the time of the annual inspection.  And for plug-in hybrid vehicles, burning gas sometimes and using a battery charged at home other times, one could obtain a refund on your annual state income tax return for any fuel taxes paid at the pump (backed up by receipts).

None of this is impossible, and it need not be perfect.  And it is far better than charging drivers nothing at all for building and maintaining the roads they use.

Indexing the Fuel Tax for Inflation

The basic problem comes from not indexing the fuel taxes for inflation.  Virginia has imposed fuel taxes since 1923, and they have never, over this period, been as low as they are now in real terms.  In terms of today’s prices, they were at their highest in 1933 at what today would be 88 cents per gallon.  The nominal price then was 5 cents.  And it is absurd to argue that people today cannot afford 88 cents per gallon, when such a rate was possible in 1933 in the middle of the Great Depression.  People were far poorer then than they are now.

And no one is proposing a return to 88 cents per gallon for the state tax.  But it would not be unreasonable to return to the rate Virginia charged in 1961, or at least charged in 1987. The 1961 rate was 7 cents per gallon, and it generated sufficient revenues so that Virginia was widely seen at that time to have had one of the better road systems in the nation.  The 7 cents per gallon in 1961 would be a rate of about 54 cents today.  See the graph at the top of this post.  And again, if we could afford it in 1961 (and afford an even higher rate in real terms in 1933), it is absurd to say we cannot afford it today.

The graph also shows what the path would have been had Virginia, when it set the rate at 17.5 cents with effect from January 1, 1987, also then indexed the rate for inflation.  The rate would be a little over 35 cents per gallon today, or double the current rate.  This would also not be out of line with what other states charge.  North Carolina, on Virginia’s border, charges 37.8 cents per gallon, while New York charges 50.6 cents (the highest in the country).  The US average is 30.4 cents.  (To be precise and fair, to make these figures fully comparable one should also add a charge of 2.4 cents per gallon of fees for other purposes to what Virginia charges, in addition to the basic fuel tax.)

The governor’s detailed proposal provides estimates over the five years 2014 to 2018 of what the revenues would be under his proposals.  While losing the revenues generated by the fuel tax on gasoline, he would substitute by adding 0.8% points to the current 5.0% Virginia general sales tax, would keep the 17.5 cents tax on diesel fuel, and would take other measures (including shifts of funds out of education, health, and/or public safety; these areas account for 84% of Virginia’s non-transport budget so you would have to cut them; there is nothing else) to increase funds allocated to transportation.  Over the five years, funds for transport from the current fuel taxes on gasoline and diesel (if one were to keep them as now) would rise from $4.5 billion to a total of $7.7 billion, or an increase of $3.2 billion.

While the $7.7 billion total would be a good deal more than what is currently being funded for transport by the fuel taxes, many note that this would still be too low given the backlog of Virginia’s needs.  And in addition to being too low, it would shift the burden away from those who use the roads the most, onto the regressive sales tax which impacts the poor the most.

Alternatively, returning the fuel tax rate to what it was in 1987 in real terms, and even more so if it were returned to what it was in 1961 in real terms, would generate far more revenues.  Shifting to the 1987 rate and then indexing it for inflation, would generate revenues of $9.9 billion over the five years, an increase of $5.4 billion.  The governor is proposing an increase of only $3.2 billion.  Shifting to the 1961 rate and then indexing it for inflation, would generate revenues of $14.0 billion.  Such funding would permit a much more rapid rehabilitation of Virginia’s road infrastructure, and would be far fairer as those using the roads would pay for them in rough proportion to how much they use them.

Conclusion

In conclusion, there is no mystery as to why Virginia has been unable to invest in keeping up what was once a good road network:  It has allowed its source of funding for such investments to fall to the lowest it has been since first set in 1923.  But it would be straightforward to index the fuel tax to the rate of inflation, with a small annual adjustment which would not lead to this revenue source deteriorating over time.  Using fuel taxes to pay for roads is not only fair but is also efficient, as those who use the roads pay for them, and can decide whether and how much to drive based on facing the full cost of what they do.

In contrast, under Governor Bob McDonnell’s proposal:

  • The poor and the elderly and everyone else taking buses will pay more, while those driving Cadillacs will pay less;
  • The poor buying basic necessities will pay more, while the rich who like to drive out to a vacation or week-end home will pay less;
  • Those driving small and fuel efficient cars will pay more, while those driving gas guzzlers will pay less;
  • Those that decide to live close to where they work will pay more, while those who live in distant suburbs for a large house and lawn will pay less;
  • Those that car pool to work will pay more, while those driving alone each day will pay less;
  • Those that drive small and light cars which do not tear up the roads will pay more, while those that drive heavy vehicles which damage the roads disproportionately will pay less;
  • Virginians will pay more, while out-of-state drivers coming through the state and needing to buy gas will pay less;
  • Those driving alternative fuel vehicles will pay more, while those driving traditional gasoline fueled cars will pay less;
  • Those who purchase goods by catalog or over the internet and have them delivered by regular mail will pay more, while those who make frequent shopping trips by car will pay less;
  • And those that take care in not driving too much, adding to congestion and pollution, will pay more, while those who cannot be bothered will pay less.

Impact of the New Tax Provisions: The Poor and Middle Classes Account for Most of the New Revenues

Tax Policy Center - Net Impact of Jan 1, 2013, Tax Law

The discussion on the new tax law, passed by the Senate late on December 31 and by the House late on January 1, focussed on whether income tax rates should have been allowed to revert to what they were during the Clinton years for the well off (incomes over $250,000), the rich (incomes over $450,000), or the extremely rich (incomes over $1,000,000).  The final law, which Obama said he will sign, sets the break at $450,000.

But there is much more in the new law as well.  Many of its provisions will affect the poor and middle classes, so the federal taxes they will pay will also go up in 2013.  Especially important will be the end to the 2% point reduction in the payroll tax rate, which has been in effect since the start of 2011.  These impacts have been less discussed, but in the aggregate they will account for substantially more of the revenues that will be generated than the impact of the reversion to previous income tax rates on incomes over $450,000.

The non-partisan Tax Policy Center has estimated what the impacts will be by household income level of the new law.  The analysis uses their microsimulation model.  The model is based on data from a large sample of actual tax returns, to determine what the different income sources are by category of household.  Hence it can determine with some accuracy the impact of changes in the tax code.

The graph above shows how much average taxes would rise in 2013 in percentage terms under the new law, for households classified by income category.  The Tax Policy Center also included two lower income groups (income of less than $10,000 per year, and income of $10,000 to $20,000 per year), but I have left these off of the graph.  Such very low levels of taxable income will be dominated by special groups, such as students with summer jobs, and may not be representative of actual households.  The official government poverty line for a family of four in 2012 was $23,050.  The taxes due are also quite small on average as one is averaging in many with a zero tax liability.  As a result, the percentage changes can be huge.  For those interested, the percentage increases that will result from the new tax law was 73% and 151% for the two groups, respectively.  But it is not clear that these figures are meaningful.

But the pattern seen among the other groups is significant, and interesting.  Those in the lowest income categories will see the largest percentage increases in their taxes due (by 21% for those earning between $20,000 and $30,000), with this then steadily declining to just a 3.8% increase for those earning between $200,000 and $500,000.  This then rises to an increase of 7.2% for those earning between $500,000 and $1,000,000, and to an increase of 15.5% for those earning over $1,000,000.

This is not terribly progressive.  Under a progressive scale, the percentage change would have been smallest for the poorest, and then rise steadily as one goes up the income scale to the richest.  But here one has the steepest increases for the poorest, with this declining steadily until one reaches an annual income of $500,000.  Only then does it start to rise.  And the percentage increase for those earning between $500,000 and $1,000,000 is less than the increase for those earning anything up to $100,000.  The percentage increase for those earning over $1,000,000 is less than the increase for those earning less than $30,000.

The reason for this is largely the impact of ending the 2% point reduction in the payroll tax. This had been introduced with effect from January 1, 2011, on the initiative of President Obama, as a mechanism to help especially the poor, as well as an economic incentive to businesses to hire more workers rather than use more machines (by reducing the relative cost of labor).  It would also have an especially strong stimulative effect, as the tax cut would be focused on relatively lower income workers who would likely spend most of the extra income, thus generating demand.  And while the 2% point reduction in the payroll tax was always viewed as temporary, some would question whether it is best to end it now, as opposed to next year or the year after.

The payroll tax is used to finance Social Security.  While the 2% point reduction was in effect, the US Treasury transferred an equal amount to the Social Security Trust Fund.  The amounts transferred were $103 billion in 2011 and an estimated $112 billion in 2012.  Projecting this forward, the amount needed would have been about $120 billion in 2013.  The figures underlying the graph above from the Tax Policy Center estimate that the aggregate increase in tax revenues in 2013 across all income groups (relative to what they would have been had 2012 law been extended into 2013) would have been about $200 billion ($199 billion to be more precise).  That is, the end of the 2% point reduction in the payroll tax accounts for 60% ($120 billion of the $200 billion) of the increase in revenues.  All the other changes, including the increase in the tax rates for those earning over $450,000, the phasing out of deductions and exemptions for households with incomes over $250,000, the increase in the capital gains tax rate to 20% from 15% for those earning over $450,000, and the other changes, only account for 40%.

Consistent with this, the Tax Policy Center figures indicate that 57% of the extra revenues generated will come from households of income $500,000 or less (they do not have a break point at $450,000).  Indeed, 33% comes from households of income of $100,000 or less.  Only 43% will come from households of income above $500,000.

The debate on this new tax law has centered on how much the rich should pay in taxes.  But the final law, as passed, is far from focussed only on taxes the rich.  The steepest increases will be borne by the poor, and the poor and middle classes will account for most of the revenues that will be raised.

The Long-Term Damage From Keeping the Bush Tax Cuts

CBO Revenue Projections - Extended Baseline vs Alternative Fiscal Scenario, 2012to 2037

The US Senate has voted in favor of a package of measures to avert temporarily the so-called “fiscal cliff” (but in doing so, has set up a new cliff that will hit in two months).  As I write this, it is not yet clear whether the House of Representatives will vote to pass this compromise, or will try to amend it, or will attempt something else, but right now a vote appears imminent.

But there is one aspect of the deal which has not received much attention in at least the public discussion of what is being voted on:  While it is recognized that extending the Bush Tax Cuts will slash government revenues over the ten year period being discussed (2013 to 2022), little attention has been paid to the long term impact if the Bush Tax Cuts were made permanent.

The Bush Tax Cuts were originally passed under legislation where they would expire on December 31, 2010.  With the economy then still extremely weak, Obama signed legislation in December 2010 to extend the cuts for a further two years, to December 31, 2012.  Other recent tax measures (including in particular the effective rates for the Alternative Minimum Tax) also were set with an expiration date of December 31, 2012.  The issue being debated in the Congress is whether these tax cuts should be extended again, in whole or in part.  Both Obama and the Republicans have been in favor of extending them for most households.  The debate has centered on whether taxes should be allowed to revert to what they were during the Clinton years for households with incomes over $250,000 a year, over $450,000 a year, or over $1,000,000 a year, or some other number within that range.  This corresponds to extending the Bush Tax Cuts permanently for approximately 97% of the population ($250,000), 99.3% of the population ($450,000), or 99.7% of the population ($1,000,000).

The bill passed by the Senate would extend the Bush Tax Cuts permanently for the 99.3% of households earning up to $450,000 a year.  That is, almost everyone would continue to pay the lower tax cuts first passed during the Bush Administration.  Even the remaining 0.7% of the population would see their taxes fall similarly on their first $450,000 of income.  Beyond that, their marginal tax rates would revert to those that applied during the Clinton years.

Since the richest 0.7% earn so much more than the rest of us, there would still be a substantial increase in tax revenues paid.  The estimate is that the tax measures in the bill passed by the Senate would raise tax revenues by about $600 billion over the ten years 2013 to 2022 (i.e. by $60 billion per year).  There would have been an estimated extra $4.5 trillion in revenues over the ten years if the Bush Tax Cuts and the other tax measures had been all allowed to expire.  The $600 billion is only 13% of the $4.5 trillion.  That is, 87% of the Bush Tax Cuts (and related tax cuts) are made permanent.

The problem of what to do about the fiscal deficit over the next ten years will therefore largely remain.  As Jeff Sachs has noted in a recent column, without the revenues that will be lost by making the bulk of the Bush Tax Cuts permanent, it will be hard to pay for the basic government programs that most consider important.  But what few have noted is that extending the bulk of the Bush Tax Cuts not only hurts the fiscal balance for the next ten years, but makes the situation far worse beyond that.

The graph above shows projected federal government revenues up to the year 2037 under two scenarios:  where the Bush Tax Cuts (and AMT and other related tax measures) are allowed to expire as scheduled (the Extended Baseline Scenario), and where these tax cuts are instead made permanent (the Alternative Fiscal Scenario).  The projections are from the Congressional Budget Office in their Long-Term Budget Outlook, of June 2012.  We do not yet have what the projections would be to 2037 under the Senate bill, where taxes are allowed to revert to previous levels only for those earning over $450,000.  However, since this would recover only 13% of the revenues that would be lost if the Bush Tax Cuts were extended for everyone, the curve would lie between the two shown above, but relatively close to the curve labeled the Alternative Fiscal Scenario.

If the tax cuts are made permanent for all, the CBO projects that federal revenues would recover over the next three years from their current very low levels (low due to the economic downturn), but then flatten out and not rise above 18.5% of GDP even in the very long term.  In contrast, if the tax cuts were allowed to expire for all, federal revenues would first recover, but then continue to rise slowly to 21% of GDP by 2021, to 22 1/2% of GDP by 2030, to 23 1/2% of GDP by 2036, and to continue on that rising path beyond that.

The increase in taxes as a share of GDP over time, were the Bush tax rates allowed to expire and revert to their previous levels, is interesting and important.  The tax share is projected by the CBO to increase because GDP is projected to grow over time, and under the previous tax regime the tax system was progressive, with higher incomes leading to higher tax rates and hence higher tax collections.  In contrast, under the tax regime brought on by the Bush Tax Cuts, the system is no longer progressive:  When GDP grows over time, those receiving the higher incomes will only pay taxes at rates similar to those who are poorer, so taxes as a share of GDP remains flat.

This loss in progressivity of the tax system may well be the most damaging aspect of the Bush Tax Cuts.  Relative to the previous system with progressivity, the tax cuts have led not only to a loss in revenues, but also to a system where on average higher incomes do not result in a higher rate of taxes on that higher income.  As Warren Buffett has noted, a person as rich as he is will pay, under the current tax system, a lower rate of taxes on average than his secretary.  This will not change significantly under the bill passed by the Senate.  And the losses in revenues as a share of GDP become steadily larger over time as the economy grows.

The losses in revenues are huge.  They start at about 2 1/2% of GDP from 2014 to 2020, but then rise to 4% of GDP by 2030 and to 5% of GDP by 2036.  Keep in mind that future governments could decide that such extra revenues are not needed.  If so, they could then  enact tax cuts of a size and structure suitable for the time.  But it is far easier to legislate tax cuts in the American political environment than it is to legislate tax increases when extra revenues are needed.

With the difficult long term fiscal outlook that most foresee for the US, an ability to raise adequate revenues will be critical to the country’s long-term financial stability.  But I should add that while this is a critical long-term problem, this does not mean that the Bush Tax Cuts should all end immediately, as they would have under the fiscal cliff.  Unemployment, while better than three years ago, remains high.  Rather, the optimal path would be to phase them out over the next few years.  A reasonable policy would be to link them to the unemployment rate.  To start, taxes would revert now to those of the Clinton period (when growth was solid, and the fiscal accounts moved to surplus) for those with income over $250,000.  Taxes would then revert to Clinton period rates for those with income of over $100,000, say, when the unemployment rate had fallen from the current 7.7% to a rate of perhaps 7%, and then taxes would revert for everyone once unemployment had fallen to below 6%.

But under the Senate passed bill, this will not happen.