
A. Introduction
The recent Parliamentary election in the United Kingdom was without doubt a big victory for the Conservative Party and a loss for Labour. The normally staid The Economist (which I try to read on a regular basis) sub-titled its Bagehot column this past week as “British voters have showed a crushing disdain for the Labour Party”, and in its first sentence termed the election a “calamitous defeat” for Labour. Stronger language is available in other British publications, for those who are interested.
But while undoubtedly a defeat for Labour and a victory for the Conservatives (who gained a majority of the seats in Parliament, and hence will no longer need to rule in a coalition), one should not jump to what would seem to be the natural conclusion that voters shifted to the Right while abandoning the Left. That did not happen. Given the rules of the British electoral system, where Parliamentary seats are won by whomever gained most votes (not necessarily a majority) in each of the 650 constituencies (a “first past the post” system), plus the rise of significant third parties on both the Left and the Right, swings in voter support between Left and Right were quite different from swings in the number of seats won by the major parties.
This blog post will look at these election results, in comparison to the results from the most recent UK general election in May 2010. That election brought a Conservative – Liberal Democrats coalition to power, replacing the previous Labour Government. Some have argued (most strongly by the Conservative Party leaders themselves) that the recent election results mark a vindication of the economic program it launched soon after taking office, and a recognition of its success. The first section below will examine very briefly whether that program can be termed a success, and the rest of the post will then look at the election results themselves.
B. Growth Has Been Poor
Perhaps the best single measure of whether a government’s program succeeded or not is whether it led to good and sustained growth or not. While there is of course much more to be concerned with, real incomes and living standards cannot increase overall unless there is growth.
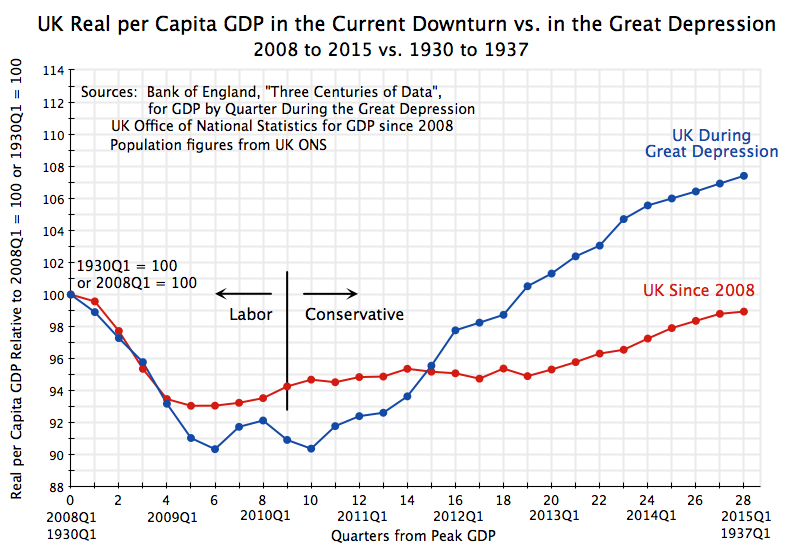
The chart at the top of this post shows what happened in the recent downturn to real per capita GDP in the UK, measured relative to the peak level it had achieved before the downturn (in the first quarter of 2008). It also shows the path followed by the economy during the Great Depression in the UK, from the peak reached in the first quarter of 1930. The recent data come from the UK Office of National Statistics, while the data on real GDP in the 1930s come from the data set (drawn from academic studies) released by the Bank of England and called “Three Centuries of Data” (a hot link is not possible, but just do a Google search to find it).
The rapid and steep decline in GDP at the start of the Great Depression, and then a delayed and initially slow recovery, had marked the worst previous period for the economy over at least the last century. But the current recovery has been worse.
The downturn during the 2008 collapse initially traced very closely the path of the downturn during the first year of the Great Depression. But the Labour Government in power until mid-2010 was able to turn this around after about a year with stabilization and stimulative measures, with the economy then starting to grow. A Conservative led coalition (with the Liberal Democrats) then took power after the May 2010 general elections, and soon announced a sharp austerity program. After one more quarter of growth (the new austerity measures began to be implemented in the fall of 2010), the economic recovery was brought to a halt. Real per capita output was largely unchanged over the next two and a half years.
Policy then shifted, with an easing of the austerity measures. Growth resumed in early 2013, to a modest rate averaging 1.9% a year (per capita) over the two years leading up to the recent election. While better than no growth at all, as during the first two and a half years of the Conservative-led Government, such a modest growth rate for an economy coming out of the worst downturn since the Great Depression is poor.
Indeed, as the chart at the top of this post shows, the recovery was a good deal faster during the Great Depression. At the same point in the downturn (after 28 quarters, or 7 years), real GDP per capita in the Great Depression was 7 1/2 % higher than it had been at its previous peak at the start of 1930. In the current downturn, it is still 1% lower than it was at the start of 2008.
This is a terrible record. While there is strong evidence in the political science literature that voters only pay attention to growth in just the year or so before a general election (rather than looking farther back to the full record of the administration), one cannot find evidence here that the austerity program of the Conservatives has been a great success. At most it says that voters can perhaps be fooled by timing the economic cycle to cut growth when first taking office to make it easy to have a “recovery” as the next election approaches. But it is not clear that UK voters have in fact been fooled in this way, once one looks at whether voters indeed shifted to the Right or to the Left.
C. Overall Election Results by Party
First the election results by party. The figures are all taken from the BBC, and the comparisons are made relative to the results in the 2010 general election. In terms of the number of seats gained or lost:

Labour lost 26 seats, and the Conservatives won 24, bringing the Conservative total to 331, or a majority in the 650 seat House of Commons in Parliament. This was a major victory for the Conservatives and a loss for Labour.
The Liberal Democrats also lost, but by much more. They had won 57 seats in the previous election but only 8 now, for a loss of 49. They had joined as the junior partner in the Conservative-led coalition of the previous Parliament, and provided the key votes that allowed approval of the conservative agenda of austerity (as well as tax cuts, mostly benefiting the rich). Voters who had supported the Liberal Democrats before clearly did not like what their party representatives had done, and the party was decimated.
But the biggest winner by far in terms of number of seats was the Scottish National Party (SNP), which gained 50 seats. This was more than double what the Conservatives gained. The SNP advocates policies well to the left of Labour in terms of support for social programs (in addition to its support for a Scottish nation). This hints at the need to start to break down the results to see what really happened.
The first step is to look at the swing by party in the share of votes cast. Because of the UK “first past the post” system, plus the existence of significant smaller parties, swings in votes cast can differ significantly from swings in seats won. The changes in the shares of the vote gained were:

Here the Labour Party actually gained, increasing their share of the UK vote by 1.5% points. They gained in terms of their share of the vote, but still lost 26 seats. The Conservatives also increased their share of the vote. but only by 0.8% points, about half of what Labour gained, even though this led to their gaining 24 seats in the new parliament. One cannot conclude from this that there was a big swing in sentiment away from Labour and towards the Conservatives. Labour increased its share of the vote, and by more than the Conservatives did. But with the UK first past the post system, what matters in terms of seats won is how these votes are spread across constituencies and what gains and losses are being made by third parties.
Among the remaining parties, the Liberal Democrats saw their share of the vote collapse by over 15% points, to a total in 2015 of less than 8% of the voters. They were decimated, and their losses in seats are consistent with this.
The SNP, as noted above, won big in terms of seats gained, but at a national level their share of the vote rose by just 3% points. But the SNP contested only seats in the 59 districts in Scotland (and took 56 of them), and there their share of the vote rose by 30% points. The 50 seats the SNP gained came mostly from Labour (which lost 40 seats in the Scottish districts) and the Liberal Democrats (which lost 10 seats). The Conservatives had one seat before in Scotland and one seat after, for no net loss, but they basically had nothing to lose there to start with.
The Green Party, with a focus on environmental and social issues, is also on the left. While they gained no new seats in parliament, they increased their share of the UK vote by close to 3% points.
On the right is UKIP (UK Independence Party), a radically right-wing populist party advocating exit from the EU and conservative social programs. They increased their share of the vote (relative to the 2010 elections) by 9.5% points and gained one seat relative to their 2010 results (when they won zero seats; in by-elections since 2010, UKIP won two seats, so their one seat now is a reduction relative to what they had immediately before the 2015 elections were called).
The BNP (British National Party) is an even more extreme right wing, anti-immigrant and anti-EU, party. It had close to 2% of the vote in 2010, but dropped to essentially zero now, with most of its supporters likely shifting to UKIP. It held no seats before or after.
Finally, the other category is comprised of a fairly large number of mostly small parties. The more important among them are regional parties in Wales and Northern Ireland, whose primary focus is on regional issues. They had no net gain or loss of seats, but they hold a not insignificant 21 seats in the Parliament.
D. Left, Center, or Right
Given this distribution across parties, how would the vote and seat count add up if one grouped the parties by ideology? The Left is made up of Labour, the SNP, and the Greens; the Center is the Liberal Democrats; the Right is the Conservatives, TKIP, and BNP; and Other is everyone else.
The results in terms of share of the vote is:

The Left gained 7.4% points of the vote, while the Right gained 8.4%. And the Center (the Liberal Democrats) lost over 15% points. This is hardly a resounding trouncing of the Left, or a renunciation of their views.
There is then more of a consistent result in the number of seats won or lost:
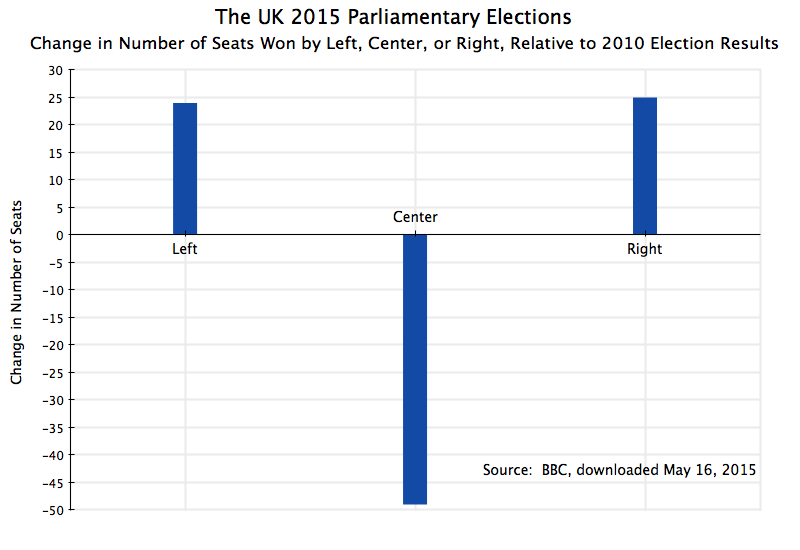
The Left won 24 seats, the Right won 25, and the Center lost 49. It is hard to argue the Left lost in this election. It is more correct to say that the Center lost, with almost even shares then going to the Left and to the Right.
E. Just Left or Right
Finally, it is arguable that the Liberal Democrats can no longer be considered a centrist party. They have been coalition with the Conservatives in the most recent Parliament, and provided the critical votes they needed to implement their austerity program of cuts in government programs (while at the same time granting tax cuts mostly benefiting the rich). While I would not want to argue the point too strongly, for completeness it is of interest to look at how the results add up if one combines the Liberal Democrats with the right-leaning parties.
In terms of voting shares, there is now a clear shift from the Right to the Left:
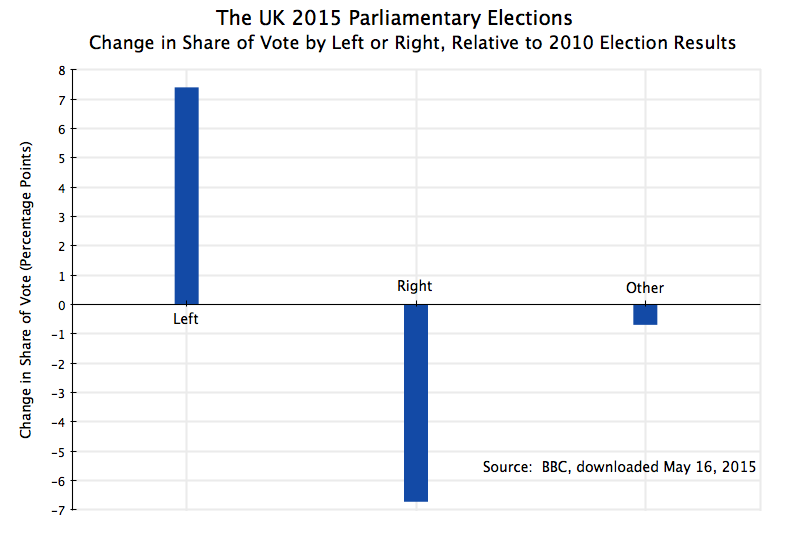
The Left gained 7.4% points of the vote, while the Right lost 6.7% points (while the Other category lost 0.7%). This would then be a pretty sharp swing to the Left.
And in terms of seats won:
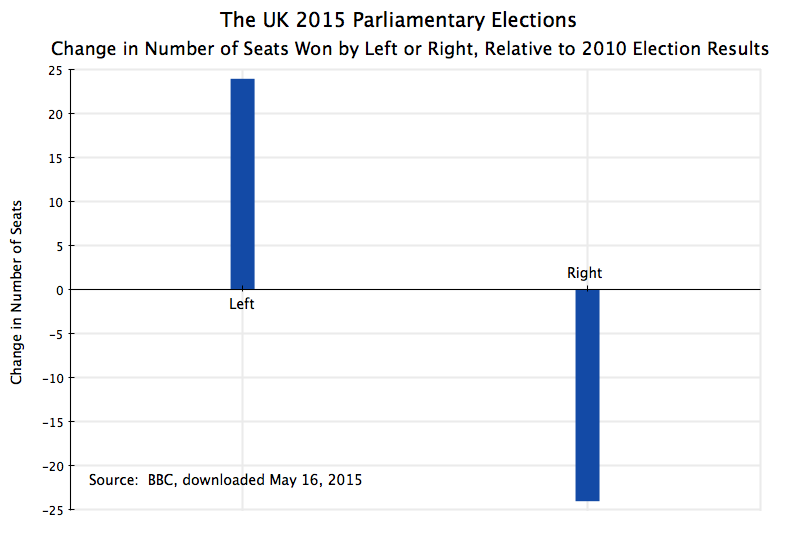
The Left gained 24 and the Right lost 24. Under a different voting system than that used in the UK, this would have been a major victory for the Left.
F. Conclusion
There can be no dispute that the Conservative Party won big in this election, while Labour lost. The Conservatives gained an absolute majority in the new Parliament, and no longer need to rule in coalition.
But this win was a result of the particular electoral rules used in the UK. The rules are what they are, and those who win by those rules are those who form the new government, but one should not then jump to the conclusion that this win by the Conservatives reflects an endorsement by the voters of their economic program. There was, rather, a big move to the Left among the electorate as a whole, to parties that strongly criticized the austerity policies of the Conservative-led government.
More fundamentally, the UK recovery from the 2008 downturn has been far too slow, with growth that is not only well below where the economy was at the same seven-year mark during the Great Depression (8% lower in real per capita terms), but also even still below where the economy was in 2008. No one can dispute that this is a terrible record.

You must be logged in to post a comment.