
A. Introduction
One of the most important issues facing the US is our high cost of health care. We have a terribly inefficient system, with the highest costs in the world (reaching 18% of GDP, which is 50% more than in the second most expensive country and close to double the average of the OECD countries), yet with only mediocre results compared to other countries. It is a market-based system, with competing health care providers (doctors, hospitals, and so on) and competing private health insurance companies. However, the extremely wide variation in prices for the same treatments and procedures (often varying by a factor of ten or more) is a clear sign that this market is not working as it should. And those skilled at exploiting these inefficiencies are able to profit handsomely, with CEOs and other senior staff of the major private insurance companies paid well. Indeed, total compensation packages have occasionally even topped $100 million.
Despite so much spending, the US is still far from providing affordable access to health care for our entire population. While the situation improved substantially following the introduction of Obamacare (with the share of the US population without any form of health insurance falling by about 40% after Obamacare went into effect), the Trump administration is doing all it can to reverse these gains.
Faced with these issues, a number of analysts and politicians (Senator Bernie Sanders as just the most prominent) have proposed that the US move to what is termed a “single-payer” system, such as what they have in Canada, France, and a number of other countries. In a single-payer system, doctors, hospitals, and healthcare service providers remain as they are now, as independent and typically private agents serving their patients. The only difference is that there is only one insurer, run as a government agency. This is what the US has in the popular Medicare system, but Medicare is restricted only to those aged 65 and above. Hence in the US context, a single-payer system for all is often referred to as “Medicare-for-All”.
A key question is whether a Medicare-for-All system would reduce the high cost of healthcare in the US. Those opposed to any such government managed programs have argued that costs would rise. And they have issued reports with headline findings that can only be interpreted as being deliberately misleading. For example, in late July, Charles Blahous (a former Bush administration official) issued an analysis through the Mercatus Center of George Mason University (a center that has received major funding from the Koch Brothers) that concluded government spending would rise by $32.6 trillion over ten years under a Medicare-for-All system. This has received a good deal of press coverage, and is being used (as I write this) in a number of ads being televised by Republican candidates in the 2018 midterm elections.
But while worded carefully, this claim is misleading in the extreme. First of all, that such high amounts will be spent on health care should not be a surprise, when added up over ten years. Total US health care spending is expected to reach $3.7 trillion this year, would rise to $5.7 trillion by 2026 if nothing is done, and would total $45.0 trillion over the ten-year period of 2017 to 2026 (using National Health Expenditure data and forecasts, which will be discussed in detail below). The portion of this covered by various forms of personal health insurance (both private and public, such as Medicare, but excluding the military and the VA) is expected to reach $2.7 trillion this year, $4.2 trillion by 2026, and would sum to $33.1 trillion over the ten years 2017 to 2026.
So high amounts will be spent on health care, unless measures are taken to improve efficiency and reduce costs. In per capita terms, the US population will be spending in 2018 an average of $8,190 per person through the various forms of personal health insurance our system currently employs. This is, without question, a lot. It will be an estimated 17.9% of the median wage this year. But if we had the far lower administrative costs that Medicare has been able to achieve for the health insurance it manages directly, instead of the significantly higher administrative costs incurred under a variety of mostly private health insurance plans (discussed below), the average per capita cost would be just $7,480 per person in 2018. There would also be other savings (such as what health care providers will enjoy from a simplified system, which we will also discuss below), but the savings from those sources, while certainly significant, are harder to estimate. The $7,480 figure simply reflects savings from lower administrative costs on the part of the insurers if we were able to achieve what Medicare already does.
Thus the correct question is whether we should prefer sending a check for $8,190 per person to Aetna, Cigna, United Healthcare, and the other insurers (and including what is paid through taxes for Medicare and other publicly managed insurance), or a check for $7,480 just to Medicare under a Medicare-for-All system. The doctors we see would be the same, and the treatments and procedures would also be the same as what we have now. The savings here is purely from more efficient administration of our health insurance. That the check in one case goes just to the government, and in the other to a mix of private and public insurers, should not be, in itself, of consequence. But the Blahous argument, in saying that we cannot afford the $32.6 trillion he forecasts for healthcare spending over ten years, is that for some reason a larger check (of $8,190) to our current mix of insurers is fine while we cannot afford to send instead a smaller check (of $7,480) if that check goes to a government entity. This is silly.
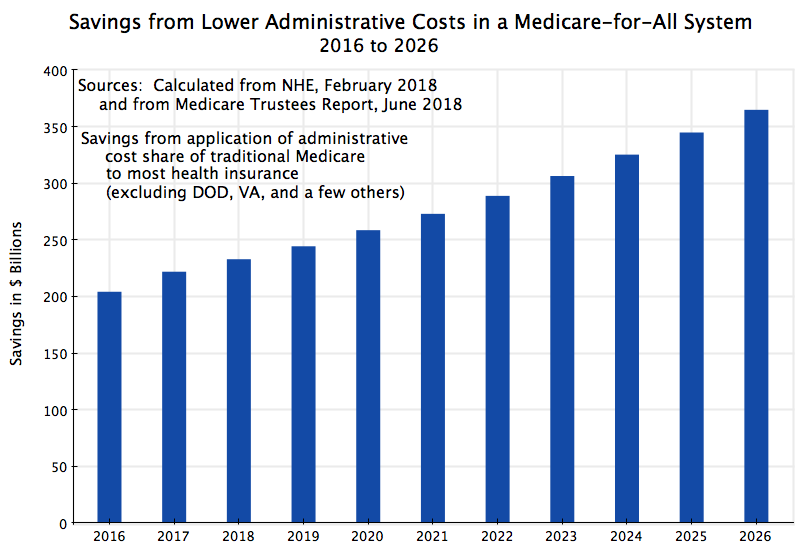
For the nation as a whole, the savings from the greater efficiency of a Medicare-for-All system is substantial. As we will see, it would add up to $204 billion in 2016, had this system been in place that year, growing to $365 billion by 2026. For the ten year period from 2017 to 2026, the savings would sum to $2.9 trillion. This is not a small sum.
This main point is that we should look at the data, and not presume certain outcomes based on ideology or political beliefs. We will thus start in this blog post with an examination of what administrative costs actually are, for Medicare and for private insurance. We will see that the cost for administering Medicare, for the portion of Medicare managed directly by government, is far less than what is spent to administer other health insurance, including in particular private health insurance. There are many reasons for this, where the most important is the relative simplicity and scale of the Medicare system. An annex to this blog will discuss in detail what these various factors are for the different health insurance systems that could be folded into a Medicare-for-All system. We will also discuss in that annex why Medicare is able to achieve its far lower administrative costs, and address some of the arguments that have mistakenly asserted that this is not the case, despite the evidence.
Taking the administrative costs that Medicare has been able to achieve as a base, we will then calculate what the savings would add up to, per year for the US as a whole, under a Medicare-for-All system. The basic result is depicted in the chart at the top of this post, and as noted above, the savings from greater administrative efficiency would rise from $204 billion in 2016 (had the system been in place then) to $365 billion in 2026.
These savings are substantial. But there are also other savings, which are, however, more difficult to estimate. The penultimate section of this post will discuss several. They include savings that will be possible in the administrative and clerical costs at doctor’s offices and at hospitals and other healthcare facilities. Doctors, hospitals, and other facilities must hire specialist staff to deal with the complex and fragmented system of insurance in the US, and the costs from this are substantial. There will also be savings on the part of employers, who must now manage and oversee the contracts they have with private insurers.
A final, concluding, section will summarize the key issues and discuss briefly why such an obvious and large saving in costs has not been politically possible in the US (at least so far). The short answer: Vested interests profit substantially under the current fragmented system, and it should not be a surprise that they do not want to see it replaced. With extra spending in the hundreds of billions of dollars each year, there is a lot to be gained by those skilled at operating in this fragmented system.
B. The Cost of Administering Current Health Insurance Plans
It is often difficult to estimate what costs and savings might be under some major reform, as we do not yet know what will happen. But this is not the case for estimating administrative costs for health insurance. We already have excellent data on what those costs actually are for a variety of different health insurance providers, including Medicare.
The primary sources of the data are the National Health Expenditure Accounts (NHE), produced annually by the Centers for Medicare and Medicaid Services, and the Annual Report of the Medicare Trustees. The current NHE (released in February 2018) provides detailed historical figures on health expenditures (broken down in numerous ways) through to 2016, plus forecasts for many of the series to 2026. And the Annual Report of the Medicare Trustees (with the most recent released in June 2018), provides detailed financial accounts, including of government administrative costs, for the different components of Medicare and the supporting trust funds (with past as well as forecast expenditures and revenues).
Table 19 of the historical tables in the most recent NHE provides a detailed break down of health care expenditures in 2016 by payer (mostly various insurance programs, both public and private). The expenditures shown include what is spent on administration by government entities (separately for state and federal, although I have aggregated the two in the table below), and for what they term the “net cost of health insurance”. The net cost of private health insurance includes all elements of the difference between what the private insurer receives in premium payments, and what the insurer pays out for health services provided by doctors, hospitals, and so on. Thus it includes such items as profits earned by the insurer. For simplicity, I will use “administrative costs” to include all these elements, including profits, even though this is a broad use of the term.
Table 19 of the NHE shows Medicare expenditures for all components of Medicare on just one line. While it shows separately the administrative costs incurred by government in the administration of Medicare (with all of it federal, as states are not involved), and the administrative costs (as defined above) incurred by private insurers for the Medicare programs that they manage, the NHE does not show separately which of those costs (government and private) are linked to which Medicare programs.
For those figures one must turn to the Medicare Trustees Annual Report. Medicare Parts A and B are managed directly by Medicare officials, and provide payments for services by hospitals (Part A) and doctors (Part B). Medicare Part C (also now called Medicare Advantage) is managed by private insurers on behalf of Medicare, and cover services that would otherwise be covered by Medicare directly in Medicare Parts A and B. And the relatively recent Medicare Part D (for prescription drugs) is also managed by private insurers, either as a stand-alone cover or folded into Medicare Advantage plans.
Any such combination of numbers from two separate sources will often lead to somewhat different estimates for those figures that can be compared directly with each other. There might be slight differences in definitions, or in concepts such as whether expenses are recorded as incurred or as paid, or something else. But the figures which could be compared here were close. In particular, the figure for total Medicare expenditures in calendar year 2016 was $678.8 billion in the Trustees report and $672.1 billion in the NHE, a difference of just 1%. Of greater relative importance, the Trustees report has a figure for government administration (for all Medicare programs combined) of $9.3 billion, while the NHE has a figure of $10.5 billion. However, while the difference between these two figures may appear to be large, what matters is not so much the difference between these two, but rather the difference (as a share of total costs) between either of these and the much higher cost share for privately managed insurance (as we will see below). We will in any case run scenarios in Section C below with each of the two different estimates for government administrative costs in Medicare, and see that the overall effect of choosing one rather than the other is not large.
Based on these sources, the costs paid in 2016 under most of the major health insurance programs in the US were:
Current Expenditures for Health Care and for Administrative Costs
|
2016 data ($ billions) |
Gross Cost |
Gov’t Admin |
Private Admin |
Total Admin |
Total as % |
|
Private Health Insurance |
$1,123.4 |
$129.6 |
$129.6 |
11.5% |
|
|
Medicare: |
$678.8 | ||||
|
Gov’t Administered |
$390.7 |
$9.3 |
$9.3 |
2.4% |
|
|
Privately Administered |
$288.1 |
$36.3 |
$36.3 |
12.6% |
|
|
Medicaid |
$565.6 |
$24.2 |
$36.1 |
$60.3 |
10.7% |
|
CHIP (Children’s Health Insurance Program) |
$16.9 |
$1.5 |
$1.4 |
$2.9 |
17.3% |
|
Worker’s Compensation |
$50.7 |
$2.3 |
$16.4 |
$18.8 |
37.0% |
|
Total: |
$2,435.3 |
$37.4 |
$219.8 |
$257.2 |
10.6% |
|
* Medicare Gov’t Admin – NHE estimate |
$390.7 |
$10.5 |
$10.5 |
2.7% |
Sources: Medicare expenditures, other than private administrative costs, are from the 2018 Medicare Trustees Annual Report. All other figures are from the NHE accounts, Table 19 (historical), released in February 2018.
The table leaves out the health care programs of the Department of Defense and the Veterans’ Administration (as they operate under special conditions, with many of the services provided directly), as well as a number of smaller government and other programs (such as for Native Americans, or worksite or school-based health programs). Those programs have been set aside here due to their special nature. But while significant, the $2,435.3 billion of expenditures in the programs listed in the table account for 89% of the total spent in the US in 2016 on all health care services to individuals covered through either some form of health insurance or third-party payer. While some portion of the remaining 11% could perhaps be folded into a Medicare-for-All system (thus leading to even higher savings), we will focus in this post on the 89%.
The table shows that the administrative cost ratios vary over a wide range, from just 2.4% for the health insurance Medicare administers directly (using the Medicare Trustees figures, or 2.7% based on the NHE figures), up to 37% for the administration of the health portions of Workers’ Compensation. The administrative cost for direct private health insurance is 11.5% on average, while the administrative cost for the privately managed portions of Medicare (Medicare Part C and Part D) is a similar, but somewhat higher, 12.6%.
This wide variation in administrative cost ratios provides clues on what is going on. These will be discussed in the Annex to this post for those interested. Briefly, the programs (other than government-administered Medicare) are complex, fragmented, have to make case by case assessments of whether the claim is eligible (as for Workers’ Compensation plans) or whether the individual meets the enrollment requirements (as for Medicaid and CHIP – the Children’s Health Insurance Program), and do not benefit from the scale economies that Medicare enjoys.
But while such explanations are of interest in understanding why Medicare can be provided at such a lower cost than private and other insurance, the key finding, in the end, is that it is. The data are clear. The next section will use this to calculate what overall savings would be at the national level if we were to move to a system with the cost efficiencies of Medicare.
C. National Savings in Administrative Costs from a Medicare-for-All System
Medicare (for the portion managed directly by government) costs far less to administer than our current health insurance system with its complex and fragmented mix of plans (most of which are privately managed). Only 2.4% of the cost of the portion of Medicare managed directly by government was needed for administration of the program in 2016, while the costs to administer the other identified health insurance programs range between 10.7% (for Medicaid) and 11.5% (for private health insurance) to 37% (for workers’ compensation plans). With $2.4 trillion spent on these health insurance plans (in 2016), the savings from a more efficient approach to administration will be significant.
An estimate of what the nation-wide savings would be can then be calculated based on figures in the NHE forecasts of health expenditures (by health insurance program) for the 2017 to 2026 period (Table 17 of the forecasts), coupled with the Medicare system forecasts provided in the Medicare Trustees Annual Report. Applying the share of administrative costs in the portion of Medicare managed directly by government (2.4% in 2016, but then using the year by year forecasts of the Medicare trustees for the full forecast period), rather than what the administrative cost ratios would have been for the other programs that would be folded into a Medicare-for-All system (private health insurance, Medicaid, CHIP, and Workers’ Compensation), using their 2016 cost ratios, yields the savings shown in the chart above.
Had a Medicare-for-All system been in effect in 2016, we would have saved $204 billion in administration, with this growing over time (with the overall growth in health expenditures over time) to an estimated $365 billion by 2026. The savings over ten years (2017 to 2026) would be $2.9 trillion, and would by itself bring down the cost of health care (for the programs covered) from a ten year total of $33.1 trillion forecast now, to $30.2 trillion with the reform. There would be other savings as well (discussed in the next section below), but they are more difficult to quantify. However, a very rough estimate is that they could be double the magnitude of the savings from the more efficient administration of health insurance alone. See the next section below for a discussion.
The calculations here required a mix of data from the NHE and from the Medicare Trustees report, and as I noted above, the estimates of the cost of government administration in these two sources were not quite the same. The Medicare Trustees report gave a figure for government administrative costs of the overall Medicare system of $9.3 billion in 2016 (and then year by year forecasts going forward to 2026), while the NHE estimate was $10.5 billion in 2016. As shown in the last line of the table above, the $10.5 billion figure would lead to an administrative cost share of 2.7%, compared to the 2.4% figure if the cost was at the NHE figure of $10.5 billion. The savings in moving to a Medicare-for-All system would then not be as large.
But the impact of this would be small. One can calculate what the cost savings would be assuming government administration would cost 2.7% rather than the 2.4% figure in the Medicare Trustees report (with also its forecasts going forward), using the same process as above. The total national savings would have been $199 billion in 2016 rather than $204 billion, growing to savings of $345 billion in 2026 rather than $365 billion. The ten-year total savings would be $2.7 trillion rather than $2.9 trillion. The savings under either estimate would be large.
D. Other Efficiency Savings in a Medicare-for-All System
The $2.9 trillion (or $2.7 trillion) figure for savings over ten years from moving to a Medicare-for-All system comes solely from the lower administrative costs that we know can be achieved in a Medicare type system – we know because we know what Medicare in fact costs. But there are other savings as well that will be gained by moving to this simpler system, and this section will discuss several of them. How much would be saved is more difficult to estimate, so we have kept these savings separate. But some rough figures are possible.
But before going to these other sources of efficiency gains, we should mention one possible source of lower costs which has often been discussed by others, but which I would not include here. It has often been asserted that Medicare pays doctors, hospitals, and other health service providers, less than what other insurance plans pay. But first, it is not clear whether this is in fact true. It might be, but I have not seen reliable data to back it up. The problem is that most of what is paid to doctors, hospitals, and others by private health insurance plans is now at network negotiated rates, and these rates are kept as trade secrets. It is not in the interest of the doctors and other health care providers to reveal them (as it would undermine their bargaining power with other insurers), nor in the interest of the insurance companies to reveal them (as other insurers would gain a competitive advantage in their negotiations with the providers). Indeed, secrecy clauses are common in the negotiated agreements.
In the absence of such publicly available data, one is limited to citing either anecdotal cases, or statements by various health care providers who have a vested interest in trying to persuade Medicare to pay them more. Neither will be reliable.
But second, and aside from this difficulty in knowing what the truth really is, the focus in this blog post is solely on the gains that could be achieved by moving to a more efficient system. If doctors and hospitals are indeed paid less under Medicare, costs would go down, but this would be in the nature of what economists call a transfer payment, not an efficiency gain. Efficiency gains come from being able to do more with less (e.g. administer more at a lower cost). Transfers are a payment from one party to another, with no net gain – the gain to one party is offset by a loss of the same amount to the other.
Excluding such transfers (if they in fact exist), what are other efficiency gains that one would obtain with a Medicare-for-All system (other than the gains from lower administrative costs for the health insurance itself, which we estimated above)? There are several:
a) Doctors offices now need to employ specialists in handling billing, who are able to handle the numerous (and often changing) health insurance plans their patients are enrolled in. These specialists are critical, and good ones are paid well, as they are needed if the doctors want to be paid in full for the services they provided. Based on personal experience, I am often amazed that the staff good at this are indeed able to stay on top of the numerous health insurance plans they must deal with (I find it difficult enough to stay on top of just my own). While essential to ensuring the doctors can survive financially, such staff are a significant cost. While one will still need to ensure proper billing under any Medicare-for-All system, it would be far simpler.
b) Similarly, hospitals and other medical facilities need to employ such specialist staff to handle billing. The same issues arise. They must contend with numerous health insurance plans, each with its own set of requirements, and ensure the bills they file with the insurers will compensate the facilities properly (and from their perspective most advantageously) for the services provided. This is not easy to do under the present highly complex system, and would be far simpler under Medicare-for-All.
c) There are also costs that must be borne by employers in managing the primarily employer-based health insurance system used in the US. The employer must work out which health insurance provider would work best for them, negotiate a complex but critical and expensive contract, and then oversee the insurer to ensure they are providing services in accordance with that contract. Firms must often hire specialist (and expensive) consultants to advise them on how best to do this. With the cost of healthcare so high in the US, these health insurance contracts are costly. It is important to get them right. But all this necessary oversight is also a major cost for the firm.
How much might then be saved from such sources by moving to a more efficient Medicare-for-All system? This is not so easy to estimate, but one study looked at the costs in the US from such expenses and compared them to similarly measured expenses in Canada, which has a single-payer system. As noted above, a Medicare-for-All system is a single-payer system, and thus (along with the other similarities between the US and Canadian economies, such as the similar levels of income) the difference between what the costs are in the US and the costs in Canada for the same services can provide an estimate of how much might be saved by moving to a single-payer, Medicare-for-All system.
The study was prepared by Steffie Woolhander (lead author – Harvard Medical School), along with Terry Campbell, and David Himmelstein, and was published in the New England Journal of Medicine, August 2003. They drew from a variety of sources to arrive at their estimates, and some had to be approximate. The data is also from 1999 – almost 20 years ago. Things may have changed, but with the upward trend in costs over time in the US, the cost shares now are likely even worse. The authors presented the basic figures in per capita terms (and all in US dollars), and I have scaled them up to what they would be in 2016 (assuming the shares are unchanged) in accordance with the overall growth in US personal health care spending (from the NHE accounts).
The results are:
|
Admin costs 1999/2016 |
Per capita in $ |
Per capita in $ |
Per capita in $ |
Total in $ billion |
|
| US – 1999 |
Canada – 1999 |
US excess – 1999 |
US excess – 2016 |
||
|
Insurance overheads |
$259 |
$47 |
$212 |
$156.9 |
|
|
Doctors, hospitals, other |
$743 |
$252 |
$491 |
$363.3 |
|
|
Doctors only |
$324 |
$107 |
$217 |
$160.6 |
|
|
Hospitals & other facilities |
$419 |
$145 |
$274 |
$202.8 |
|
|
Employers’ admin costs |
$57 |
$8 |
$49 |
$36.3 |
|
|
Total: |
$1,059 |
$307 |
$752 |
$556.5 |
|
|
Total excluding Insurance overheads |
$399.6 |
Source: Calculated from Woolhander, Campbell, and Himmelstein, “Costs of Health Care Administration in the United States and Canada”, New England Journal of Medicine, 349: 768-775, August 21, 2003.
Note: “Insurance overheads” exclude health insurer profits as well as certain expenses (such as for advertising and marketing).
The first three columns show the estimated spending in per capita terms (and in US dollars) for each category of costs, for the US, for Canada, and then for the difference between the two. US spending is always higher. Thus, for example, for the line labeled “doctors”, the authors estimate that doctor’s offices have to spend an average of $324 per every US resident for expenses related to billing and other dealings with health insurance companies in 1999. The cost in Canada with its single-payer system, in contrast, is on average just $107 per resident (in US dollar terms). The difference is $217 per person, in 1999. Grossing this up to the US population, and rescaled to total health care expenditures in the US in 2016 relative to 1999, the excess cost in the US in 2016 is an estimated $160.6 billion. This is what would be saved in the US in 2016 if doctor’s offices were able to manage their health insurance billings with the same efficiency as they can in Canada.
The other lines show the estimated savings from other sources. The top line is for insurance overheads. The estimate here is that the US would have been able to save $156.9 billion in 2016 if health insurance administration were as efficient as what is found in Canada with its single-payer system. While on the surface this appears to be less than the $204 billion savings estimated (for 2016) if the US moved to a Medicare-for-All system, they are in fact consistent. The estimate in Woolhander, et. al., of the excessive cost of health insurance administration excludes what is paid out in insurance company profits and certain other expenses (such as advertising and marketing). As discussed in the Annex below, insurance company profits can add one-third to administrative costs, so a $150 billion cost would become $200 billion when one uses the same definitions for what is encompassed. The two estimates are in fact surprisingly consistent, even though very different approaches were used for the estimation of each.
Overall, the US would have saved about $400 billion (excluding the savings from lower expenses at the insurance companies) had a single-payer system been in effect in 2016, according to these estimates. That is double the estimated $204 billion in savings from lower administration costs at the health insurers alone, estimated in the section above. These additional cost savings from moving to a Medicare-for-All system are clearly significant, but are often ignored in the debate on how much would be saved from efficiency gains in a Medicare-for-All system. They are (I would acknowledge) rough estimates. They cannot be estimated with the same precision as one can for the savings from the more efficient administration of health insurance alone under a Medicare-for-All system. But neither should they be forgotten.
E. Summary and Conclusion
Medicare is a well-managed and popular program. It is a single-payer system, but currently restricted to those aged 65 and above. And administrative costs, on that portion of Medicare managed directly by government, are only 2.4%. This 2.4% is far below the 11.5% administrative cost share for regular private health insurance, or 12.6% for that portion of Medicare that is managed through private health insurance companies.
And even with such low costs, Medicare is a popular program, where numerous surveys have found Medicare to be more highly rated (including in terms of user experiences with the program) than private health insurance plans (see, for example, here, here, here, and here).
Creating a Medicare-like system to cover also those Americans below the age of 65 would not be difficult. We already have the model of Medicare itself to see what could be done and how such a system can be managed. And we also have the examples of other countries, such as Canada, that show that such systems are not only feasible but can work well. It is also not, as conservative critics often assert, a government “takeover” of healthcare (a criticism also often used in attacks on Obamacare): Under a single-payer system, the providers of health care services (doctors, hospitals, and so on) remain as they are now, as private or non-profit entities, competing with each other in the services they offer.
Nor would an extension of health insurance under a Medicare-like system to those below age 65 lead to issues for the current Medicare system. This has now become an attack line being asserted in numerous Republican political campaigns this fall, including in a signed piece by President Trump published on October 10 by USA Today. This was in essence a campaign ad (but published for free), which fact checkers immediately saw contained numerous false statements. As Glenn Kessler noted in the Washington Post, “almost every sentence contained a misleading statement or a falsehood”.
There is no reason why extending a Medicare-like system to those below age 65 should somehow harm Medicare. The cost for the health insurance for those below age 65 would be paid for by sending the checks we currently must send to private insurers (such as Aetna or United Healthcare), instead to the new single-payer insurer. As noted above, with such an entity copying the Medicare management system and achieving its low administrative costs, we would have been able to reduce the average per person cost of healthcare in 2018 from the $8,190 we are paying now, to $7,480 instead, a savings of $710 for each of us. That $7,480 would still need to be paid in, but it is far better to send in $7,480 to the single-payer (for the same health care services as we now receive) than to send in $8,190 to the mix of insurers we now have.
Furthermore, these savings are solely from the more efficient administration of health insurance that we see can be done in Medicare. There will also be very substantial savings from other sources in a Medicare-for-All system, including in what doctors and hospitals must now spend to deal with our currently highly fragmented and complex health insurance system, and savings by employers in what they must spend to manage their employer-based private health insurance plans. The magnitude of such additional savings are more difficult to estimate, but they might be on the order of double the size of savings from the more efficient administration of the health insurance itself. That is, total savings in 2016 might have been on the order of $600 billion, or three times the $200 billion in savings from more efficient administration of health insurance alone.
And such savings (or rather the lack of it under our current complex and fragmented system) can account for a significant share of the far higher cost of health care in the US than elsewhere. As noted before, health care costs about 18% of GDP in the US, or 50% more than in the second most expensive country where it is just 12%. Had the US been able to save $600 billion in health care expenditures in 2016 by moving to a Medicare-for-All system, US healthcare spending would have been reduced from 18% of GDP to below 15% (more precisely, from 17.9% in 2016 to 14.7%). This, by itself, would have gotten us over halfway to what other countries spend. More should be done, to be sure, but such a reform would be a major step.
So why has it not been done? While the lower costs under a Medicare-for-All system would be attractive to most of us, one needs also to recognize that those higher costs are a windfall to those who are skilled at operating within our complex and fragmented system. That is, there are vested interests who benefit under the current system, and the dollar amounts involved are massive. Private health insurers, and their key staff (CEOs and others), profit handsomely under this system, and it should not be surprising that they lobby aggressively to keep it. Under a Medicare-for-All system, there would be no need (or a greatly reduced need, if some niches remain) for such private health insurance.
This is not to deny that there will be issues in any such transition. Just the paperwork involved to ensure everyone is enrolled properly will be a massive undertaking (although for all those currently enrolled in some health insurance plan, mostly via employer-based plans, the paperwork could presumably be transferred automatically to the new program). Nor can one guarantee that while on average health care consumers will save, that each and every one will. But the same is true in any tax reform, where even if taxes on average are being cut, there are some who end up paying more.
One should also acknowledge that many doctors and hospitals are concerned that in a Medicare-for-All system they will have little choice but to agree to the Medicare-approved rates for their services. However, it is not clear this is much different from the current system for the doctors, where they must either agree to accept the in-network rates negotiated with the private health insurers, or expect few patients. And surveys of doctors on their support for a Medicare-for-All system show a turnaround from earlier opposition to strong support. A survey published in August 2017 found 56% of physicians in support (and 41% opposed), a flip from the results of a similar survey in 2008 (when only 42% were in support, and 58% opposed). A key reason appears to be the costs and difficulties (discussed above) doctors face in dealing with the multiple, fragmented, insurance plans they must contend with now. Even the American Medical Association, a staunch opponent of Medicare when it was approved in the 1960s, and an opponent ever since, may now be changing its views.
Finally, 70% of Americans now support a Medicare-for-All system, according to a recent Reuters survey. It is time for such a system.
Annex: The Causes of the Wide Variation in Administrative Cost Shares
a. The Wide Range of Administrative Cost Shares
Administrative cost shares vary enormously across different health insurance programs, from just 2.4% for government-managed Medicare to 37% for health insurance provided through Workers’ Compensation plans. The figures are shown above in the top table in the post. Some might say that this cannot be – that they are all providing health insurance so why should the differ by so much. But they can and they do, and this annex will discuss why.
Take the case of Workers’ Compensation first. Workers’ Compensation insurance was established by states in the US starting in 1902 (Maryland was the first). Most states passed laws between 1910 and 1920 requiring businesses to arrange for such insurance, and by 1920 all but five states (all in the South) had such coverage (and by 1948 all states had it). And in most (but not all) states, health care benefits are provided through the purchase of privately managed insurance.
But these programs are expensive to administer. Each individual claim must be scrutinized to determine that it was in fact due to a covered workplace injury. This leads to the extremely high (37%) administrative cost share. If the injury is indeed covered, the workers’ compensation insurance arranged by the business will pay for the associated health care costs. But if it is not, the injury will now normally be covered by the individual’s regular health care insurance. The treatment is still needed, and is provided. The issue is only who pays for it.
Hence the time and effort spent to ascertain whether the injury was in fact due to a covered workplace injury is a pure social cost, and would not be needed (at least for the health care treatments) in a Medicare-for-All system. The injuries would still be treated, but funds would not need to be spent to see whether the costs can be shifted from one insurer to a different one. And when each individual claim must be assessed (with many then rejected), the administrative costs for Workers’ Compensation plans can be a high share of what is in the end paid for healthcare treatments.
When workers’ compensation programs were first set up, in the early 20th century, individual health insurance was not common. Such health insurance (set up through employers) only began to be widespread during World War II, when the Roosevelt administration approved favorable tax treatment of such insurance by businesses (who were trying to attract workers, but were subject to general wage and price controls). But workers’ compensation programs continue to exist, despite their high administrative costs. And from the point of view of the private insurer providing the workers’ compensation cover, spending such money to assess liability for some injury makes sense, as (from the private perspective of the individual insurer) they would gain if the health treatment costs can be shifted to a different insurer. But such expenditures do not make sense from the perspective of society as a whole. They are just a cost. And under a Medicare-for-All system the injury would simply be treated, with no need to ascertain if one insurer or a different one was responsible for making the payment. Overall costs would be less, with the same health care treatments provided.
There are similar socially wasteful expenditures in other health insurance programs, which drive up their administrative costs. CHIP (Children’s Health Insurance Program) has a relatively high administrative cost share (17.3% in 2016) in part because it is relatively small ($16.9 billion in expenditures in 2016, which can be compared to the $678.8 billion for Medicare), so it does not enjoy the economies of scale of other programs, but also because eligibility for the program must be assessed for each individual participating. While rules vary by state, children and teens are generally eligible for CHIP coverage up to age 18, for families whose incomes are below some limit, but who are not receiving Medicaid (or in coordination with Medicaid in certain cases). The CHIP insurance for the children and teens is then either free or low-cost, depending on family income.
Confirming that children to be enrolled under CHIP meet the eligibility requirements is costly. Hence it is not surprising that this (along with the lack of the economies of scale that larger programs can take advantage of) leads to the relatively high share for administrative costs. But this eligibility question would not be an issue that would need to be individually assessed in a Medicare-for-All system. It is a socially wasteful expenditure that is required only because the program needs to confirm those enrolled meet the specific eligibility requirements of this narrow program. And a Medicare-for-All system would of course enjoy huge economy of scale advantages.
Medicaid also has to bear the cost of assessing whether eligibility requirements have been met, and certain states are indeed now making those eligibility requirements even more burdensome and complex (in the apparent hope of reducing enrollment). Most recently, the Trump administration in early 2018 issued new rules allowing states to impose work requirements on those enrolled in Medicaid, and several states have now started to impose such restrictions. But such requirements are themselves costly to assess. While enrollment in Medicaid may then fall (leading to the health care costs of those individuals being shifted on to someone else), administrative costs as a share of what is spent will rise. But from the point of view of society as a whole, shifting the cost of health treatment for those individuals who would otherwise be enrolled in Medicare on to someone else does not save on the overall cost of health care. And indeed, if it shifts such treatment from doctor’s offices to treatment in emergency rooms, the cost will go up, and probably by a lot.
This would no longer be an issue in a Medicare-for-All system. There would be no need to waste funds on assessing whether the individual meets the eligibility requirements of some specific health insurance program or another.
Despite such special costs. the overall costs of administration for Medicaid were 10.7% in 2016. This is a bit below the cost for regular private insurance of 11.5%, and probably reflects the significant economies of scale Medicaid is able to benefit from. And while a significant share of the Medicaid administrative costs are incurred by private insurers contracted to manage the Medicaid programs in many of the states ($36 billion of the $60 billion total for administration according to the NHE figures), government itself takes on a significant share of the administration. And the overall administrative cost combined is still less than what private health insurance requires (as a share).
b) The Cost of Administering Private Health Insurance
Which brings us to the question of why private health insurance costs so much to administer, at 11.5% of the total paid for such insurance. Medicare, when administered directly by government, has a cost of just 2.4%. Why does private insurance cost so much more?
First, a note on terminology. Up to this point, as we have discussed various government health insurance plans (such as Medicaid or CHIP), we have not had to distinguish the total cost of the health insurance plans (the total of what is paid out in benefits to health care providers, plus what is paid for administration) from the total paid for the insurance cover. We need to be more precise for private insurance cover. One has the total paid in any period (a year in these figures) in insurance premia by the subscribers, and the total in what is paid by the private insurer in each such period to cover benefits. The NHE has estimates for each of these, and then calculates the difference between the two as the “net cost of health insurance”. We have referred to this as a broad concept of administrative costs, as it includes any profits earned by the insurers as part of their current operations. But private insurers have an additional source of earnings, and that is from revenues on invested capital. Premia are paid upfront and benefits paid out later (in overall probabilistic terms), and an important source of income to insurers comes from what they earn on those funds as they are invested in various asset markets, such as stocks and bonds, real estate, commodities, and so on.
For private insurance we should therefore be clear that what we have so far referred to as the “total cost” of the health insurance is synonymous with the total premia paid (which some sources refer to as “underwriting revenue”). Subtracting the total paid to health care providers under the insurance policies from the total paid in premia will then lead to the broad concept of administrative costs, including profits earned from the current period insurance operations. On top of this, private insurers will generate earnings from investments on their accumulated capital (obtained, in part, from premia being paid in before benefits are paid out). For the figures here we are excluding these latter earnings. Such earnings will be on top of those obtained from their current insurance operations.
Why then, do private insurers incur administrative costs (as defined here) of 11.5% when government-administered Medicare has a far lower cost of just 2.4%?
There are a number of reasons. First, private health insurance is a tremendously fragmented system, where health plans are mostly organized at the individual firm level. This is costly, and the cost share varies systematically by firm size. Administrative costs (including insurer profits) will typically range between 5 and 15% of the total paid for the insurance in firms with greater than 50 employees, between 15 and 25% in firms with fewer than 50 employees, and (in the period before the Obamacare market exchanges were set up) between 25 and 40% of the total for individuals seeking health insurance (see, for example, this report from the Commonwealth Fund).
These high and rising costs (in inverse direction to firm size) arise as there are significant fixed costs in setting up any such system at some firm, which leads to a high cost-share when there are fewer workers to spread it over. Commissions paid to insurance brokers also play a role, as the use of brokers is typical and especially significant for the small-group market. The Commonwealth Fund report cites figures indicating these commissions can account for 4 to 11% of the total in premia paid for insurance in such markets. And in those cases where the insurers themselves take on the risk (as opposed to simply managing the claims process while the firm itself pays the claims – this is called “self-insurance”, and is typical in large firms with 1,000 employees or more, as it ends up cheaper for such firms), the insurers must then invest significant resources in assessing the risk of the pool of workers covered in order to price the policy appropriately. The costs the insurance company will need to pay out will depend not only on the local cost of health care services (which can vary tremendously across different parts of the country), but also by the industry of the firm (as the health risks of the typical workers employed will vary by industry) and specifics of the firm being covered (such as the average age of the workers employed, the male/female ratio, and other such factors).
There are also high fixed costs of the insurers themselves under their business model. They typically offer dozens of insurance plans, each with different features on what is covered and by how much. And most of the plans are built around networks of care providers (doctors, hospitals, and so on) with whom they have individually negotiated “in-network” prices for subscribers of the particular health insurance plan. These in-network prices can still vary tremendously (even by a factor of ten or more, for those I have been able to check with my own insurer, and all for the same metropolitan area), and are set through some negotiation process. The price eventually agreed to reflects some balance in negotiating strength. If you are a hospital chain that dominates in some metro area, you will be able to negotiate a price close to what you wish to charge as the insurer has to include hospital services. Similarly, if you are an insurance company that dominates in some metro area, then the hospitals have to agree to charge something close to what you are willing to pay, as otherwise they will not have many patients. And individual doctors operating in private practices will generally have very little negotiating power.
But such negotiations (for each and every health care provider, and then for each possible service) are expensive to carry out, regardless of the outcome. And while some argue that such negotiations hold down the cost of health care, it is not at all clear that such is the case. The US, after all and as noted before, has by far the most expensive health care services in the world (close to double the average in OECD countries, as a share of GDP), and yet achieves only mediocre results. Furthermore, the actual volume of health care services provided in the US (as measured, for example, by doctor consultations per capita per year, or hospital beds per 1,000 of population, and so on) has the US at close to the bottom among OECD countries. The problem is not excessive health care services utilized, but rather their high cost in the US. Negotiated in-network pricing has not helped, and quite possibly (due to the resulting fragmentation into non-competing markets) has hurt.
This complex and fragmented system does lead, however, to high rewards to those who are good at operating in it. Hence CEOs (and other senior staff) of insurance companies skilled at this are rewarded handsomely, with such CEOs typically receiving compensation of more than $10 million a year, and in some cases far more. Indeed, as recounted in an earlier blog post, the CEO of UnitedHealth Care personally received total compensation of more than $1.3 billion over his 15-year tenure of 1991 to 2006 (even after the SEC forced him to forfeit stock options worth a further $620 million due to illegalities in how they were priced). Such salaries are reflected in the administrative costs of the health insurance plans offered, and account for a substantial share of it.
Finally, this complex and fragmented market has also led to high profits for the private health insurance companies. If this were due to the exceptional efficiency of certain of the health insurance firms as compared to others, all in a competitive market, then such high profits of such firms might be explained. But there is no indication that health insurance markets operate anywhere close to what economists would call “perfect competition”. The extremely wide variation in prices for the same health care services (often by a factor of ten or more) is a clear sign of markets that are nowhere close to perfectly competitive.
And the amount paid to cover such profits is high. For example, an examination of health insurance markets in New York State found (in data for 2006) that profits from underwriting (i.e. excluding profits from capital invested) accounted for 4.9% of total underwriting revenue (the total premia paid) before taxes, or roughly one-third of the total 14.9% in administrative costs (including underwriting profits). After taxes, it would be roughly one-quarter of the total. Applying that ratio to the 11.5% administrative cost share found in the NHE accounts for the nation as a whole in 2016, the charge to cover profits would be close to 3% points. That, by itself, would be greater than the 2.4% cost share for government-managed Medicare.
c) The Cost of Administering the Portion of Medicare Managed Directly by Government
Why, then, does the portion of Medicare (Parts A and B) managed directly by government cost so little? It is fundamentally because Medicare does not bear many of the costs discussed above for the other insurance plans, and can spread the costs that remain over a far larger enrollment base. Specifically:
1) Medicare enjoys huge economy of scale advantages: The portion of Medicare managed directly by government is huge, at $390.7 billion spent in 2016 ($381.4 billion of which went to health care providers, and only $9.3 billion to administration). And this is for a single plan. Private health insurers instead each manage dozens of plans covering millions of firms (at rates which vary firm to firm, depending on the risk pool).
2) Medicare does not have to make a determination for each individual claim as to whether it will be covered (as Workers’ Compensation plans must), nor whether the individual is eligible (other than whether they are of age 65 or more, and have paid the relevant premia and taxes). That is, Medicare does not need to contend with the complex (and now being made increasingly complex) eligibility requirements for participants in Medicaid, CHIP, and other such programs.
3) Medicare has one set of compensation rates, which doctors and hospitals accept or not. The compensation rates vary by region and other such factors, but they are not individually negotiated each year with each of the possible providers.
4) And Medicare does not have the costs private insurers need to pay to retain the CEOs and other senior staff who are skilled at operating within the fragmented US healthcare system, nor do they pay large amounts for marketing and such. Nor does Medicare pay profits, and profits, as noted above, are high for private health insurers in the US.
It is this “business model” of Medicare which keeps its costs down. It is a relatively simple model (relative to that of private insurers – no health care payment system is simple in an absolute sense), and enjoys great economies of scale. Thus Medicare can keep its costs down, and needs to spend on administration only a fraction of what private health insurers spend.
d) The Conservative Critics of Medicare Costs
There are critics who contend that Medicare costs are not in fact low. These critics have issued analyses through such groups as the Heritage Foundation (conservative, with major funding from the Koch brothers), the Cato Institute (conservative – libertarian), lobby groups with a vested interest, and publications that link back to these analyses. But these arguments are flawed. Indeed, some of the responses to the assertions are so obvious that one must assume that ideology (a view that it is impossible for government to be more efficient) was the primary driver.
These critics make three primary arguments:
1) First, several contend that Medicare does not pay for, nor include in its recorded administrative costs, the costs incurred by Social Security and other government agencies that provide services that are essential to Medicare’s operations. For example, initial enrollment in Medicare at age 65 is handled through the Social Security Administration, and Medicare premia payments (for Parts B and D) are normally collected out of Social Security checks.
However, while it is true that Social Security provides such services to Medicare, it is not true that Medicare does not pay for this. A simple look at the Medicare income and expenses tables in the Medicare Trustees Annual Report will show what those payments are. For example, for fiscal year 2017, Tables V.H1 and V.H.2 (on pages 217 and 218 of the 2018 report) indicate that $980,805,000 was paid to the Social Security Administration under the Medicare HI Trust Fund (“Hospital Insurance”, for Part A) and $1,247,226,000 under the Medicare SMI Trust Fund (“Supplementary Medical Insurance”, for Parts B and D). These are substantial amounts, and they are not hidden.
And the tables similarly show the amounts paid by Medicare (as components in its administrative costs) to other government agencies for services they provide to Medicare. These include payments made to the FBI and the Department of Justice (for fraud and abuse control), to the Office of the Secretary of Health and Human Services (HHS, for oversight) as well as to other HHS offices (such as the Inspector General), to the US Treasury, and to a number of others. They are all shown. The conservative critics who assert Medicare expenses do not include payments for such services simply never looked.
2) Second, the critics argue that while private insurers must raise the capital they need to fund their operations, and that that capital has a cost, the costs of funding Medicare’s “capital” are not counted but rather are hidden away in the overall government budget.
But this reflects a fundamental confusion on the capital requirements of established insurers, whether private or public. Insurers are not banks. Banks raise funds (at a cost) and then lends them out. Insurers take in premia payments from those insured, and at some later time make payments out under the insurance policies for covered costs. On average, the payments they make come later than the payments they receive in premia, and hence they have capital to invest. That capital is invested in stocks and bonds, real estate, commodities, or whatever, they make a return on those investments, and that return is factored into, and can reduce (not raise), the premia they need to charge to cover their overall costs.
Private insurers hence generate earnings from their capital, as it is invested as an asset. It is not a cost. Furthermore, Medicare operates in fundamentally the same way as other insurers. The Medicare Trust Funds (HI and SMI) reflect funds that have been paid in and not yet expended in covered claims or other expenses, and they earn interest on the balances in those trust funds (at the long-term US Treasury bond rate). The accounting is all there to be seen, for those interested, in the Medicare Trustees Annual Report.
3) Probably most importantly, the conservative critics of Medicare assert that it is incorrect to calculate administrative costs as a share of the total costs paid. Rather, they say those costs should be calculated per person enrolled. Since older people have far higher medical costs each year than younger people do (which is certainly true), they argue that the low administrative cost share seen in Medicare (when taken as a share of total costs) is actually a reflection of the high health care costs of the elderly.
But there are two problems with this. First, when elderly people see doctors at a pace of say 10 times a year rather than perhaps once a year when younger, they will be generating 10 times as many bills that need to be recorded and properly paid. Each bill must go through the system, checked for possible fraud, and then paid in the correct amount. That will cost more, indeed one should expect it will cost 10 times as much. And if anything, medical procedures are more complicated for the elderly (as they have more complicated medical conditions), so it should be expected that the costs to process the more complex bills will indeed go up more than in proportion to the amount spent. The conservative critics assert the costs of administering this do not go up with the more frequent billing, but rather are the same, flat, rate per person regardless of how many, how complex, and how costly the medical interventions are that they have in any given year.
Second, one has data. The Medicare Parts C (Medicare Advantage) and D (for drugs) are managed via private health insurers. And this Medicare is for the same elderly population that government-managed Medicare covers. If what the conservative critics assert is correct, then the cost of administering these privately-managed Medicare programs should be similar to the cost of administering the portion of Medicare that government manages directly. But this is not the case. Government-managed Medicare spent only 2.4% on administration in 2016, while privately-managed Medicare spent 12.6%. These are far from the same.
Indeed, the 12.6% administrative cost share for the privately-managed portion of Medicare is similar to, but a bit more than, the 11.5% share seen with regular private health insurance. This is what one would expect, where the somewhat higher cost share might well be because of the greater complexity of the medical interventions required for the elderly population.
The government-managed portion of Medicare has a far low administrative cost share than private health insurance. The conservative critics have not looked at the data.

You must be logged in to post a comment.