
A. Introduction
The vaccines available for the virus that causes Covid-19 are incredibly effective – far better than the vaccines for many diseases – but can only work if they are used. Sadly, a substantial share of the US population, particularly those who identify as conservative and Republican, are declining the opportunity to be vaccinated. While there are also those on the left who have indicated they will not be vaccinated against this terrible virus, a recent (June) Gallup survey found that while close to half (46%) of Republicans said they do not plan to accept the vaccinations, just 6% of Democrats said so. A Washington Post – ABC survey in early July found almost exactly the same results, with 47% of Republicans saying they are not likely to get the vaccination, while again only 6% of Democrats said so.
It might help convince those who are reluctant to be vaccinated to see in hard numbers how effective the vaccines have turned out to be. Part of the responsibility of the CDC is to collect and report data on disease incidence in the US as well as on the cause of all deaths in the country. All hospitals, doctor’s offices, clinics, and other health centers in the US, are required to report these to the CDC, and the CDC in turn then consolidates the information and makes it available to the public and to researchers. For Covid, the CDC has put together a separate online site providing extensive data on the spread of the disease in the country, calling it COVID Data Tracker, with the multiple individual data series updated daily.
For vaccinations against Covid, the CDC provides not only daily figures on the number of vaccinations given (down to the county level), but with this broken down by various demographic dimensions, including gender (male/female), age (9 different age groups), and ethnicity (7 groups). Each of these are tracked daily, so one can also determine trends over time. There is also daily tracking for each state (and perhaps county – I did not check) of the number of doses of each type of vaccine administered (Moderna, Pfizer, and Johnson & Johnson, and whether it was the first or second dose for Moderna and Pfizer), for key age groups (over age 65, over 18, and over 12). Many of the charts the CDC provides are then picked up in the regular news media, so people can see daily the trends in Covid-19 cases, deaths, vaccinations, and other such important information.
But the CDC is not reporting what would be an extremely useful, and hopefully convincing, daily statistic along with these numbers. And that would be not only the total number of new confirmed Covid cases that day, new hospitalizations due to Covid, and deaths due to Covid, but also how many of these are among those who have been vaccinated and among those who have not. The simple figures could be provided, or, more usefully, expressed as a count per 100,000 in the relevant population (of vaccinated and unvaccinated).
The CDC is not doing this, and it is not clear why. It may feel that the data it has is not of sufficiently high quality, but if so, one would think that a high priority would be to take whatever measures are necessary to upgrade that quality. Indeed, it is difficult to think of anything that would be a higher priority than this.
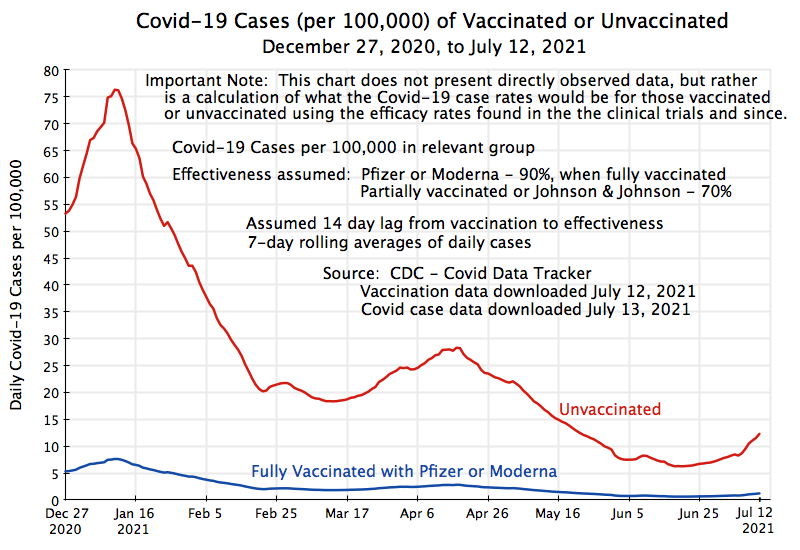
This post will discuss what a chart with such a breakdown between vaccinated and unvaccinated may look like. This chart (at the top of this post) is not based on directly reported data on Covid cases among the vaccinated and unvaccinated, as the CDC has not made whatever it has on this publicly available (at least among what I have been able to find – specialists in the field may have access to more of what the CDC has). Rather, the chart presents what the rates would be, given the observed number of daily new Covid cases in the US, and assumptions on how effective the vaccines have been.
Given the high degree of effectiveness of these vaccines in preventing Covid cases, and even more so in preventing Covid deaths, why are so many people refusing to be vaccinated? Sadly, identity politics has intervened, with many supporters of former president Trump appearing to take vaccination as a sign of disloyalty to a cause they believe in. As we will see, there is a very strong negative correlation by state between the share of the population who have been vaccinated and the share who voted for Trump.
B. Covid Case Rates Among Those Vaccinated and Those Unvaccinated
Despite its extensive reports on Covid cases and vaccinations, one key dimension that the CDC does not report is the breakdown of the daily number of new Covid-19 cases, hospitalizations, and deaths, between those who have been vaccinated and those who have not. Given the high degree of effectiveness of the vaccines (as observed in the clinical trials and in numerous studies since), one should expect huge disparities in such rates between these two groups. And seeing such disparities daily in the news might convince at least a few, and hopefully many, of those hesitant to be vaccinated to accept that they should indeed be vaccinated. It truly is a matter of survival.
So why doesn’t the CDC report this? One would think that if the CDC does not obtain such reports already, that their highest priority would be to set up the system to ensure such numbers are gathered. Anyone being tested for Covid-19 will certainly be asked if they have been vaccinated. And the first question that will likely be asked of anyone entering a hospital for suspected Covid-19 (even before they are asked their name and medical insurance number) is whether they have been vaccinated. Such information would then be recorded in (or certainly could be recorded in) the reports sent to the CDC on the number testing positive for Covid-19, and would certainly be available for anyone who has been hospitalized and then dies from Covid-19.
The CDC does appear to obtain at least partial information on the number of Covid-19 cases, hospitalizations, and deaths where vaccination status is known. But they have evidently not sought to organize a more complete and reliable system. In late May they issued a brief, non-technical, summary of data obtained on cases of Covid-19 among individuals who had been vaccinated (there were a total of 10,262, in reports from 46 states), covering the period between January 1 and April 30, 2021. But they did not put this in any context, and while they noted that 101 million Americans had been fully vaccinated as of April 30, there were far fewer (essentially zero) as of January 1. By itself, this report was basically useless. And then the CDC announced that as of May 1, it would no longer even seek to collect comprehensive data on the vaccination status of confirmed cases of Covid-19, but rather seek this only for those hospitalized due to Covid-19 or who had died from it.
It is difficult to understand why the CDC would scale back the reporting of Covid-19 cases to it, rather than upgrade the quality and completeness of what is reported. Furthermore, even with incomplete data on vaccination status of confirmed cases of Covid-19, as well as of hospitalizations and deaths from Covid-19, the CDC could still report the figures for those known to be vaccinated, those known not to be vaccinated, and those where vaccination status was not known. Such a breakdown would still show the (likely huge) disparities in the rates between those known to be vaccinated and those not. And gathering such data is critically important not only in determining the continued effectiveness (or not) of the vaccines overall against Covid-19 as mutations of the virus develop, but also the continued effectiveness (or not) of the several individual vaccines that have been approved (i.e. Moderna, Pfizer/BioNTech, and Johnson & Johnson, so far in the US).
In the absence of such real world data, the chart at the top of this post presents what the Covid-19 case rates would be under specific assumptions (based on the clinical trial results and more recent studies of efficacy among different groups) of what the effectiveness rates are. Specifically, based on the clinical trial results as well as numerous studies undertaken for various special groups since, plus being conservative (given the new mutations that have developed and spread over this time period) and rounding down, I assumed effectiveness rates of:
a) 90% for those fully vaccinated (both shots) with either the Pfizer or Moderna vaccines (and with a lag of 14 days from the second shot).
b) 70% for those partially vaccinated (one-shot) with either the Pfizer or Moderna vaccines (and with a lag of 14 days from that shot).
c) 70% for those vaccinated with the one-shot Johnson & Johnson vaccine (again with a 14-day lag).
[Side note: One will often see the terms “efficacy” and “effectiveness” used interchangeably in describing how well vaccines work. Technically, efficacy refers to how well (how effective) the vaccines perform in clinical trials, while effectiveness is the term used for how well the vaccines perform in the real world. For non-specialists, the distinction is not important.]
The chart at the top of this post shows what the respective number of daily newly confirmed Covid-19 rates would be for those fully vaccinated with the Pfizer or Moderna vaccines and for those not vaccinated with any vaccine (per 100,000 of population in each group) from December 27, 2020 (14 days after vaccinations began for the general public on December 13) to July 12, 2021. To reduce clutter in the chart, I did not show the respective curves for those partially vaccinated or those vaccinated with the Johnson & Johnson vaccines, but those numbers were part of the calculations as the fact that some were vaccinated in this way will affect the position of the curves. One has to solve a small algebra problem, as the data one has to work with are only the daily number of new cases, the number fully or partially vaccinated with one of the vaccines, and the assumed effectiveness rates (where effectiveness is defined relative to those not vaccinated). The curves for the groups who had been partially vaccinated (as of a particular date) or who had had the Johnson & Johnson vaccine, would be in between the two curves shown (given the assumed 70% effectiveness rates for each).
The chart presents what the curves would be for daily new cases of Covid-19. Also of interest are the number of those being hospitalized (indicating severe cases) and those dying from this disease. In principle, one could prepare similar charts. But here there is not as much data to go on to underlie the assumptions to be made on vaccine effectiveness. It is however clear that, given how they function, the vaccines will likely be a good deal more effective in preventing serious cases of Covid-19 (those that require hospitalization) and of deaths than their effectiveness in preventing any type of case. The reason is that exposures to the virus will be similar for those who are vaccinated and for those who are not: The virus is floating in the air (due to a contagious person nearby) and it passes up the nose of some of those passing by. But the difference then is that as the virus starts to replicate in the person’s lungs and body, the immune system of a vaccinated person will be primed and prepared to respond quickly, thus (in most cases) stopping the virus before it has replicated to levels that lead to a detectable illness. But with 90% effectiveness, a detectable illness will still occur in 10% of such cases.
Most of these illnesses will then be mild, as the immune system in a vaccinated person is already acting to drive down the virus. But some share of these will not be, possibly due to how the individual’s body had responded to the vaccine. Still, since it will be some share (well less than 100%) of the 10%, the number will be small. And it will likely be an even smaller share for those cases that turn out to be so severe that the patient dies.
With such small numbers, the effects will not be easily picked up in clinical trials. For the clinical trial used to assess the efficacy of the Pfizer/BioNTech vaccine in the US, for example, one had 43,000 volunteers enrolled, of which half received the vaccine and half received a similar looking shot but which had just saline (salt water) in it. Neither the patient nor the doctor overseeing the shots knew which it was – there was simply an identifying number to be revealed later. The volunteers would then go about their lives as they had before. Over time, some would then come down with Covid-19 (as Covid-19 was present in the country and spreading). Those that did were treated as any other Covid-19 patient would be. Once a certain number of cases arose (determined based on statistics, with 170 the trigger in the Pfizer/BioNTech trial), the identifying numbers were then, and only then, revealed. When they were, they found in this trial that 162 of those cases were of individuals who had received just saline (i.e. no vaccine) while 8 had received the vaccine. This thus showed 95% efficacy (as 8 is 5% of 162, the case burden among those not vaccinated). Note this is for the effectiveness against getting a case of Covid-19, whether mild or severe.
For hospitalizations, the numbers will be far smaller. In the Pfizer/BioNTech trial, only 10 of the 170 cases were “severe”, and of these 9 occurred in those who had the shot of saline while just one was in the vaccinated group. This is far too small a sample to come up with a figure for how effective the virus is against severe cases requiring hospitalization, although it is clear that it helped. And with no deaths at all among the 170, one can say even less.
There should, however, now be data on this in CDC files as close to half of the US population has been fully vaccinated. The CDC has not reported on this. But the Associated Press, working with experts, was able to find relevant data in the CDC files (possibly in files accessible to researchers with special software – I could not find them). The AP reported that for the month of May, only 1,200 (1.1%) of the 107,000 patients who had been hospitalized for Covid had been vaccinated. And only 150 (0.8%) of the 18,000 who had died from Covid in the month had been vaccinated. Since one-third (34%) of the US population had been fully vaccinated as of May 1 (and 43% as of May 31), the shares of those vaccinated will not be small because the number who had been vaccinated were few. Rather, the numbers give an indication that the vaccines are highly effective against severe cases of Covid developing, and even more effective against patients dying from the disease. The numbers may well be imperfect, as the CDC has warned, but the impact of vaccination is still clear.
The figures are also consistent with public statements that have been made. In late June, CDC Director Dr. Rochelle Walensky said that the vaccine is so effective the “nearly every death, especially among adults, due to Covid-19, is, at this point, entirely preventable.” On July 1, Dr. Walensky said at a White House press briefing that “preliminary data” from certain states over the last six months suggested that “99.5 percent of deaths from COVID-19 in these states have occurred in unvaccinated people”. On July 8, the White House coordinator on the coronavirus response, Jeff Zients, said “Virtually all Covid-19 hospitalizations and deaths in the United States are now occurring among unvaccinated individuals”. And on July 12, Dr. Anthony Fauci said “99.5% of people who die of Covid are unvaccinated. Only 0.5% of those who die are vaccinated” (with his source for these figures probably the same as Dr. Walensky’s).
I am sure all these statements are true. But many would find them far more convincing if they would show us the actual numbers. They could be partial, as noted above, with figures for those known to be vaccinated, known not to be vaccinated, and not known. But the CDC should make public what it has. And it would be even more convincing to show the numbers updated daily, to drive home the point, repeatedly, that vaccinations are highly effective in protecting us from suffering and possibly dying from this terrible disease.
C. The Simple Dynamics of Pandemic Spread
As the chart indicates, the likelihood of becoming a victim of Covid-19 is far less for those vaccinated. I would stress, however, that one should not jump to the conclusion that if by some miracle all of the US had been vaccinated as of December 27, that the path followed would have been the one shown in the chart for those fully vaccinated. That would not be the case. Rather, what the curves show is what the case rates would be for each such group where, as has in fact been the case, a substantial share of the population had not been vaccinated, and hence the virus continued to spread (primarily among the unvaccinated). With a substantial number of people still infecting others with the virus, a certain number of vaccinated people will still catch the virus as the vaccines, while excellent at an effectiveness of 90% or even higher, are still not 100% effective.
The dynamics would be very different, and far better, if everyone (or even just most Americans) were fully vaccinated. Indeed, under such a scenario the pandemic would soon end completely, and the line depicting cases of Covid-19 would not simply be low but at zero.
This is due to the mathematics of exponential spread of a virus in a pandemic. The virus that causes Covid-19 cannot live on its own, but only in a living person. When a person is exposed to the virus, with viral particles floating into their nose, the virus will take about a week to incubate. The person is then infectious to others for about another week. If an infected person spreads the virus on average to two others, then the number of cases will double every reproduction period (one and a half weeks on average for Covid-19). This reproduction rate is called R0 (or R-naught, or R-zero) by epidemiologists, and refers to the reproduction rate in a setting where no measures are being taken to contain the spread of the virus (no vaccines, no masks, no social distancing). For the original (pre-mutation) virus that causes Covid-19, the R0 was estimated to be between 2 and 3. With the more recent – more easily spread – delta variant of the virus, it is believed the R0 is above 3.
A virus that then spreads from one person to three every reproduction period (every week and a half on average for Covid) means that if left unchecked, 100 cases to start (week 0) would grow to 8,100 cases by week 6 and to over 650,000 cases by week 12. it is tripling every week and a half However, if everyone has had a vaccine that is 90% effective, then the reproduction rate would be reduced from 3 to 0.3. That means 100 cases to start would lead to only 30 cases in the next reproduction period and to less than one case by week 6, by which point it will have died out.
However, not everyone is vaccinated. As of the day I am writing this (July 20), the share of the population fully vaccinated is 49%. Using, for simplicity, a figure of 50%, and assuming the R0 for the mutations currently circulating in the US is 3, then the reproduction rate would fall not to 0.3 but only to 1.65 (the weighted average of half of the population at 0.3 and half still at 3). With any reproduction rate above 1.0, the spread of the virus will grow, not diminish. At a rate of 1.65, one will find by simple arithmetic that 100 cases initially (in week 0) would grow (if nothing else is done) to over 700 cases by week 6 and over 5,000 cases by week 12. While far less than with a reproduction rate of 3, it is still growing. And that is indeed what has been happening.
These numbers should be taken as illustrative as the modeling is simplistic. True modeling would take much more into account. Simple averages are assumed here, as well as no changes in other factors that affect the trends (in particular no change in the use of masks or social distancing). Also, simple averages may not work that well for Covid-19, as it appears that some people will be far more contagious than others, plus it will depend on how such individuals behave. A contagious person might spread the disease to dozens or even hundreds of others if they are in an enclosed hall, with a crowd of others who might be chanting or singing, such as at a political rally or a church service.
But the point here is that if 100% of the population were vaccinated, the curve in a chart showing the case rate among those vaccinated would not follow the curve in the chart at the top of this post. Rather, it would very quickly drop to zero. The reason why there are still cases among those vaccinated in the US is that, with only about half of the population vaccinated, the virus continues to spread among the unvaccinated. It will then spread to a certain share of the vaccinated (about 10% of those who are exposed, for vaccines that are 90% effective).
D. Why Are Some Not Accepting Vaccination?
Despite the high degree of safety and effectiveness of the vaccines, a significant share of Americans are still refusing to be vaccinated. As noted at the top of this post, recent Gallup and Washington Post – ABC polls found the almost identical results that close to half (46 or 47%) of Republicans say they are unlikely to (or definitely will not) accept vaccination, while 6% of Democrats (in both polls) said that.
Why this opposition to vaccinations, particularly among Republicans? It is always hard to discern motives and often the individuals themselves may not really know why they are opposed – they just are. Surveys may provide an indication, but are limited as the survey questionnaire will typically provide a list of possible reasons and ask the person to check all that might be a factor for them.
For example, a survey conducted by Echelon Insights, a Republican firm, in mid-April asked those surveyed who had said they will not accept a vaccination, or were not sure, to choose from a list of possible reasons for why. The top responses were (with the percentage saying yes, where one could choose multiple reasons):
a) The vaccine was developed too quickly: 48%
b) The vaccine was rushed for political reasons: 39%
c) I don’t have enough information about side effects: 37%
d) I don’t trust the information being published about the vaccine: 34%
e) I’m taking enough measures to avoid Covid-19 without the vaccine: 30%
f) I wouldn’t trust the vaccine until it’s been in use for at least a few years: 28%
g) I don’t trust any vaccines: 26%
h) I wouldn’t trust the vaccine until it’s been in use for at least several months: 20%
i) I believe I’m personally unlikely to suffer serious long term effects if I contract the coronavirus: 17%
But it is not possible to say the extent to which these were in fact the primary reasons for their hesitancy (or direct opposition) to being vaccinated, and to what extent these were just convenient responses to provide to the person conducting the survey.
There are also more bizarre reasons given by some. For example, a very recent Economist/YouGov poll (conducted between July 10 and 13) found that among those who say they will not be vaccinated, fully half (51%) said that the vaccinations are being used by the government to inject microchips into the population. A common variant of this conspiracy theory is that Bill Gates will be using the microchips to monitor and/or control us. It is hard to believe that half of those refusing to be vaccinated really believe this. Rather, it appears they have decided they do not want to be vaccinated, and then they come up with various rationalizations. Consistent with this, the Economist/YouGov poll also found that 85% of those who say they will not be vaccinated believe that the threat of the coronavirus has been exaggerated for political reasons (this despite over 600,000 Americans already having died from Covid).
This opposition has also been fed by such media groups as Fox News, with repeated segments that denigrate vaccination against this disease. As one example, In early May, Tucker Carlson, the most watched political commentator on Fox News, told his audience that as of April 23, a CDC system had recorded that 3,362 people had died following their vaccination. His report implied the vaccines caused those deaths, when this was not at all the case. Numerous fact-checkers and commentators in the media almost immediately investigated and concluded that the Carlson allegations were false (see, for example, here, here, and here). But the damage had been done.
Tucker Carlson took the figures from the Vaccine Adverse Events Recording System (VAERS), an on-line system set up by the CDC where anyone who had been vaccinated (and indeed anyone else) could make a report if they encountered some adverse event following their vaccination. It is a voluntary system, open to anyone, and you may have noticed a description of how to use it in the papers you received when you were vaccinated (at least I received it as part of the instructions when I was vaccinated in Washington, DC). Carlson’s report was that the VAERS showed 3,362 deaths between late December and April 23 (which he then extrapolated to 3,722 as of April 30).
But as the fact-checkers and commentators in the media immediately noted, just because a death was recorded by someone in the VAERS does not mean that the death was caused by the vaccine. There are a certain number of deaths every year in the US, particularly among the elderly, and one should have taken that into account before jumping to a conclusion that a 3,362 figure (or 3,722 as of end-April) was abnormal and a consequence of the vaccinations they received.
It is straightforward to calculate what the expected number of deaths would be in a normal year for the number of individuals who were vaccinated between late 2020 and the April 30 date that Carlson focussed on. About 2.9 million Americans died in 2019 (i.e. before any Covid cases or vaccinations), and simply assuming an average mortality rate of those vaccinated, the number that would be expected to die in this period in a normal year would be more than 100,000. And since those being vaccinated over this period were disproportionately the elderly (as the elderly were prioritized in these early months), the far higher mortality rates of the elderly (compared to the entire population) would lead to a number several times higher. Some of these deaths were then recorded by someone in the VAERS, but that does not mean the vaccinations caused them. Indeed, there is no evidence so far that the vaccines have caused any deaths at all (although a very small number are being investigated).
[Technical note for those interested in the details of how this calculation was done: I used the CDC numbers of those who had been fully vaccinated (as of end-December, 2020, and then daily through to April 30, 2021), the US population (332 million, from the Census Bureau), and the number of deaths in the US in 2019 (i.e. before Covid) of 2.9 million (from the CDC). From this, one can easily calculate on a spreadsheet the number of person-days (through to April 30) of those vaccinated (i.e. starting at 120 days for those vaccinated as of December 31, and then counting down to zero for those vaccinated on April 30), and take the sum of this. Dividing this total by the number of person-days in a year for the full US population (i.e. 332 million times 365) yields 3.7%. Applying this share to the 2.9 million number of deaths in a pre-Covid year means that one would have expected 108,000 of those who had been vaccinated during this period to have died during this period for reasons that had nothing to do with Covid or the vaccines. And the number dying of normal causes would likely be far higher than this 108,000, as that number is calculated assuming those being vaccinated during this period would have had the average mortality rate of the US as a whole. But a disproportionate share of those vaccinated during this period were the elderly, as they were given priority, and the elderly will of course have naturally higher mortality rates than the population as a whole. If one adjusted for the ages of those being vaccinated and then used age-specific mortality rates for these groups, the true number to expect would not be 108,000 but something far higher, and likely several times higher.]
It is not just the media, however. A number of Republican politicians are saying the same. And it is not only Republican politicians on the more extreme end of their party (such as Representative Marjorie Taylor Greene of Georgia, where Twitter has just suspended her account for 12 hours due to the misleading information she has posted on Covid-19 and the vaccines for it). One also sees this among Republican office-holders who have been perceived as coming from the party’s establishment. A prominent example is Senator Ron Johnson of Wisconsin. In early May, for example, Senator Johnson also cited the VAERS as indicating “over 3,000” had died following their being vaccinated – implying causation. And despite being called out on this by fact-checkers, Senator Johnson has continued to make these claims. The fact-checkers at the Washington Post have recently given Senator Johnson their “highest” rating of four Pinocchios for his ongoing campaign of vaccine misinformation.
It is not clear, however, the extent to which vaccine hesitancy and/or outright opposition originated in the reports and statements of media figures such as Tucker Carlson or political figures such as Senator Ron Johnson, or whether the media and political figures found it advantageous to build on such perceptions and then spur along the concerns. Which came first is not clear.
What is clear is that the issue of vaccination has become politicized, with vaccination being taken as a sign of political loyalties. One saw the same politicization with the wearing of masks. Comparing the share of state populations that have been vaccinated (fully or partially) to the share of the 2020 presidential vote in that state for Trump, one finds:
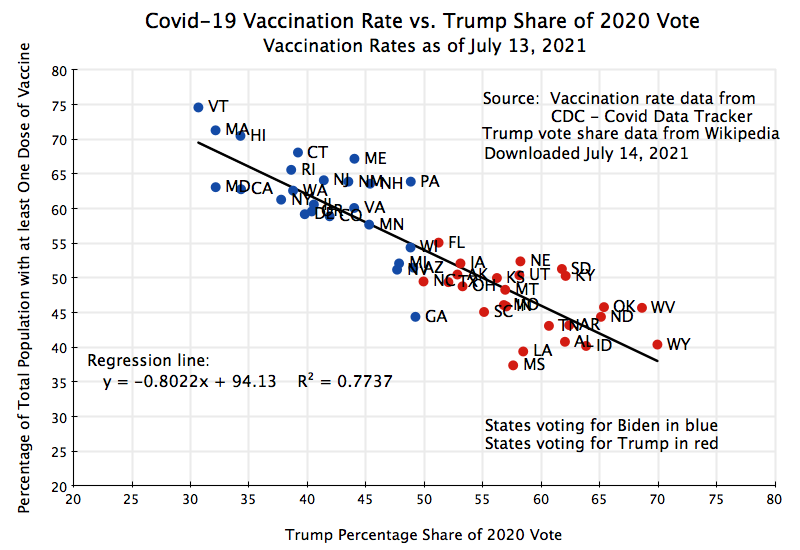
The correlation is incredibly high, with an R-squared of 0.77. On average, the regression line indicates that for every additional percentage point in the vote share of Trump, the share of the population in the state that was fully or partially vaccinated (as of July 13) was 0.8 percentage points lower. Furthermore, almost all of the states that voted for Biden have a higher share vaccinated than all of the states that voted for Trump (with the only significant exception being Georgia, and with a few states where the election was close – Arizona, Wisconsin, Michigan, and Nevada – having similar vaccination shares as some of the higher-end Trump states).
E. Conclusion
The political division is stark, and it is not clear what might change this. But with the vaccines so highly effective – against cases of Covid-19, more so against severe cases requiring hospitalization, and even more so against death – releasing hard numbers on what the rates have been among the vaccinated versus the unvaccinated may help. The numbers currently available might be imperfect, and hence require releases with three categories (vaccinated, unvaccinated, and not known), but this would still tell the story. If everyone saw each day that 995 out of 1,000 deaths had been among the unvaccinated, with only 5 among those who had been vaccinated (as Dr. Walensky’s 99.5% figure implies), self-interest in one’s own health might eventually win out.
This is obviously urgent. The chart at the top of this post was based on case data downloaded on July 13 (for Covid-19 cases as of July 12). As one can see in that chart, the daily number of new cases of Covid-19 has been rising over the last month. It reached a trough around June 20 (using a 7-day moving average of the daily cases). By July 12, the number of cases had more than doubled from this trough. As I write this on July 20, it has increased by a further more than 50% since July 12, so it is now more than triple what it was on June 20. It is spreading especially rapidly in the states with a relatively low rate of vaccination.
This increase has been due, in part, to new mutations (in particular the delta variant) that spread more rapidly than the original form of the virus. This is what one would expect from standard evolutionary theory – mutations develop and those that spread more easily will soon dominate. Adding to this is that social distancing and mask mandates have been sharply eased over the last month, leading many to act as if the virus is no longer a threat. While that would be true if everyone were vaccinated, and is greatly reduced for those who have been vaccinated, the disease will continue to spread and the threat will remain real when half the population is not.

You must be logged in to post a comment.