

A. Introduction
Gasoline prices in the US (and indeed elsewhere) are certainly high. Given that in the US much of the voting population views cheap gas as much of a right as life, liberty, and the pursuit of happiness, this has political implications. It is thus not surprising that politicians, including those in the Biden administration, are considering a range of policy measures with the hope they will bring these gas prices down. And while fuel prices have indeed come down some in the last few weeks from their recent peak, they remain high, and their path going forward remains uncertain.
One of the most common such measures, already implemented in six states (as of July 6) and under consideration in many more, has been to reduce or end completely for some period state taxes on fuels. And President Biden on June 22 called on Congress to approve a three-month suspension of federal gas and diesel taxes. The political attraction of such proposals is certainly understandable. A Morning Consult / Politico public opinion poll in March found that 72% of those surveyed would favor “a temporary break from paying state taxes on gasoline”, and 73% would favor a similar “temporary break from paying federal taxes on gasoline”. It is hard to find anything these days that close to three-quarters of the population agree on.
But would this in fact help to reduce what people are paying at the pump? The answer is no. One has to look at what led to the recent run-up in gas and other fuel prices, and only with a proper understanding of that can the appropriate policy response be worked out. Cutting taxes on fuels should not be expected to lead to a reduction in what people pay at the pump for their gas. Indeed, what could lower these prices would be to raise fuel taxes, and then use the funds generated to cover measures that would, in the near term, reduce the demand for these fuels.
This post will first examine the recent run-up in fuel prices, putting it in the context of how that market has functioned over the last decade and what is different now. Based on this, it will then look at what the impact would be of measures such as cutting fuel taxes, releasing crude oil from the nation’s Strategic Petroleum Reserve, encouraging more drilling for oil, and similar. None of these should be expected, under current conditions, to lead to lower prices at the pump.
Rather, one could raise fuel taxes and use these funds to support measures that would reduce the nation’s usage of gas. For example, an immediate action that would be effective as well as easy to implement would be to encourage ridership on our public transit systems by simply ending the charging of fares on those systems. One could stop charging those fares tomorrow – nothing special is needed. Some share of those driving their cars for commuting or for other trips would then switch to transit, which would lead to a reduction in fuel demand and from this a reduction in fuel prices. The lower price will benefit all those who buy gas, including those in rural areas who have no transit options. And as will be discussed, the cost to cover what is being collected in fares would be really quite low.
A note on usage: All references to “gas” in this post are to gasoline. They are not to natural gas (methane) nor indeed any other gas. Fuels will refer to gasoline and diesel together, where statements made with a specific reference to gas will normally apply similarly to diesel.
B. The Rise in Fuel Prices and the Factors Behind It
Fuel prices have certainly gone up in the first half of 2022. As shown in the chart at the top of this post, despite the fall in recent weeks fuel prices (the line in red) are still 75% above where they were in early-December (in June they were more than double), with those December 2021 prices double what they had been in October / November 2020. Crude oil prices (the line in black) have also been going up, and have been since late 2020 (following the dip earlier in 2020 due to the Covid lockdowns). This rise in the price of crude oil can explain the rise in the retail prices for fuels up through early this year. But as we will discuss, the factors behind the more recent rise in fuel prices changed in late February 2022 – coinciding with Russia’s invasion of Ukraine.
First, some notes on the data. The figures all come from the Energy Information Administration (EIA), part of the US Department of Energy, and weekly averages are used. For reasons to be discussed below, the price of “fuel” is a 2:1 weighted average of the prices of regular unleaded gasoline (unleaded) and diesel (ultra low-sulfur no. 2), both wholesale FOB spot prices and for delivery at the US Gulf Coast. While it is an average, this does not really matter much in practice as the wholesale prices of gas and diesel have not, at any point in time, differed by all that much from each other. They move together. Nor have their average prices over time differed by all that much. For the period since the start of 2014, the average wholesale cost of gas was $1.81 per gallon while that for diesel was $1.90 – a difference of just 9 cents. While there can be larger differences at various points in time, for the purposes here the distinction between the two fuels is not central.
The cost of crude oil (the line in black) is for West Texas Intermediate (FOB spot price, for delivery at Cushing, Oklahoma), the benchmark crude most commonly used in the US and also the basis for the main financial contracts used to hedge the price of oil in the US. It is presented here on a per-gallon basis to make it comparable to the other prices, where one barrel of oil is equivalent to 42 gallons.
A refinery will purchase crude oil and then through various processes refine that oil into gasoline, diesel, and other petroleum products that can then be used as fuels by our cars and trucks as well for other purposes. The difference in price between what the refinery can sell these finished products for and the cost of the crude it buys as the primary input is called the “crack spread”. While the crack spread will be unique for each refinery, as it will depend on the technology it has (how modern and efficient it is), what types of crude it has been designed to process most efficiently (as different crudes have different characteristics, such as viscosity and sulfur content), the mix of specific products it produces (the share ending as gas or diesel, but also jet fuel, heating oil, etc.), and the location of the refinery (as the crude oil must be delivered to it, and it then must arrange for the delivery of its products to the ultimate purchasers), a simplified standard spread is often calculated to provide an indication of how market prices are moving. The most common such standard spread is called the “3-2-1 crack spread”.
The 3-2-1 crack spread is calculated for a refinery that would process 3 barrels of crude oil into 2 barrels of gasoline and 1 barrel of diesel. For the calculations here, all were expressed on a per-gallon basis, and the specific fuels and delivery locations are as specified above. The 3-2-1 crack spread is then simply calculated as the value of two gallons of gasoline plus one gallon of diesel, minus the cost of three gallons of crude oil, with that total then divided by three as three gallons of fuel are being produced. It is a gross spread, as a refinery will of course have other operational costs (including the cost of labor), plus the refinery will need to generate a return on the capital invested for it to be viable in the long term. But this simple gross spread is often used as an indicator of what is happening in the market.
That calculated 3-2-1 crack spread is presented as the blue line in the chart at the top of this post. From 2014 through 2021, it rarely moved above $0.50 per gallon, and it averaged just $0.36 per gallon over the period. In 2021 it was not much higher, averaging $0.42 per gallon over the year. But from late February 2022, coinciding with the Russian invasion of Ukraine, it has shot upward. As of the week ending June 24 it had reached $1.46 per gallon, but as of the week ending July 8 it had come down to $1.02. That is still high – it is still close to three times what it had averaged before.
To understand the factors that led to this jump in the crack spread this year, one should first consider how prices are determined in these markets. The key is that the crack spread is not itself an independently determined price, but rather a spread between the price of the final product (gasoline and diesel fuels) and the price of crude oil, both of which are determined independently.
Start with the final products – gasoline and diesel: These are sold in highly competitive markets of numerous gas stations pricing their product to sell at the best prices they can get, but where for the nation as a whole, stocks of the fuels are kept within a narrow range. One can calculate (again from EIA data), that in recent years (2017 through 2022H1), the nation’s stocks of motor gasoline have averaged 236 million barrels, with no clear upward or downward trend. While the stocks will vary over the course of the year due to seasonality, at comparable weeks in the year they have been kept in a relatively narrow range, with a standard deviation of just 2.1% of the weekly averages over this period. This means (assuming a normal distribution, which is reasonable) that in about two-thirds of the weekly cases, the stocks will be within +/- 2.1% of the average for those weeks (one standard deviation), and in 95% of the cases will be within +/-4.2% of the averages (two standard deviations). That is, the stocks are managed to stay within a relatively narrow range, although at a target level that depends on the season of the year.
In such a market, if producers (either directly or through the gas stations they contract with) price their gasoline at too low a price for the conditions of the time, they will find that their stocks will be running down – soon to unsustainable levels. They would need to ration what they sell, either by long lines at the pumps or by some direct rationing system. And if they price their gasoline at too high a price, they will find their stocks accumulating to levels that exceed what they can store. They sell their gas for the highest price they can get, but that price will be constrained to be such that they will be able to manage their inventories of refined gasoline (and similarly for diesel fuels) to within a certain range. And as noted above, that range is a narrow one of normally just +/- 2% or so.
Crude oil prices are determined differently. Here there is a world market, where OPEC producers (as well as a few producers who cooperate with OPEC, where the most prominent is Russia) set production ceilings by OPEC member (and cooperative partner) with the aim of achieving some price target. They do not always succeed in achieving that target, as global conditions can change suddenly. Recent examples include conditions triggered by the Covid crisis in 2020, or by the global financial crisis that began in the US in 2008. OPEC also responds sluggishly to changes in the markets, particularly when crude oil prices are rising – which many OPEC members are rather pleased with – as the production quotas must be negotiated among the members. But it is correct to say that the market for crude oil is a managed one, although often not a terribly well managed one due to the inherent difficulty in forecasting global demands and then responding on a timely basis to unexpected changes.
With the retail price of the fuels determined on the one side by conditions in the competitive markets for fuels, and the price of crude oil determined on the other side by the actions of OPEC and those who cooperate with it, the crack spread will be a margin that has now been determined. That is, it is not a price that the refiners themselves will normally be able to set. There is a lower limit, as a gross crack spread that is too low to cover their other operating costs (and is expected to stay that low for some time), will lead refiners to shut down their operations. But based on what we observe for the period from 2014 in the chart at the top of this post, it appears that a crack spread of $0.36 per gallon (the average from 2014 through 2021) is sufficient to cover such costs as well as provide a return on the capital invested, as refineries stayed open and continued to produce over this period with such a spread.
This spread then jumped in late February of this year – coinciding with the Russian invasion of Ukraine – to a level that has been between three and four times what it was before. What happened? While the Russian invasion was clearly significant, one should look at this in the context of where the market was just prior to the invasion. It was tight, and the Russian invasion should be seen as a tipping point where refinery supplies of these fuels could no longer meet the demand.
First of all, demand has been growing, both in the US and in the rest of the world, as economies have recovered from the lockdowns that were necessary at the start of the Covid crisis. The US enjoyed a particularly strong recovery in 2021, with real GDP growing by 5.7% – the fastest such growth in any calendar year in the US in close to 40 years. And the personal consumption component of GDP rose by 7.9% in 2021 – the fastest such growth in any year since 1946! But it should be recognized that this was coming after the sharp falls in 2020 due to Covid (of 3.4% for GDP and 3.8% for personal consumption). The rest of the world recovered similarly in 2021, although at various different rates.
This raised the demand for gas, diesel, and other fuels. Petroleum refineries could keep up in 2021, as this followed the lower demands they had for their products in 2020. But the lower demands (and hence lower refinery throughputs) in 2020 due to Covid did have an effect. It led to decisions to close some of that refinery capacity, leading to a reduction in capacity in 2021 for the first time in decades. Albeit small, worldwide, refinery capacity fell from 102.3 million barrels per day in 2020 to 101.9 million barrels in 2021 (a fall of 0.4%). Refinery capacity in the US fell similarly, from 18.1 million barrels per day in 2020 to 17.9 million barrels in 2021 (a fall of 1.1%). With the recovery in demand for fuel products in 2021, this placed producers at closer to their limits.
But the limit to how much petroleum refineries can produce is pretty rigid. They normally operate on a continuous, 24-hours a day, basis – at a rate as close as possible to their design capacity. Thus they cannot increase production by adding an extra work shift or by running processes at a faster rate. They do need to shut down periodically for preventive maintenance, as their systems are complex and they must deal with flammable liquids that are being processed at often high temperatures and pressures, where a failure of some part can lead to a catastrophic explosion. They must also shut down on occasion for safety reasons, such as when a hurricane or other major storm threatens (an increasingly frequent occurrence in recent years in the US Gulf Coast, where much of the US refinery capacity is located, due to climate change – such weather-related shutdowns are discussed further below). In general, then, refinery throughput is highly constrained in the short run by existing available capacity, which is being run continuously at as high a rate as they can.
Over the longer term, refinery capacity will depend on what investments are made to expand that capacity. But new refineries cost billions of dollars, are rare, and when undertaken take many years to plan and then build. Significant expansions in existing refineries are also very costly, and also require significant time to plan and then build. Thus such investments are very carefully considered and are only made when they expect there will be a demand for the products of those refineries for many years to come – at least a decade or more. It is not something they rush into. Even if capacity is tight right now, such investments will not be made unless the owners expect those conditions to last for an extended time. And even if the decision is made to make such an investment to expand capacity, it will normally take years before the added capacity will become available.
Thus in the near term, when one is already operating at close to the design limits of the refineries it will not be possible to supply much more than what the existing available capacity will allow. Economists call this “inelastic supply”, as the percentage increase in supply of some product for some given percentage increase in the price that would be paid for that product (an “elasticity”) is low. For refineries that are already operating at close to their technical limits, it will be very low.
The other factor in price determination is demand. And for fuels such as gas or diesel, many will say the price elasticity of demand for such fuels is also low. Indeed, a common view in the general population is that the price elasticity of demand for gas is zero – that they will have to buy the same number of gallons each week whatever the price is. This is not really true (and contradicted by the assertion that they also cannot “afford” to pay more – if true, then at a higher price they will have to buy less). But studies have found that while not zero, it is low.
For example, the Energy Information Agency in 2014 estimated the price elasticity of demand for gasoline in the US was just -0.02 to -0.04. That is tiny. It implies that if the price of gas were to rise by 10% (say from $4.00 to $4.40 per gallon), the demand for gas would decline only by 0.2 to 0.4%. Other estimates that have been made have often been somewhat higher, although still low. A widely cited review in 1998 by Molly Esprey, for example, examined 300 published studies, and found that the median estimate of this elasticity across those studies was -0.23. This is still low. It implies that a 10% increase in the price will be met by only a 2.3% fall in demand.
With a demand for fuel that does not go down by much when prices rise, and a supply for fuel that does not go up by much when prices rise (i.e. when refineries are already operating at close to their capacity), one should expect prices for fuels to be volatile. And they are. Even small shifts in the available supply or in the demand can lead to big changes in prices.
In these already tight markets of early 2022, Russia then invaded Ukraine on February 24. The crack spread rose from $0.49 per gallon for the week ending February 25, to $0.64 the following week and to $0.74 the week after that. It reached $0.88 by the end of March and $1.35 by the end of April. As of the week ending June 24 it had reached $1.46, but then came down to $1.02 two weeks later.
The Russian invasion not only affected production at refineries in Ukraine, but international sanctions on Russia meant a significant share of Russian refineries would also no longer supply global markets. While refineries in Ukraine are not a significant share of global capacity (just 0.2% in 2021), refineries in Russia are significant, with a 6.7% share of global capacity in 2021. As a comparison, US refineries account for 17.6% of global capacity.
One should note that this does not mean that global capacity was effectively reduced by 6.7% of what it was. Russian refineries continued to produce for their own markets, while also supplying others. But the sanctions have reduced the volume effectively available by a significant amount.
In a market that was already tight, with refineries operating at close to capacity following the strong recovery demand in 2021 in the US and much of the world, such a reduction in effective supply acted as a tipping point. The 3-2-1 crack spread shot up immediately.
C. Policy Implications
What, then, can be done to reduce fuel prices? I will take it as a given that that is the objective. A case could well be made that to address climate change and the consequent need to reduce the burning of fossil fuels, high prices are good. But while important, that is a separate issue I am not trying to address in this post.
First, where are gas prices now?:

The figures here are based on data gathered by the Bureau of Labor Statistics (BLS) for its calculations of the monthly CPI. The figures are a consistent series going back to 1976 (further back than any other consistent series I have been able to find), are available in current price terms per gallon, and are not (here) seasonally adjusted so they reflect the actual prices paid that month. And like the overall CPI that is commonly cited, it is an estimate of prices in urban areas.
As of June 2022, the average retail price of regular unleaded gasoline in the US was $5.058 per gallon. For the chart, I have then shown what the historical prices would have been when adjusted for general inflation to the prices of June 2022 (based on the overall CPI). The June prices are not the highest gas prices have been – they hit $5.51 a gallon in July 2008 – but they are close. Although declining in recent weeks as I am writing this, it remains to be seen whether gas prices might resume their upward trend sometime soon. The markets continue to be volatile, and prices could soon set a new record.
Whether that will happen will depend in part on what the policy response now is. There are measures that can be taken that will reduce prices, but also measures that are being discussed that would likely have little effect, or might even raise prices. In this section, I will first discuss why, given the underlying causes of the price increases this year discussed above, some of the measures being discussed will likely do little and might indeed be counterproductive. I will then discuss measures that could help lead to a reduction in prices.
1) What Not To Do
First, some policies that will not lead to lower prices, or might even lead to higher prices:
a) Perhaps the most widespread assumption is that if OPEC produced more crude oil, gasoline prices would then fall. But that should not be expected given the current situation. As seen in the chart at the top of this post, the crack spread widened sharply starting in late February, as a certain share of global refining capacity became not usable. In the already tight markets refinery capacity became the effective binding constraint, not the price of crude oil.
More crude oil production by OPEC (or indeed by anyone) could well lead to lower crude oil prices – and indeed likely would. But unless more of that crude oil can be refined into final fuel products such as gasoline, the available supply of gas in the market would not be affected. Retail prices would remain the same. What would change is that if crude oil prices decline by some amount with the increased supply of crude, the crack spread would widen. That is, refiners would gain by this. Consumers would not.
b) For the same reason, sale of crude oil out of the Strategic Petroleum Reserve should not be expected to lead to lower retail prices for gas either. President Biden announced on March 31 that the US would start to sell one million barrels of crude oil per day (an unprecedented amount) out of the US Strategic Petroleum Reserve for at least six months. This announcement may well have had some effect on crude oil prices: Crude oil prices had been rising through late March and then fell a bit (before returning to March levels in late May, and then continuing to rise until mid-June). But this did not affect retail prices for fuels, which continued to rise until the last few weeks. Rather, the crack spread rose (as seen in the chart at the top of this post) as refiners were able to obtain a larger margin between what they could sell their products for and what they had to pay for their crude oil.
c) Also popular has been the proposal to reduce or eliminate taxes on the sale of gas and other fuels. The federal tax is 18.4 cents per gallon on gasoline and 24.4 cents on diesel, while state taxes are of varying amounts.
President Biden on June 24 called on Congress to approve a temporary suspension of federal taxes on gas and diesel for three months. As of my writing this, Congress had not approved such a suspension (it would complicate infrastructure funding, as such funding is linked to fuel tax revenues), and it does not look likely that it will. But one never knows. And as of July 6, six states had suspended their state fuel taxes for varying periods, with many more considering it.
What effect would such a tax cut have? First, consider the federal tax, as it applies across the entire country. As discussed above, the supply of fuels such as gas and diesel is constrained by available refinery capacity. Economists refer to this as operating where the supply curve is “vertical”, in that a higher price for the fuel cannot elicit a significant increase in the supply of the fuel in the near-term, due to the capacity constraint. A lower tax will not then lead to a lower price, as a lower price (if one saw it) would lead to greater demands for the fuels and refiners cannot supply more. In such a situation, refiners are earning a rent, and a lower tax to be paid on the fuels will just mean that the refiners will be able to earn an even larger profit than they are already. The crack spread will go up by the amount the tax on fuels is reduced.
The situation would be different if refiners could supply a higher amount. Retail prices would fall by some amount due to the reduction in the tax, supplies would rise by some amount, and in the end consumers and refiners would share in the near-term gains from the lower tax. What those relative shares will be will depend on how responsive the supply of fuels would be from the refiners (the elasticity of supply). In the extremes, if refiners are able and willing to supply the increase in demand at an unchanged price (the supply curve is flat), then retail prices will fall by the entire amount of the tax cut and consumers will enjoy all of the benefit. But if refiners are unable to supply more due to capacity constraints, then retail prices will be unchanged by the tax cut and refiners will pocket the full amount of the tax cut. Currently, we are far closer to the latter set of circumstances than to the former.
The situation is a bit different at the state level. If one state cuts its taxes while the taxes remain the same elsewhere, refiners will be able to move product to meet the higher sales of fuels in the state where taxes were cut. This would, however, be at the expense of lower supply in the states that did not cut their taxes. Fuel prices in the state cutting its taxes (and not matched by others) will fall by some amount due to the now higher availability of fuels in that state. But with the overall supply constrained by what the refineries can produce, the lower amounts supplied to the rest of the country will lead to higher prices in the rest of the country.
Overall there will be no benefit, and indeed on average prices (net of taxes) will rise. But there will be some redistribution across the states. The amount will depend on what share of the states decide to cut their taxes. At one extreme, if only one state does it and that state does not account for a large share of the overall US market, then the retail price (inclusive of taxes) will fall in that state. If that state is small, prices elsewhere in the country would only rise by a small amount, but they still would rise. But if more and more states decide to cut their fuel taxes, then one will approach the situation discussed above with the cut in federal taxes on fuels. The full benefits of the lower taxes will accrue to the oil refiners, not to any consumers.
Finally, one needs to recognize that there is no free lunch. The states cutting their fuel taxes will need to make up for the revenues they consequently lose. To fund the expenditures paid for by the fuel taxes (often investments in road and other infrastructure), those states would need to raise their taxes on something else.
2) What To Do
So what would lead to lower fuel prices given the current conditions? The simple fact is that for prices to go down, one will need either to increase the supply of the refined products, or reduce the demand for them. Taking up each:
a) As was discussed above, refineries normally operate at close to their maximum capacity, and there is not much margin to respond to unforeseen demands. Refineries are expensive, hence are not designed with much excess capacity to spare, and when operating are operated on a continuous, 24-hour a day, basis. They also need to be shut down periodically for scheduled maintenance, as well as when unscheduled maintenance is required or when a strong storm threatens.
Still, there might be some measures that can be taken to push refinery throughput at least a bit higher. Refiners certainly have an incentive to do so, given how high the crack spread is now (three to four times higher in recent months than what it was on average between 2014 and 2021). But the crack spread does not need to be anywhere close to that high to provide a strong incentive. A spread that is double what it would be in more normal times should more than suffice to elicit refiners to do whatever they can to maximize refinery throughputs.
There will also be an element of luck, given the increasingly volatile weather conditions that climate change has brought. One can see this in a simple snapshot of a chart available on the EIA website, showing idle US refinery capacity (which is more properly measured by and referred to as distillation capacity) by month going back to 1985:
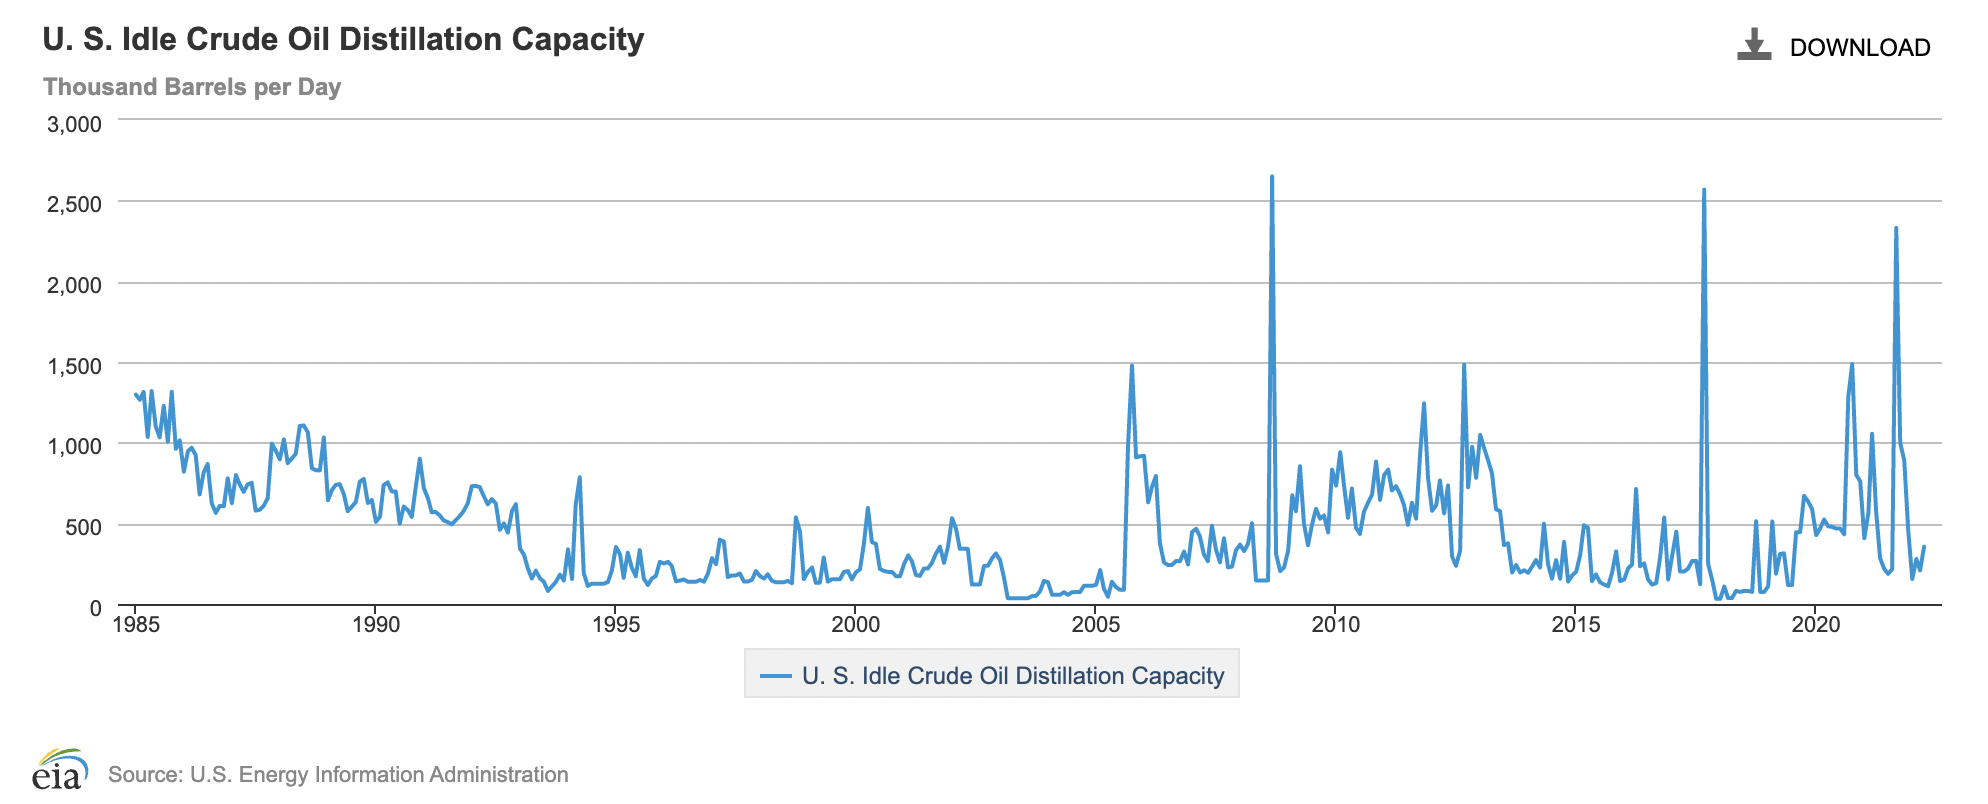
Volatility rose significantly starting in 2005 (the year of Hurricanes Katrina and Rita) and has been high since. The sharp peaks seen in the chart are all in September or October – the peak months of hurricane season for the US. Especially prominent peaks in the capacity that had to be idled were in September 2008 (Hurricanes Gustav and Ike), September 2017 (Hurricane Harvey), and September 2021 (Hurricane Ida). With hurricanes threatening, refineries must be shut down for safety. How fast they can then reopen depends on how much damage was done, but will require some time even if there was only limited damage.
It is impossible to say what will happen in the upcoming hurricane season. But with the market so tight, any closures could have a large impact on prices.
b) The other side to focus on is demand. This could also be more productive in the near term given that little more may be possible on the supply side (as well as subject to chance, given the uncertainty in what will happen in the upcoming hurricane season). But progress on demand-side measures will depend on political will, and Americans have been historically averse to measures that would reduce the near-term demand for fuels.
But it is important to recognize that not much would be needed in terms of reduced demand in order to reduce fuel prices by a substantial amount. This is precisely because the demand for fuels is so price inelastic, as discussed before. That is, a substantially higher price for gas does not lead to all that much of a reduction in the quantity of it purchased. What economists call the “demand curve” (the amount purchased at any given price) is close to vertical. When this is coupled with an also close to vertical supply curve for refined products (as refineries are operating close to their capacity, and cannot produce more no matter what price they can get), small shifts in the amount demanded at any given price will have a major effect.
[An annex at the end of this post uses simple supply and demand curves to examine this graphically.]
Given this lack of sensitivity to price under current conditions for both supply and demand, it would not take all that much to get prices to fall by a substantial amount. Supply of refined products is constrained by refineries operating at close to their maximum, while on the demand side, purchases of fuels do not adjust by much when prices change. As was noted above, the EIA in 2014 published an estimate of the price elasticity of demand for gasoline of just -0.02 to -0.04. That implies that a 10% rise in the price of gas would reduce demand by only 0.2 to 0.4%. Others have estimated higher elasticities, but all still relatively low.
Suppose, for the sake of illustration, that the price elasticity of demand was -0.10, so that a 10% rise in the price would lead to a reduction in demand of 1%. This relationship also tells us a good deal about the shape of the demand curve – specifically its slope (locally). If facing a completely vertical supply curve, then it implies that a 1% reduction in the demand for gasoline at any given price (meaning a shift in that demand curve to the left by 1%) would lead to a new price that is 10% lower than before. And a 2% shift would lead to a price that is 20% lower. While extrapolating in this way from what might be true for small changes to something substantially larger is dangerous, a 20% fall in the price of gas that is at $5.00 per gallon would lead to a new price of $4.00 per gallon – all resulting from just a 2% shift in the demand. This is substantial but depends, as noted above, on how responsive demand is to the price. If truly not very responsive, as is commonly held by many, then it will not take much of a reduction in demand (at any given price) to lead to a very substantial reduction in the price.
How, then, might one reduce the demand for fuels? One possibility would be to encourage more work from home. One saw the effect of this on fuel demands (and hence prices) in 2020, when working from home was required for health reasons at the start of the Covid crisis. Workers are now returning to the office, but perhaps our political leaders should encourage a delay in this, or at least a slower pace on the return. But it probably could not be mandated, and indeed probably should not be simply for the sake of cutting the price of gasoline. And while opinions differ on this, some would say that extending work-from-home even further will reduce worker productivity.
A better way to reduce fuel demands would be to provide a greater incentive to take public transit rather than drive a car for a higher share of the trips one undertakes. One could do the following: First, raise tax revenues that could be used for these measures by raising federal taxes on fuels by, say, $0.25 per gallon. As was noted above, when one is operating with a vertical supply curve, as we are now, increasing taxes on fuels will not lead to higher prices for the consumer. The crack spread would fall, but with that spread that has varied between $1.00 and $1.50 per gallon in recent months, a higher fuel tax of $0.25 per gallon would still leave that crack spread at two to three times the $0.36 it averaged before.
According to EIA data, the total supply of motor gasoline in the US averaged 9.3 million barrels per day between 2016 and 2019 (taking a four-year average, and excluding 2020 due to Covid), while diesel supply averaged 4.0 million barrels per day. Mutliplying this sum of 13.3 million barrels per day by 42 gallons per barrel and 365 days per year, the annual supply of these fuels averaged 204 billion gallons. Rounding this to 200 billion gallons, a tax of $0.25 per gallon would raise $50 billion on an annualized basis.
This could be used to support public transit. Something that could be done instantly (starting literally the next day) would be simply to stop charging fares on public transit systems – including buses, rail (subways), commuter trains, and whatever. According to the National Transit Database, in 2019 all these public transit systems generated a total of $16.1 billion in revenues, mostly from fares but including also other locally-generated revenues such as from the sale of advertising. (Again, 2020 was an unrepresentative year due to Covid so it is better to use 2019 figures.) The database does not separate out fares from other revenues, but even if one treated it all as fares, the $16 billion needed would be far below the $50 billion that would be generated (on an annualized basis) by increasing the federal tax on gasoline and diesel by $0.25.
Filling empty seats on buses and subways also does not cost anything. Indeed, operating costs would in fact go down by not having to collect fares. There are significant direct costs in collecting fares (and to ensure too much is not stolen), but one would also gain operational efficiencies. Buses now take a relatively long time to cover some route in part because at each stop people have to line up and go one-by-one through the front door to pay their fares in some way. Not having to take so long at each stop would allow the buses to cover their routes at a faster pace. This would increase effective capacity or, if capacity were to be kept the same as before, one could provide that capacity with fewer buses and their drivers.
The aim is to shift people from driving their cars to taking public transit for a higher share of the trips they take. To the extent this simply fills up some of the empty seats, there is then no additional cost. But if ridership increases by a substantial amount (something to hope for), capacity would need to grow. This could most easily be accommodated by additional buses. This would cost something, but according to the National Transit Database figures, the total spent in 2019 from all sources (federal, state, and local), for all modes of public transit, for both operating and capital costs, was $79 billion. With the $34 billion left after using $16 billion to cover fares (out of the $50 billion that the $0.25 per gallon would collect), one could cover an increase in spending on public transit of more than 40%. This would be far more than what would be needed even with a huge increase in ridership. But we are now going beyond the very short-term measures that could be taken to reduce fuel demand. However, with the long-term need to reduce the burning of fossil fuels, it is good to see that even a relatively modest fee of just $0.25 per gallon of fuel could support such an expansion in public transit.
Such an approach would lead to a reduction in the demand for those fuels. How much I cannot say with the information I have, but it should be substantial. And as discussed before, even a small reduction in the demand for these fuels should lead to a substantial fall in their price. That fall in price would also be of benefit to all those who purchase these fuels, including those in rural areas who are far from any public transit option. It would be a mistake to presume that stopping the collection of fares on public transit systems would only be of benefit to the users of public transit.
D. Concluding Remarks
The price of gas is certainly high. Although not quite a record (when general inflation is accounted for) it is close. This has led to a number of proposals aimed at reducing those prices. Particularly popular politically has been to cut fuel taxes for at least some period, with this championed both by President Biden (for federal fuel taxes) and in a number of states (where several have done this already for the state-level fuel taxes). Many also blame OPEC for managing supplies in order to drive crude oil prices higher. To address this, there have both been major sales out of the Strategic Petroleum Reserve (of one million barrels of crude a day), as well as diplomacy to try to get others to boost their supply of oil.
Under current market conditions, however, these initiatives should not be expected to reduce prices. The issue right now is that refineries are the binding constraint. They are producing as much of the refined products (fuels, etc.) as they can, but limits on their capacity keep them from producing more. One sees this in the crack spread, which jumped up in late February immediately following the Russian invasion of Ukraine. A substantial share of Russian refinery capacity became unusable, and this served as a tipping point in an already tight market.
Under such conditions, a lower price for crude oil will not lead to lower retail prices for fuels. While it would benefit refiners (the crack spread would widen), the prices at the pump would not be affected unless refiners were somehow then able to raise their production. Similarly, a cut in fuel taxes should not be expected to lead to lower fuel prices at the pump. Rather, refiners would receive a windfall as they would receive a higher share of the retail price. Refiners are already doing extremely well, with a crack spread in recent months that has been three to four times what it averaged between 2014 and 2021. There is no need to make this even more generous.
To reduce retail prices, one should instead reduce demand. One measure that would do this would be simply to stop charging fares on public transit. Inducing only some of those now driving to use transit more often could have a significant impact on prices. This is because the demand for fuels is not terribly responsive to price (consumers in the US do not cut back on their car use all that much when prices are higher), at the same time as the supply of fuels is limited by refinery capacity (so the supply of fuels cannot go up by much despite higher prices). With both the demand and supply curves close to vertical, a small shift left or right in the curves can have a big impact on prices.
It would not cost all that much to end the collection of transit fares either. Not only can it be done instantly (simply stop collecting), but the total public transit systems received in 2019 in fares paid (as well as in other revenues, such as from advertising) was only $16 billion. One could easily cover this by increasing the federal taxes on fuels. As noted above, a cut in fuel taxes would not lead to lower fuel prices. For the same reason, an increase in fuel taxes (within limits) would not lead to higher fuel prices. And just a $0.25 per gallon increase in federal fuel taxes would raise roughly $50 billion on an annualized basis.
It should be kept in mind that all this is based on current market conditions. Those conditions can change, and change suddenly – as we saw in late February with the launch of the Russian invasion. Thus, for example, while the crack spread is currently very high, this is in part a function of where crude oil prices are. As of the week ending July 8, the price of West Texas intermediate was $103 per barrel. With gas and diesel prices where they were then, the crack spread was $1.02 per gallon – far above the $0.36 per gallon it had averaged between 2014 and 2021. But at a higher price for crude oil, the crack spread would fall. At $131 per barrel (and with gas and diesel prices where they were as of the week ending July 8), the crack spread would be back at $0.36 per gallon. And at $146 per barrel, the crack spread would be zero. Presumably, if crude prices approached such a level refiners would cut back on production, leading to higher gas and diesel prices. Crude oil prices would then be the binding factor, and efforts to lower those prices (e.g. by sales out of the Strategic Petroleum Reserve, or more OPEC production) could then matter.
The point of this blog post is that that is not where we are now. Current conditions call for a different policy response.
=========================================================
Annex: Supply and Demand Curves to Show the Impacts of the Options
For those of you familiar with simple supply and demand curves, it is easy to see the impacts of the policy options discussed verbally in the text above.
The supply curve of fuels from refineries slopes upward from a curve that is relatively shallow to something increasingly steep and ultimately to vertical. At relatively low levels of production, where there is a good deal of excess capacity in the refineries, a small rise in prices for the fuels will elicit a strong supply response. But as production approaches the maximum capacity of what the refineries can produce (in the near term, given existing plant), there can only be little and ultimately no more production no matter how high the price goes.
The demand curve is steep. That is, if prices rise by some amount, the quantity of fuels demanded does not fall by all that much. The price elasticity of demand is low.
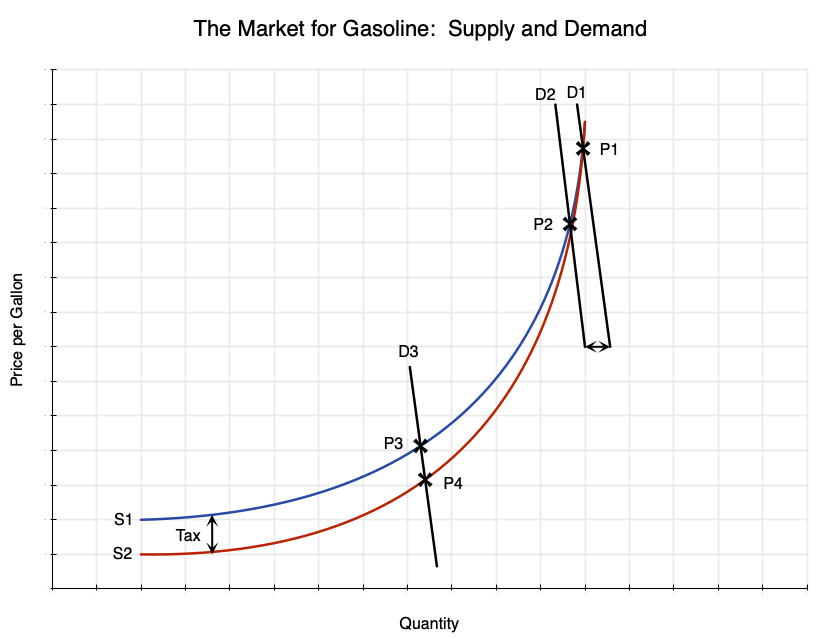
Retail taxes per gallon of fuel add to the supply cost. That is, in the figure above, the red curve (marked S2) is what the supplies would be at some lower (possibly zero) retail fuel tax per gallon sold, while the blue curve (marked S1) is what the supply would be at some higher tax rate. The supply curve will shift upwards. That is, for any given quantity of supply, a higher price will be needed for that amount to be supplied.
When the supply curve is relatively shallow and upward sloping, as in the lower left of the diagram, then a cut in the tax (from the blue curve to the red), with a demand curve such as D3, will lead to some increase in supply and a significantly lower price. The price, in the diagram, would fall from P3 to P4. This is the logic behind the proposals, such as have been made by President Biden, for a temporary cut in federal fuel taxes.
However, this is not where current market conditions are. Rather, refineries are operating at close to their maximum capacity, and one is in an area where the supply curve is close to vertical. When the supply curve is vertical, a reduction in fuel taxes will simply shift that vertical curve downwards, but with one vertical curve simply sitting on top of the other vertical curve. While a reduction in the tax per gallon will increase how much the refiner receives, after taxes, it will not lead to a higher amount being supplied (refiners cannot produce any more) nor will it lead to a lower price for consumers. The lower taxes will simply be reflected in higher profits for the refiners.
In terms of the supply and demand curves depicted above, one would be in an area such as that depicted with the demand curve D1 with a price of P1. If the supply curve is shifted downwards due to the tax cut (from the blue curve S1 to the red curve S2), with nothing done to affect the demand curve, then the price remains at P1.
In contrast, if the market conditions are such that the demand curve is at D1 and the supply curve is close to vertical, yielding a price of P1, a relatively modest shift in the demand curve to the left, i.e. from D1 to D2, leads to a sizeable fall in the price – from P1 to P2. The fall in the price is large because both the demand curve and the supply curve are steep, and indeed close to vertical for the supply curve. In such conditions, modest changes in demand can have a big impact on the price.
A shift of the demand curve shows how much demand would change (at the given price) due to a change in some underlying factor other than price. Inducing drivers to shift to public transit by ending the charging of fares on transit systems is one such example. There are others, such as encouraging more work from home (so no commute at all is needed). And should the economy fall into a recession (which I see as increasingly likely in 2023), there will also be a reduction in fuel demands. But the latter is not a cause of lower prices that one should hope for.

You must be logged in to post a comment.