


As was noted in the preceding post on this blog, austerity programs implemented in most of the major European economies in 2010/2011 have led to a double-dip recession in Europe, as the incipient recovery of 2009/2010 was killed. Germany would appear to be an exception to this, as the German economy (like that of the US) continued to grow in 2011 and 2012. The top graph above (repeated here from the preceding blog post) shows the growth since the end of 2007 for Germany, the US, and for the Eurozone area as a whole, as well as for France, the Netherlands, and the UK.
Germany, led by Angela Merkel of the conservative Christian Democrats since 2005, has been especially adamant in insisting on the austerity programs. She pushed for such programs in much of the continent, and in particular as a condition of financial loan support from Germany in the cases of Spain, Italy, Greece, and others. She was also the principal proponent of the “fiscal compact” under which EU member governments would be required to maintain balanced budgets.
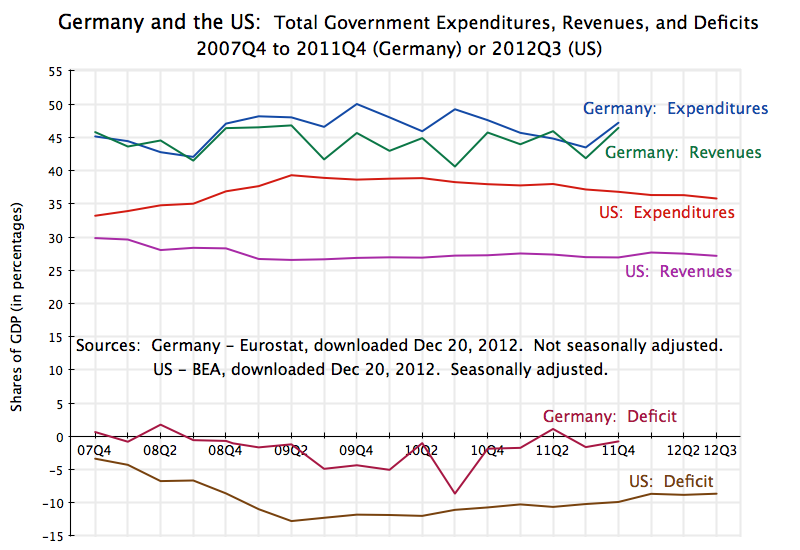
Given all this, one would have expected that Germany itself would have followed a strict austerity program. However, it in fact allowed government expenditures to rise relatively sharply (see the second graph above), and by a good deal more than in the US. What is different in Germany is that it also kept up its government revenues, rather than seek to stimulate the economy through tax cuts. This is seen in the third graph. The result is that while German fiscal deficits grew, to almost 5% of GDP in 2010, they remained well below the deficits seen in the US and elsewhere. The deficit was then reduced in 2011 as revenues rose and expenditure growth was moderated, but with a resulting slow-down in German growth in 2011 and 2012 (see the top graph).
In contrast to Germany, the US had government consumption and investment expenditures level off in 2010 and then fall in 2011 (second graph). Total government expenditures (including transfer payments, such as for Social Security and Medicare) were reduced after peaking in the second quarter of 2009 (third graph). But the US also cut back sharply on taxes (as discussed in this blog post). The result was an increase in the overall government deficit to over 12% of GDP (for all levels of government). This has now come down to about 8 1/2% of GDP, but remains high.
Germany is often cited as an example by conservatives in the US and elsewhere of prudent fiscal policy in response to the crisis. The German fiscal deficit is indeed relatively modest. But the German deficit is modest not because government expenditures are low, but because Germany has kept government revenues high. Indeed, German government expenditures are a good deal higher than they are in the US as a share of GDP (21% higher in 2011). But German government revenues are also far higher than they are in the US (64% higher in 2011, as a share of GDP). The prudence comes not from low government expenditures, but from ensuring government revenues are kept high to pay for such expenditures.
Senator Mitch McConnell, the Republican Leader in the Senate, has said repeatedly in recent years: “We’re not in this mess because Washington taxes too little; we’re in this mess because Washington spends too much.” The example of conservative and fiscally prudent Germany points to the opposite: We are in trouble not because Washington spends too much, but because it taxes too little.
————————————————
Notes on Data
The data for Germany comes from the European statistical agency Eurostat. It is an excellent source of consistent data for all members of the European Union. However, national accounts and fiscal data for Europe are gathered differently in the US, which sometimes makes it difficult to arrive at directly comparable data. In particular:
- Quarterly data on government total expenditures and revenues are not available on a seasonally adjusted basis. Furthermore, the most recent quarterly data reported is only for the period through the fourth quarter of 2011.
- While seasonally adjusted quarterly data (in real, inflation-adjusted, terms) are available in the national income (GDP) accounts for government consumption, the national income accounts in Europe do not show government investment separately. Rather, government investment is combined with private investment in the European accounts. In the US, the national income accounts record government consumption and government investment together.
- Real government investment is available separately on an annual basis for the European economies, which is why the second graph above shows these numbers on an annual rather than quarterly basis.
- Total government expenditure (for not just consumption and investment, but also including transfer payments such as for old-age pensions, medical care, unemployment insurance, etc.) is available on a quarterly basis, but only in nominal terms (i.e. not inflation adjusted) and not on a seasonally adjusted basis. The German data in the third graph was therefore shown as a share of GDP, and the lack of seasonal adjustment accounts for the quarterly fluctuation seen. When figures are quoted in the text (such as for 2011 government expenditures and revenues) the four quarter average was used.
- The US data comes from the Bureau of Economic Analysis (BEA) of the US Department of Commerce.
Finally, note that “government” as defined here includes all levels of government: federal, state, and local.

You must be logged in to post a comment.