

A. Introduction
Republicans continue to assert that government spending has exploded under Obama. It is a myth. Depending on which specific measure of government spending is used, such expenditures have either fallen during Obama’s presidency or have increased at one of the lowest rates in the last six decades.
This myth is unfortunately important as conservative politicians continue to use it aggressively to push for drastic cuts in government spending, despite the damage such cuts have done to the economic recovery. And drastic government spending cuts loom with the rapidly approaching deadline of March 1 when the automatic across-the-board sequester budget cuts will enter into force, unless Congress pulls back from the brink before then with new legislation. Yet as of this writing, Congress is on vacation, and there is little sign that any agreement will be reached by March 1. An already weak economy (GDP fell by 0.1% in the fourth quarter of 2012 largely due to government spending cuts in that quarter), will almost certainly be driven into decline if the sequester spending cuts happen.
Yet Republican leaders continue to assert big increases in government spending during Obama’s presidential term are the source of the economy’s problems. A recent example was in the formal Republican response (by Senator Rubio of Florida) to Obama’s State of the Union address. Rubio asserts that the rise in government under Obama is the cause of our weak economy, and that our problems would be solved by cutting government spending. But government spending has not risen as he asserts.
B. Government Consumption and Investment Expenditures
Government consumption and investment expenditures have in fact fallen during Obama’s presidential term. It is the first such fall in 40 years. And such government spending rose fastest in this period during the presidential terms of Reagan and George W. Bush.
The graph above shows the growth rates for government spending on consumption and investment as recorded in the National Income and Product Accounts (often referred to as the GDP accounts) published by the Bureau of Economic Analysis of the Department of Commerce. Such government spending accounts for one component of GDP (along with private consumption, private investment, and exports less imports). It encompasses all direct spending by government on goods and services, and does not include government transfer payments (which will be considered below). We now have such data for the full four calendar years of Obama’s presidential term, and can compare the record during Obama’s term to that during previous presidential terms.
Earlier posts on this blog have noted that such fiscal spending has in fact been falling for much of Obama’s term, and that this has acted as a drag on the recovery (see here, here, here, and here). The now complete data for the full four years of Obama’s first presidential term shows that such government spending fell sharply in both 2011 and 2012, and that while there was growth in 2009 with the stimulus package, the average rate of growth over the full four years of Obama’s term has been negative. Such government spending is now less than when he took office.
This government spending (all figures in real, inflation adjusted, terms) fell at an average annual rate of 0.2% during Obama’s term. This fall can be contrasted with the substantial increases during George W. Bush’s two terms, and the even larger increases during Reagan two terms. (See the graph above, and the table at the bottom of this post provides the specific numbers.) The only comparable performance to Obama in recent decades was the growth of close to zero during Clinton’s first term. One would have to go back 40 years, to Nixon’s 1969-72 presidential term, before one again sees a fall in government spending as one had under Obama. There was also a fall during Eisenhower’s first term, as spending fell sharply in 1954 and 1955 following the end of the Korean War in 1953.
It should be noted that there is certainly no reason to aim for zero growth of government spending over the long term. Over the sixty years from 1952 to 2012, real GDP grew at a 3.0% annual rate, so real government spending could also grow at a 3.0% annual rate and leave the spending we do as a society for public goods such as infrastructure, education, defense, and so on, at a constant share of GDP. And it is interesting to note that despite the Republican complaints on government spending, the only periods when government spending grew at a 3% rate or faster over the last 60 years were during the first George W. Bush term, the second Reagan term, the Kennedy/Johnson and Johnson terms, and almost the second Eisenhower term (growth then at a 2.8% annual rate).
The average rate of growth of government spending for goods and services over the full 60 year period was indeed only 1.9% a year in real terms, and hence such government spending as a share of GDP has fallen. This is the fundamental reason our infrastructure is falling apart and our public services are so poor compared to that found elsewhere among the richer countries of the world.
C. Total Government Spending, including Transfers
One can reasonably argue that a better measure of government spending is not simply that which enters directly into the GDP accounts (expenditures by government directly on goods and services), but which includes also expenditures by government on transfer payments. Transfer payments are made by government to others, without goods or services provided in return. They are mostly to households (such as for Social Security, Medicare and Medicaid, unemployment insurance, and similarly), but include also subsidies to corporate and business entities (such as for agricultural subsidies, energy subsidies, and similarly) as well as interest payments on public debt. There are also significant transfer payments between levels of government (e.g. federal to state, federal to local, and state to local), but these are netted out for spending at all government levels (but federal transfers will be included when federal spending alone is discussed below).
By this measure as well, the rate of growth of government spending during the Obama term has been one of the lowest in decades:
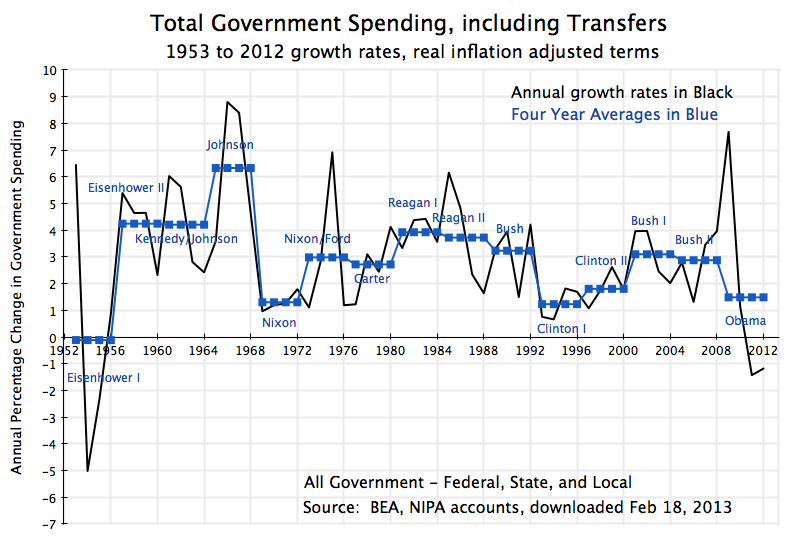 The rate of growth of such government spending during Obama’s first term was just 1.5% a year, with absolute falls in 2011 and 2012. This is well below the growth during the two terms of George W. Bush, the term of George H. W. Bush, and the two terms of Reagan. And it is noteworthy that this slow overall growth in total government expenditures during Obama’s term was achieved despite the collapsing economy and resulting high unemployment that Obama inherited on taking office. The collapsing economy Obama confronted automatically drove up expenditures on unemployment insurance, food stamps, and other safety net programs, all of which count as government transfer programs. Hence (and along with spending from the stimulus package) there was a sharp peak in 2009, with this increase critical to stopping and then reversing the economic collapse. But this was then followed by a sharp fall in government spending soon thereafter, which slowed the recovery.
The only comparable periods of such slow growth in total government spending in the last 60 years were during the two Clinton terms and the Nixon term, while such spending was flat during the first Eisenhower term, when Korean War spending ended.
D. Federal Government Spending Only
The analysis so far has covered expenditures at all levels of government – federal, state, and local. It is such expenditures which matter in terms of impact on the economy. And consolidation makes sense as transfers from the federal level cover a substantial share of expenditures that are then carried out by state and local governments. However, if one wants to focus more narrowly on government expenditures where the role of the president is more direct, then a case can be made to focus exclusively on expenditures at the federal level. The president is still not omnipotent, as expenditures will depend on budgets passed by the Congress as well as on laws that established programs many years before (such as Social Security or Medicare) . But the influence of the president will be more direct when focused on federal only expenditures.
Here again, growth in government expenditures during Obama’s term in office has been one of the lower ones of recent decades, and in particular well below the growth seen under Bush or Reagan. First, for government direct spending on goods and services:
 Such expenditures grew at an annual rate of 1.3% over Obama’s term, with out right reductions in 2011 and 2012. In contrast, such expenditures grew at rates of 5.5% in George W. Bush’s first term and 2.9% in his second, and at rates of 4.6% in Reagan’s first term and 3.8% in his second. Yet Republicans assert that Obama must be blamed for a rapid expansion in government spending over his term, while Reagan and Bush are praised for their promises to cut government.
In sharp contrast to the increases under Reagan and George W. Bush, federal government expenditures on consumption and investment were cut sharply during Clinton’s first term (at a rate of -2.9% a year), and were basically flat during Clinton’s second term. There is no basis for the attack that such spending increases at explosive rates under Democrats.
One can similarly look at federal government total spending, including transfers (to households and businesses, and also here transfers from the federal level to the state or local levels):

Here again, the growth under Obama has been moderate, with growth at a rate of just 2.7% a year, despite the consequences for mandated expenditures in programs such as unemployment insurance and food stamps that resulted from the economic collapse that Obama inherited. And despite the weak economy (and indeed contributing importantly to that weakness), federal government total expenditures fell in 2011 and 2012.
Furthermore, growth in such expenditures were higher during the the two terms of George W. Bush, during the term of George H. W. Bush, and during the two terms of Reagan. They were significantly slower during the two Clinton terms. Here again, there is no basis for the assertion made by Republicans that Democrats are responsible for sharp growth in government spending, while the Republican presidents have kept it low.
E. Conclusion
It is important to know the facts when making statements asserting that government spending has exploded under Obama, with this then asserted as the cause of the slow recovery. In fact, the opposite is true, with government spending either falling during the term of Obama’s presidency or rising at a slower rate than seen in recent Republican presidential terms. This has then diminished demand for goods and services, and hence has slowed a recovery where the problem is lack of demand to make use of currently underemployed resources (with high unemployment as well as low capital utilization rates).
What has been high in recent years is not government spending, but rather the fiscal deficits. But these have been high due both to the 2008 economic collapse and slow recovery (which diminished tax revenues and raised certain government expenditures, such as for unemployment insurance), but more importantly to lower tax rates stemming from a series of tax cuts enacted over the last decade (starting with the Bush tax cuts of 2001 and 2003) and continuing into the Obama term. The size and impact of these tax cuts were discussed in a previous posting on this blog. These tax cuts reduced government revenues and, along with the impact of the downturn, account for most of the resulting fiscal deficit. The problem is not high government spending, as government spending has either not grown or has grown only slowly. The problem, rather, is low government revenue.
=====================================================
Table of Data, and Technical Notes
The specific numbers on four-year growth rates by presidential terms going back to Reagan are presented in the following table:
| real average annual growth rates | Obama | Bush II | Bush I | Clinton II | Clinton I | Bush | Reagan II | Reagan I |
| 2009-12 | 2005-08 | 2001-04 | 1997-00 | 1993-96 | 1989-92 | 1985-88 | 1981-85 | |
| A) All Levels of Govt | ||||||||
| 1) Direct Spending | -0.2% | 1.4% | 3.0% | 2.4% | 0.2% | 1.9% | 4.2% | 2.4% |
| 2) Total Spending | 1.5% | 2.9% | 3.1% | 1.8% | 1.2% | 3.2% | 3.7% | 3.9% |
| B) Federal Govt only | ||||||||
| 1) Direct Spending | 1.3% | 2.9% | 5.5% | 0.1% | -2.9% | 0.4% | 3.8% | 4.6% |
| 2) Total Spending | 2.7% | 4.0% | 4.0% | 0.9% | 0.8% | 3.0% | 3.0% | 4.5% |
Direct spending is all government spending directly on the purchases of goods and services. Such spending is for either government consumption or for government investment, and is the government spending presented in the standard GDP accounts. Government investment is in gross investment terms (i.e. estimated depreciation is not subtracted). The price deflator used is as estimated by the BEA in the GDP accounts.
Total spending is direct spending by government on goods or services plus transfer payments. Inter-governmental transfers (e.g. from the federal to the state level, state to local, or federal to local) are netted out in the figures for spending at all government levels together, but federal transfers to state or local governments are counted when federal only spending is calculated. Transfer payments are mostly to households (such as for Social Security, Medicare, unemployment compensation, food stamps, and so on), but also include transfers to businesses (such as for agricultural subsidies and energy subsidies) and interest payments on public debt. Since most are to households, these transfer payments were deflated using the personal consumption deflator estimated by the BEA in the GDP accounts.

You must be logged in to post a comment.