

I would like to acknowledge and thank Mr. Steve Hipple, Economist at the Bureau of Labor Statistics, for his generous assistance in assembling data on labor force participation rates used in the blog post below. This post would not have been possible without his help.
A. Introduction
Increasing attention has recently been directed to the decline in labor force participation rates observed for men over the last several decades, and for women since the late 1990s. The chart above tracks this. It has indeed been dubbed (for men) a “quiet catastrophe” in a new book by Nicholas Eberstadt titled “Men Without Work”.
The issue has been taken up by those both on the right and on the left. Even President Obama, in one of the rare “By invitation” pieces that The Economist occasionally publishes, has highlighted the concern in an article under his name in last week’s issue (the issue of October 8). President Obama treats it as one of “four crucial areas of unfinished business” his successor will need to address. A chart similar to that above is shown. President Obama notes that in 1953, just 3% of men between the ages of 25 and 54 were not working, while the figure today is 12% (that is, the labor force participation rate fell from 97% to 88%). The share of women of the same age group not participating in the formal labor market has similarly been falling since 1999.
While Obama is careful in his wording not to say directly that all of this increase in those not working was due to “involuntary joblessness”, he does note that involuntary joblessness takes a devastating toll on those unable to find jobs. This is certainly correct. The fundamental question, however, is to what degree do we know whether the rise has been involuntary, and to what degree has it risen due to possibly more benign factors with rational choices being made.
Nick Eberstadt, who is perhaps the person most responsible for raising the profile of this issue, is a senior researcher at the conservative American Enterprise Institute. He sees it as a major problem. And a recent piece by the conservative columnist George Will, which is essentially a review of Eberstadt’s new work, appeared in the journal of conservative opinion the National Review, where it was subtitled “American men who choose not to work are choosing lives of quiet self-emasculation”.
On the left, Larry Summers praised Eberstadt’s book in a review published in the Financial Times (see this blog post of his for a non-paywalled summary), as did Justin Fox in this post at Bloomberg View. But both emphasize factors beyond the worker’s control, in particular that “good” jobs are disappearing because of technological change (as well as, perhaps, international trade), and that America’s high prison incarceration rates have made it impossible for many men to be hired for the jobs there are.
Alan Kreuger, a Professor of Economics at Princeton and a former chair of President Obama’s Council of Economic Advisers, suggests a different factor in a recent carefully done academic analysis. (See also this piece by Peter Coy for a non-technical summary of Krueger’s work.) He found that poor health may well explain the high level for men, and found from independent data that nearly half of prime age men not in the labor force are taking pain medication daily. As with the others, Krueger stresses that the issue is an important one. He concludes his paper by noting that “The decline in labor force participation in the US over the past two decades is a macroeconomic and social concern”, and that addressing it for “prime age men should be a national priority”.
While both sides have praised Eberstadt’s work, it is probably not surprising that they stress different underlying causes. Those on the right blame individuals for becoming increasingly unwilling to work, abetted by foolish government policies that have enabled them to stay at home rather than get a job. Those on the left emphasize instead that “good” jobs are disappearing because of technological change (as well as, perhaps, international trade), and that America’s high prison incarceration rates have made it impossible for many men to find jobs. Professor Krueger’s conclusions are somewhere in between: Individual factors (health) may explain what is being seen, but the health issues may be getting worse due to factors beyond the individual’s control.
It is not clear to me that any of these explanations really suffice. But to develop an understanding of what might be going on, it is important first to examine more closely the underlying data for those who are not in the labor force and the reasons they give for this.
A first step is to separate the male and female rates, such as in the chart above. It is an update of a chart that appeared in a post on this blog from last March (which in turn updated a similar chart from an even earlier post, from August 2014). It tracks the monthly rates since 1948, with male and female rates shown separately as well as for everyone together. Since demographic factors will affect labor force participation rates, particularly as a consequence of the increasing share of the baby boom generation who are now moving into their normal retirement years, the chart controls for age distribution by including only those aged between 25 and 54, the prime working years.
As the chart shows, the overall labor force participation rate (for men and women together) has been falling since the late 1990s. The overall rate rose prior to then, but solely because the female rate was then rising strongly, as women increasingly entered into the formal, paid, job market. This peaked for women in the late 1990s, after which their rate as well as the overall rate began a slow fall.
The male rate, in contrast, started from a high level, of around 97% in the mid-1950s, after which there has been a slow but more or less steady fall. It is now around 88%. Interestingly, since 1999 the female rate has moved almost exactly parallel to the male rate (at 83 to 84% of it, as discussed in the earlier blog post), suggesting that the underlying causes of the declines in both since 1999 might be similar.
A critical question is why. The breakdown into separate male and female rates is a first step, but only a first step. One wants to go beyond this. The purpose of this blog post will be to take that next step, using BLS data I recently became aware of which reports on the survey responses of individuals on the primary reasons they are not in the labor force. This post will first review those results, and will then discuss some of the reasons that might explain the declining rates, especially for men.
B. Non-Participation in the Labor Force by Prime-Aged Males
We will look at the rates for males first. The chart below provides the reasons given (as a share of the male population aged 25 to 54) for why they were not participating in the labor force over the years from 1991 to 2015:
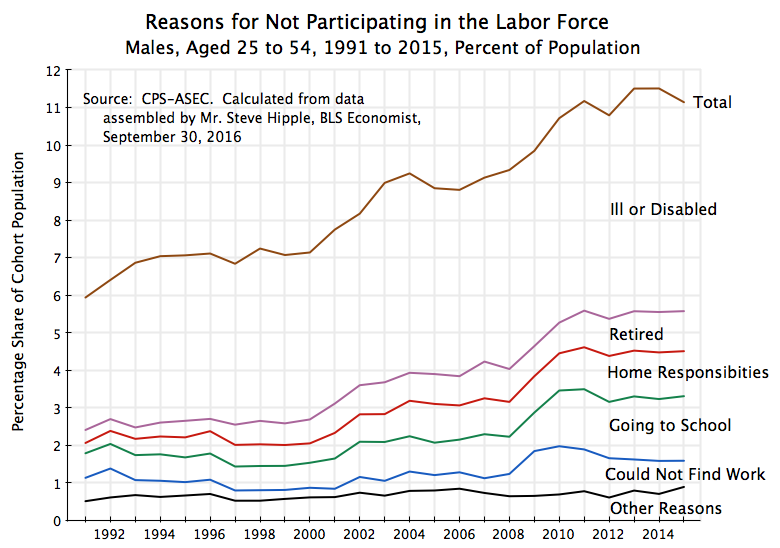 The data was assembled by Mr. Steve Hipple, an economist on the staff of the Bureau of Labor Statistics (BLS) of the US Department of Labor. He authored a Beyond the Numbers article of the BLS in December 2015 titled “People who are not in the labor force: Why aren’t they working?”, which provided a first look at the reasons given by respondents for why they are not participating in the labor force, focusing on data for 2004 and for 2014. The chart above is based on data assembled by Mr. Hipple for the full period from 1991 to 2015.
The data is derived from responses to queries made in the Annual Social and Economic Supplement to the Current Population Survey (CPS-ASEC). This is a joint effort by the BLS (which conducts the Current Population Survey monthly, from which the official unemployment rate, among many other measures, is derived) and the US Census Bureau. The CPS-ASEC survey is undertaken once a year, each Spring, and asks a larger national sample a broad range of questions focused on conditions (such as on employment and household incomes) in the previous calendar year. Among the questions it asks is whether each adult member of the household was in the labor force (where the labor force is defined as all those employed and all those unemployed who were actively seeking employment at some point in the year), and if not, what the reason was. The possible responses are those listed in the chart above.
Several points should be noted:
a) The numbers ultimately come from a survey of individuals, and hence will have the shortcomings of any survey. There will be statistical error simply from the size of the sample, but more importantly also non-statistical error from how people choose to respond. The reasons why an individual may not be participating in the labor force may be interpreted differently by different individuals, and multiple factors may apply (for example, they may be somewhat ill, have had difficulty in finding a job, and are at an age where early retirement is possible). While such inherent limitations should be recognized, they also may not so much affect the trends, and the trends are of most interest here.
b) The CPS-ASEC survey asks the respondents on their status in the previous calendar year, and covers the status over the entire year. Hence if they were employed for part of the year but not for the full year, they would still be counted as part of the labor force. The CPS survey, in contrast, is monthly, and asks for the status at that point in time (or, to be more precise, in the preceding week). For this reason, one should expect to find that the share of the population counted as in the labor force to be higher in the annual figures than in the monthly figures, since they will be included in the annual numbers if they were in the labor force at any point in the previous year and not simply at the point in time of the monthly survey. And one does see this in the results reported. Conversely, the share not in the labor force will then be lower in the annual figures than in the monthly estimates.
The annual and monthly figures will, however, move similarly. But note that the chart at the top of this post is based on the monthly estimates from the CPS, while the charts here for the reasons for not participating in the labor force are drawn from the annual CPS-ASEC estimates. The totals for those not in the labor force will differ for this reason.
c) Participation in the labor force is defined as anyone in a paid job for as little as one hour in a week, plus those unemployed (defined as those actively looking for a job but do not have one). Thus to be counted as not in the labor force but “retired” or “going to school” is quite strict. If one is retired but working for pay a few hours a week, or in school but working in the school cafeteria for some extra income, one is counted as part of the labor force and hence will be excluded from those not in the labor force.
d) One must similarly be careful in the interpretation of the “could not find work” category. The CPS-ASEC questionnaire asks whether the respondent had spent “any time trying to find a job” in the previous year. If they had, they would be included in the unemployed. If not, they would then be asked why they were not in the labor force that year, from this list of possible reasons. Those who responded that they “could not find work” would be saying that they could not find work during this period even though they also say they had not actively searched for a job in this period. It is possible, however, that they had looked before, could not find anything suitable, and believed this still to be the case even though they had given up actively looking.
e) Only data going back to 1991 could be readily assembled. While this covers a significant period, 25 years, it would be interesting if results further back were available. The downward trend in the male participation rate started in the mid-1950s, and it would be of interest to see whether the causes prior to 1991 were similar to those since then. I suspect they probably were, but this is speculation and one would like to see if that is indeed true.
The CPS-ASEC goes back to 1959 I believe (although initially under a different name), the monthly CPS goes back further, and a CPS questionnaire I found from 1978 asks a similar question (although without “retired” as a separate category). The older data is not easy to access, however, and requires special software as well as expertise that I do not have.
However, the 25 years of data from 1991 to 2015 do show some interesting trends. Specifically, for the male rates (the chart above):
a) The share of males aged 25 to 54 not in the labor force almost doubled over this period, from 5.9% of the male population in this age group in 1991 to 11.5% in 2013 and 2014 before dipping to 11.1% in 2015. This was a significant increase. And as the chart at the top of this post shows, this was a continuation of a similar trend in the decades prior to 1991.
b) The increase in the total was not due to just one or two causes, but rather to substantial increases in the shares for each of the given reasons other than, interestingly, “could not find work”. About 0.6% of the prime working age male population responded “could not find work” in 1991, and 0.7% did in 2015. But the share reporting “could not find work” did fluctuate over the period, bumping higher in those years when the labor market was weak and unemployment high (1992, 2002, and then especially in 2009/10), and being compressed in the mid to late 1990s (the Clinton years) when labor market conditions were strong. It appears to be capturing that labor market participation rates of prime age males are less when labor markets are weak. This would be hidden unemployment. However, the extent is limited. The difference between the peak rate (in 2010) and the low rates in the late 1990s is only about 1.0% point.
c) In terms of shares among those prime age males not participating in the labor force, the most important reason given was “ill or disabled”. Interestingly, this share fell from close to 60% of those not in the labor force in 1991, the first year for which we have data, to 50% in 2015. There were larger relative increases in the other causes (other than “could not find work”).
d) The shares that rose the most (in relative terms) were the share of prime age men going full-time to school (rising from 11.0% of those prime age males not in the labor force in 1991 to 15.5% in 2015), the share retired (rising from 5.9% to 9.6%), and the share taking on home responsibilities (rising from 4.6% to 10.8%). The share of those who could not find work fell from 10.5% to 6.3%, and the share for “other reasons” fell from 8.5% to 7.9%.
We will discuss below some of the possible reasons for these changes.
C. Non-Participation in the Labor Force by Prime-Aged Females
A similar chart can be drawn for the responses of women not in the formal, paid, labor force. The huge post-World War II change was of course the entry of women into the paid labor force, almost doubling from 34% of prime working age women in 1948 to 77% in 1999. The rate then slowly fell, in parallel with the male rate, to 74% in 2015.
What dominates in the share of women not in the paid labor force is the share with home responsibilities. This came down sharply from 1991 to 1999, as the following chart shows, and almost certainly in the period before then as well. Since 1999 it has fluctuated, but appears to be on an upward trend (as the male rate is as well, although starting from far lower levels):
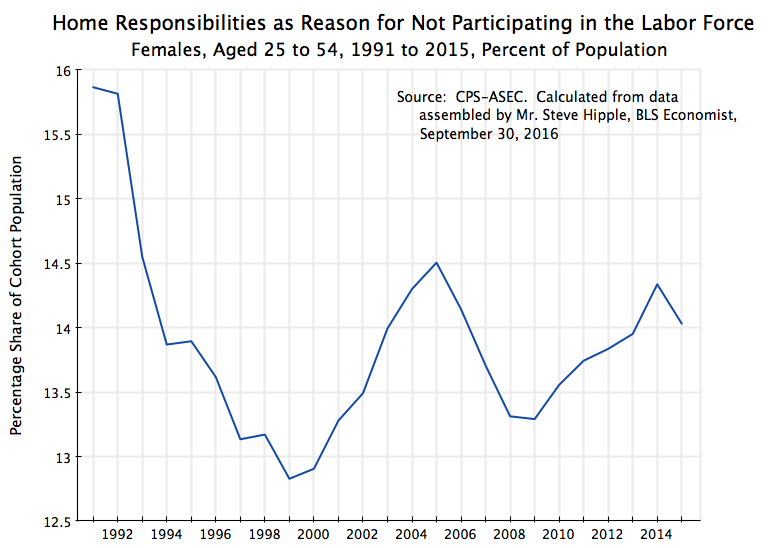
Interestingly, over the past two decades the rate fell when the labor market was strong in the mid to late 1990s, rose as the labor market weakened with the recession that began a few months after George W. Bush took office, fell once the labor market recovered (but with a lag), and then turned upward again after 2009 as the labor market weakened again. It then fell in 2015. This pro-cyclicality may be implying that, for women, the “home responsibilities” reason is being given as the stated reason for not participating in the formal labor force, when in fact it may to some degree reflect hidden unemployment. But we cannot know for sure. It might also reflect what kind of jobs, and their wages, that women can get when labor market conditions are weak. The impact of wage rates will be discussed below.
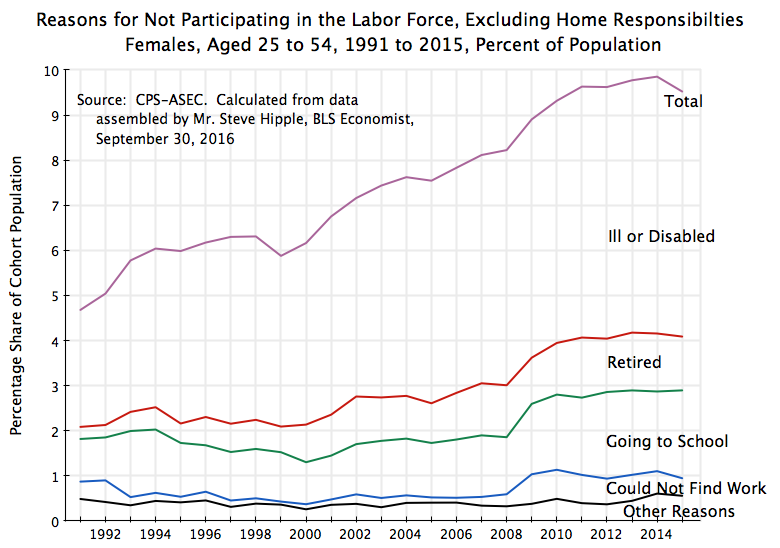
The share for “home responsibilities” remains high, however, and would dominate all else in a chart if left in. To examine what is going on it is therefore best to first subtract out the home responsibilities cause, accounting for it separately, and then examining the break-down for all the other reasons given for not participating in the labor force. The result then is a chart which is remarkably similar to the chart for males:
One finds:
a) The total rate for women not in the labor force, once one excludes those with home responsibilities, almost doubles between 1991 and 2015, as it did for the males.
b) Once again, the largest share of women of ages 25 to 54 not in the labor force (and excluding also those with home responsibilities) are those recorded as ill or disabled. But the share ill or disabled was largely flat between 1991 and 2015, accounting for 55% of the total in 1991 and 57% in 2015.
c) The second highest share, as with the male rates, was the share going full time to school. But it was largely flat for this group of women, at 20.2% of the total in 1991 and 20.5% in 2015.
d) Women, similar to men, saw a relatively high increase in the share retired, rising from 5.7% in 1991 to 12.5% in 2015. Also similar to men, the share recorded as could not find work fell sharply from 8.2% in 1991 to 4.1% in 2015. And the “other reasons” share also fell, as it did for the males, from 10.4% to 5.9%.
There appears then to be a similar pattern in the female rates as in the male rates once one removes the effect of home responsibilities. Furthermore, this similar pattern held prior to 1999 as it did after that; there was not a sharp break in that year. Indeed, excluding full time home responsibilities for both men and women, one finds that the curves of the shares in the 25 to 54 age group not in the labor force basically lie on top of each other:
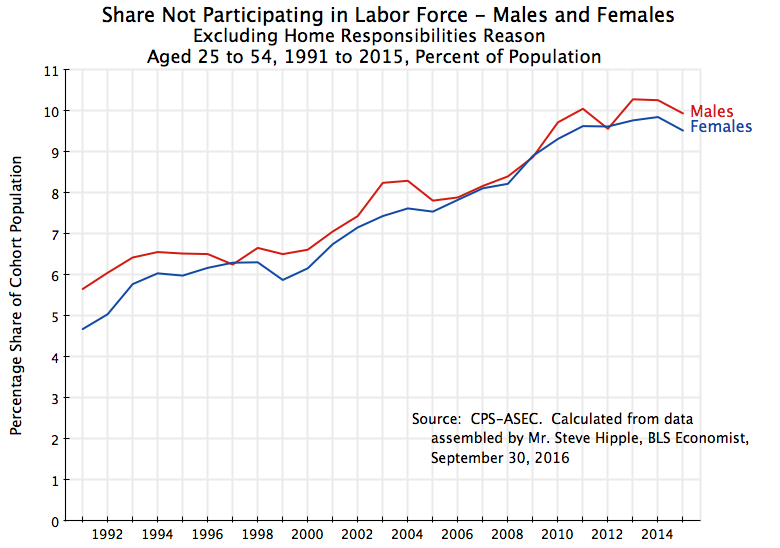
For both men and women, the share not participating in the labor force (and excluding those with full time home responsibilities as well), both rose sharply over this period, basically doubling, with similar shares throughout (within a percentage point or less).
Finally, it is interesting to compare between men and women the stated underlying reasons for not participating in the labor force. The chart above shows that the totals, once when excludes the big differences between men and women with home responsibilities, are similar, and has been over time (since at least 1991). The chart below compares the male and female rates for the underlying reasons, for the year 2015:

The totals, excluding home responsibilities, are similar, as already seen. But it is interesting that the male and female rates for the underlying causes, other than home responsibilities, are also mostly similar. The shares of prime age men and women who are not in the labor force due to illness or disability are quite close, at 5.6% for men and 5.4% for women. A conclusion that illness or disability is more of a problem for men than for women is not supported. Also very similar are the rates in this age group who report being retired: 1.1% of men and 1.2% of women. This is also the case for those reporting to be full time students, with rates of 1.7% for men and 1.9% for women. The female rate reporting they could not find work is less than the male rate (0.7% for males and 0.4% for females), as is the rate reported under “other” (0.9% for males and 0.6% for females), but both of these are relatively small in absolute level.
It appears that similar factors for men and women (other than home responsibilities) might be underlying these rates, and their increase over time. What might those be?
D. Possible Reasons for These Changes in Shares Not in the Labor Force
It was noted in the introduction that conservatives have interpreted the decline in the labor force participation rates, particularly of men, as reflecting an increasing unwillingness to work. Liberals have focussed more on fewer “good jobs” or an inability to get and hold them due to conditions like previous incarceration or deteriorating health. Can we conclude from the data reviewed above which, if any, of these interpretations might be correct?
To summarize some of the points already noted above:
a) There appear to be multiple reasons given in the responses for each sex as to why they are not participating in the labor force. That is, it is not just one factor that explains, at least directly, the increasing share not working.
b) Furthermore, aside from changes in the shares taking on home responsibilities (which do differ, and differ greatly, between each sex), the multiple reasons appear to be broadly similar in the share of males and share of females not participating in the labor force.
c) But one stated reason that is low in level and also has not grown over time is the share of the prime working age population who are not in the labor force because they say they could not find work. The share was just 0.7% of all men of prime working age in 2015, and just 0.4% for all women of prime working age.
d) The share saying they could not find work varies to a limited degree with the overall state of the labor market (somewhat higher when official unemployment is high, although not by a huge amount). And while it was relatively high (in comparison to its level at other times) in 2009/2010, when official unemployment reached 10%, it is now back to levels seen previously.
e) The “other reasons” factor is relatively low and without an obvious upward trend. This is fortunate, since we do not really know what lies behind it. But being low, it does not appear to be important.
Can the increase be attributed then to an increased unwillingness to work, as the conservatives charge? That is not so clear. While this is now more speculative, one can also interpret the data as reflecting more positive developments. Specifically:
a) There was a substantial increase in the share of men and women aged 25 to 54 who were enrolled full time in school. This is almost certainly a good thing. This probably reflects an increasing share of students in their late 20s and perhaps later enrolled in post-graduate studies. Medicine requires many years of study, for example, and business schools increasingly require students applying to their MBA programs to have worked for several years before being accepted. One might similarly see students in post-graduate academic programs, in particular Ph.D. students, who are 25 or older. Finally, there may now be an increasing number of students who have worked for 5 or 10 years or more who decide to go back to school to learn a new skill or profession. This is not bad. Finally, it is worth noting that the increasing shares of students in this 25 to 54 age group are similar for both men and women, suggesting that the underlying cause may well be due to developments in the system of education.
b) One also sees increases, and similar increases for both men and women, in the share saying they are retired despite being age 54 or less. Such early retirement is certainly unusual, but the shares are low (1.1% of the men in the full 25 to 54 age group in 2015, and 1.2% of the women). But given how the retirement system has changed in recent decades, an increase over time should not be surprising. Traditional defined benefit pension systems typically required work to some age (perhaps 62 or 65) before they could be drawn. With income in retirement now driven by individual accounts (401(k)s, IRAs, and even just normal savings), there is now more of an opportunity to retire earlier. To the extent early retirement reflects what a person prefers, and is something that he or she can afford, this should be seen as a positive development.
c) Home responsibilities have been the largest single reason for women not being part of the formal, paid, labor force, and came down sharply until 1999. Since then it has risen, but with significant volatility. As noted above, it may well reflect a degree of hidden unemployment, as it appears to rise and fall (although with a lag) with labor market conditions. But if it is a personal preference, and something the family can afford, it is not necessarily a bad thing.
d) The share of males reporting home responsibilities as the reason they are not participating in the formal labor force, while still well below the female rates, has trended upwards over this period. This may reflect both changes in social acceptance of males staying home to take care of children or elderly parents, but also the increase in female participation in the labor force to the ceiling reached in 1999. With more women in the formal labor force, often in jobs that pay well, a married couple might well decide that they prefer that the husband take on home responsibilities rather than the wife. The fact that such a choice can now be made is a good thing.
There may therefore be benign explanations for several of these developments leading to lower labor force participation rates. From just the evidence here, we cannot be sure. But similarly, we should not assume the development are necessarily negative.
Health issues are more complex, and also a much larger factor. The highest single cause cited for not participating in the labor force was illness or disability, for both prime age men and for prime age women when one excludes home responsibilities. In 2015, it accounted for 50% of the prime age men and 57% of the prime age women (excluding home responsibilities) not in the labor force. The shares, while high, did not change that much over time. They were 60% for men and 55% for these women in 1991.
But a roughly constant share of a total that has doubled implies a rough doubling due to illness or disability. It is certainly possible that health conditions have deteriorated for a significant sub-set of the population in recent decades. As earlier posts on this blog have documented, median real wages have been stagnant since around 1980. And the distribution of income has also become remarkably worse, with all but the top 10% seeing their real incomes falling between 1980 and 2014. Stagnant incomes do correlate with poor health status.
More directly, a study published last year by Professors Anne Case and Sir Angus Deaton (Nobel laureate) of Princeton found that mortality rates of middle-aged non-Hispanic white Americans have actually risen in the last decade and a half. There are clearly issues with health, at least among a significant segment of the population. This coincided with reports of increased incidence of severe pain and increased daily use of prescription strength pain killers, a factor highlighted by Professor Krueger in his paper on labor force participation rates.
It is difficult to say with certainty, however, whether such health conditions necessarily account for the rising share of prime working age Americans who report illness or disability as the reason for not participating in the labor force. It may also be the case that the safety net that provides support for those who are ill or disabled (such as through disability insurance that is provided as part of the Social Security system in the US) has improved over time. Workers who previously could not get such support may have remained in the official labor force, but in low wage or unproductive jobs and in great pain. If support is now provided to such workers, which was not done before, this can be a good thing.
But it must be recognized that the level of support provided to disabled workers is extremely stingy in the US. The average monthly benefit paid under Social Security Disability Insurance in the US is currently only $1,166 per disabled worker (as of August 2016), or $13,992 a year. You do not take this if you can work. The share of prime working age men not in the labor force is also higher in the US than in such countries as Canada, France, Germany, and Japan, all of which have far more generous safety nets for disabled workers than the US has.
Further work is needed to separate out these possible causes for the increase in the share reporting illness or disability. And it is important, given the dominance of this stated reason for those not participating in the labor force.
E. The Impact of Low and Stagnant Real Wages
Multiple factors appear, then, to underlie the rise in the share of prime working age males (for decades) and females (since 1999) who are not participating in the formal labor force. While certain analysts may emphasize one factor or another, often consistent with their particular political leanings, the truth is that the differing interpretations may well apply to different sets of individuals. For example, those reporting that they have retired may have retired because, as noted above, they wanted to and they could afford to. But it might well also reflect that at least some in this group could not find a good job, and hence decided (unhappily) to start to draw on their retirement savings.
More fundamentally, it is not an issue of a strict either/or. What is missing from the various rationales given is the recognition that there are trade-offs, and a decision is made as to whether to participate or not in the formal labor force depending on a balancing of these considerations. And this is really just basic economics. Econ 101 teaches that decisions are made by a weighing of different factors, and that one needs to recognize that there are trade-offs.
Critical to this is the need to recognize that median real wages have been stagnant for decades, as discussed in the earlier post on this blog cited above. The issue is not whether or not “good” jobs exist, but rather how much is being paid in wages for those jobs. Real wages have been flat, and the minimum wage is now more than one-third less in real terms than what it was in 1968.
At such rates of pay, prime working age men or women may well find it better, for example, to go to school for a few more years in the hope of getting a better paying job later, rather than work now at relatively low wages on a job. As standard economics teaches, an important cost of schooling (and typically far more important than the cost of tuition) is the cost of not working while one is in school. But if wages are low, what is lost from not working is not so high, and at the margin it makes more sense to go to school. And this factor has become increasingly important over the past several decades, as real wages have stagnated.
Similarly, at the margin one might well decide to retire early, if one can afford it, than to work longer in a low paying job. As wages have stagnated in recent decades, standard economics teaches that more workers, at the margin, will choose to switch over to early retirement. This will also hold for those who are ill or disabled. What matters is not just what might be available to the worker in disability payments (which are low), but how much this is relative to the wages they might earn. As the real minimum wage has fallen over recent decades, taking disability payments (if one is eligible) becomes relatively more attractive than taking a minimum wage job.
And this of course very much holds for those taking on home responsibilities, in particular for those taking care of children or elderly parents. If the wage of the job one can get is stagnant and low, while the cost of child care and elder care has been going up, the rational choice will increasingly be to stay at home to provide such care rather than work in a formal paid job.
The stagnation in real wages since around 1980 might then help explain, at least in part, the increase in the share in recent decades of those prime working age men and women choosing not to participate in the formal labor market. And it is interesting to note that the pace at which prime age men have chosen to stay out of the formal labor force accelerated in the period after 1980 compared to the period before. Over the 27 years between 1953, when the prime working age male labor force participation rate peaked at an average over the year of 97 1/2%, and 1980, when the average over the year was 94 1/2%, the average pace of change in the rate was 0.111% points a year. Over the 36 years from 1980 to 2016, the pace picked up to an average of 0.167% points a year. This is 50% faster. It accelerated in the period that real wages have stagnated.
F. Conclusion
The labor force participation rate for the prime working age population has been declining for men since the mid-1950s and for women since 1999. This is significant. Growth depends on the working population, and if fewer work, there will be less growth. And not being able to find a job when one wants one, whether you are counted among the openly unemployed or the hidden unemployed, can be devastating to an individual. It is not just the income that is lost, although this is of course hugely important, but also the impact on the psyche and sense of self-worth.
One has to be careful, however, in any attribution of the cause of this increasing share of the population not in the formal labor force. Many factors are involved, and one should not jump to a conclusion such as that people are lazier now than they were before, or that jobs are simply not available now and were before. One should rather recognize that choices are being made and that there are tradeoffs. People may rationally and happily be choosing to enroll as a full time student, or to stay at home to take care of children or elderly parents, or to retire early.
But one should similarly not jump to the conclusion that these are necessarily happy choices. This is especially clear for those who are not working due to illness or disability, who may obtain minimal or even no support from various disability insurance programs. Indeed, I would suspect that most of those who are not working due to illness or disability are depending on a working spouse for support.
Recognizing that these are choices that are being made is simple, basic, Economics 101. The choices may be happy ones or not, but they are all choices. Basic to such choices is what one would obtain by working at a job, which is the opportunity cost of what one is giving up by deciding not to participate in the formal, paying, job market. Central to this is the fact that wages have been stagnant for decades in the US, since around 1980. At the margin, it might make more sense now than it had before not to seek a job but rather to enroll as a student, take care of home responsibilities, or retire early. This stagnation in real wages may in part explain the acceleration of the pace of working age men dropping out of the formal labor force since around 1980.
This then suggests a further reason for why we need to be concerned with real wages that have remained stagnant, despite the significant productivity growth of recent decades. Real GDP per worker (i.e. productivity) is now 60% higher than what it was in 1980, but wages have been flat. Prior to 1980, real wages and GDP per worker both rose at a similar rate. This then broke down after around 1980.
Returning to a more equitable growth process is not, however, a trivial task nor one which can be accomplished by fiat. But this analysis suggests that should progress be made towards this, one would then expect to see higher labor force participation rates. And there are indeed actions the government can take. A number were discussed in this earlier blog post. Ensuring workers are in a position to bargain for good wages by keeping the economy at close to full employment is probably the most basic. And raising the minimum wage, which is now more than one-third below where it was in real terms in 1968, and indeed lower in real terms than what it was when Harry Truman was president, would be important for all low wage workers.
Low and stagnant real wages have had a number of adverse effects on the economy, including on productivity. A lower rate of labor force participation is likely also one of them. If you want more people in paying jobs, pay them better.

You must be logged in to post a comment.