Chart 1
A. Introduction
The delayed Employment Situation report of the BLS for November 2025 was released on December 16, 2025. It includes estimates of the job numbers also for October 2025 – figures that had not been compiled and released before due to the government shutdown. The new figures confirm that the labor market has weakened substantially this year.
With this new data, this post will compare what happened to employment since Trump took office with its growth during the latter part of the Biden administration. As seen in the chart above, there has been a dramatic slowdown. Indeed, outside the health and social assistance sector, there are now fewer jobs in the economy than when Trump took office – 134,000 fewer. There was still reasonable monthly job growth in the first few months of the Trump administration, as it takes some time before a new administration’s policies will have an impact. Measured from April 2025 (the month that started with Trump’s “Liberation Day” with the announcement of his so-called “reciprocal tariffs”), the number of jobs in the entire economy other than in health and social assistance fell by 311,000.
These comparisons are based on the change in employment relative to what it was early in Trump’s term – from January and April, respectively. More meaningful is a comparison to what employment would have been had it continued to grow from January at the pace it had in Biden’s last year in office. Had that growth continued as it had under Biden, there would have been 1.2 million more jobs in the economy as a whole by November 2025 than in fact there were.
The turnaround from the robust growth in employment under Biden has been remarkable.
This post will focus on the job numbers as well as what has happened to the average wages paid to employees. Both come from the Current Employment Statistics (CES) survey of the Bureau of Labor Statistics. The CES data come from a sample of employers reporting to the BLS on the number of workers on their payroll at mid-month and the wages paid.
A follow-up post on this blog will examine the figures in the BLS report that derive from its survey of households – the Current Population Survey (CPS). Figures on unemployment, characteristics of workers (such as age and race), and related issues can only be identified at the household level and thus come from the CPS. The survey was not undertaken in October due to the government shutdown – so no estimates will ever be available for October – but the survey resumed in November and figures are now available for that month. They also show a weakening labor market.
The first section below will look at the growth in total employment under Trump compared to what it was in the latter part of the Biden administration. Early in the Biden administration (2021 and 2022), employment growth was far higher as the economy recovered from the sharp downturn in the last year of Trump’s first administration during the Covid pandemic. But even when compared to the more steady growth in an economy already at full employment in the latter part of the Biden administration – as we will do here – Trump’s record is poor.
The section that follows will then examine what happened to the growth in average nominal and real wages of workers on employer payrolls. While still growing – as they had under Biden – that growth slowed under Trump. The penultimate section of this post will then look at the assertion made by Trump administration officials that BLS data show employment of native-born Americans soared in 2025. They are wrong. As numerous analysts pointed out already last August – when Trump officials first started to make this claim – the officials do not understand how the BLS figures are estimated. As one of them – Jed Kolko – noted, their mistaken assertions “are a multiple-count data felony”.
A concluding section will compare what the new BLS figures actually show to what a White House press release asserted they show. While one can expect any White House press release will try to put a favorable spin on newly released figures, the contortions they had to go through here are amusing. In the end, they could only make up assertions that are simply not true.
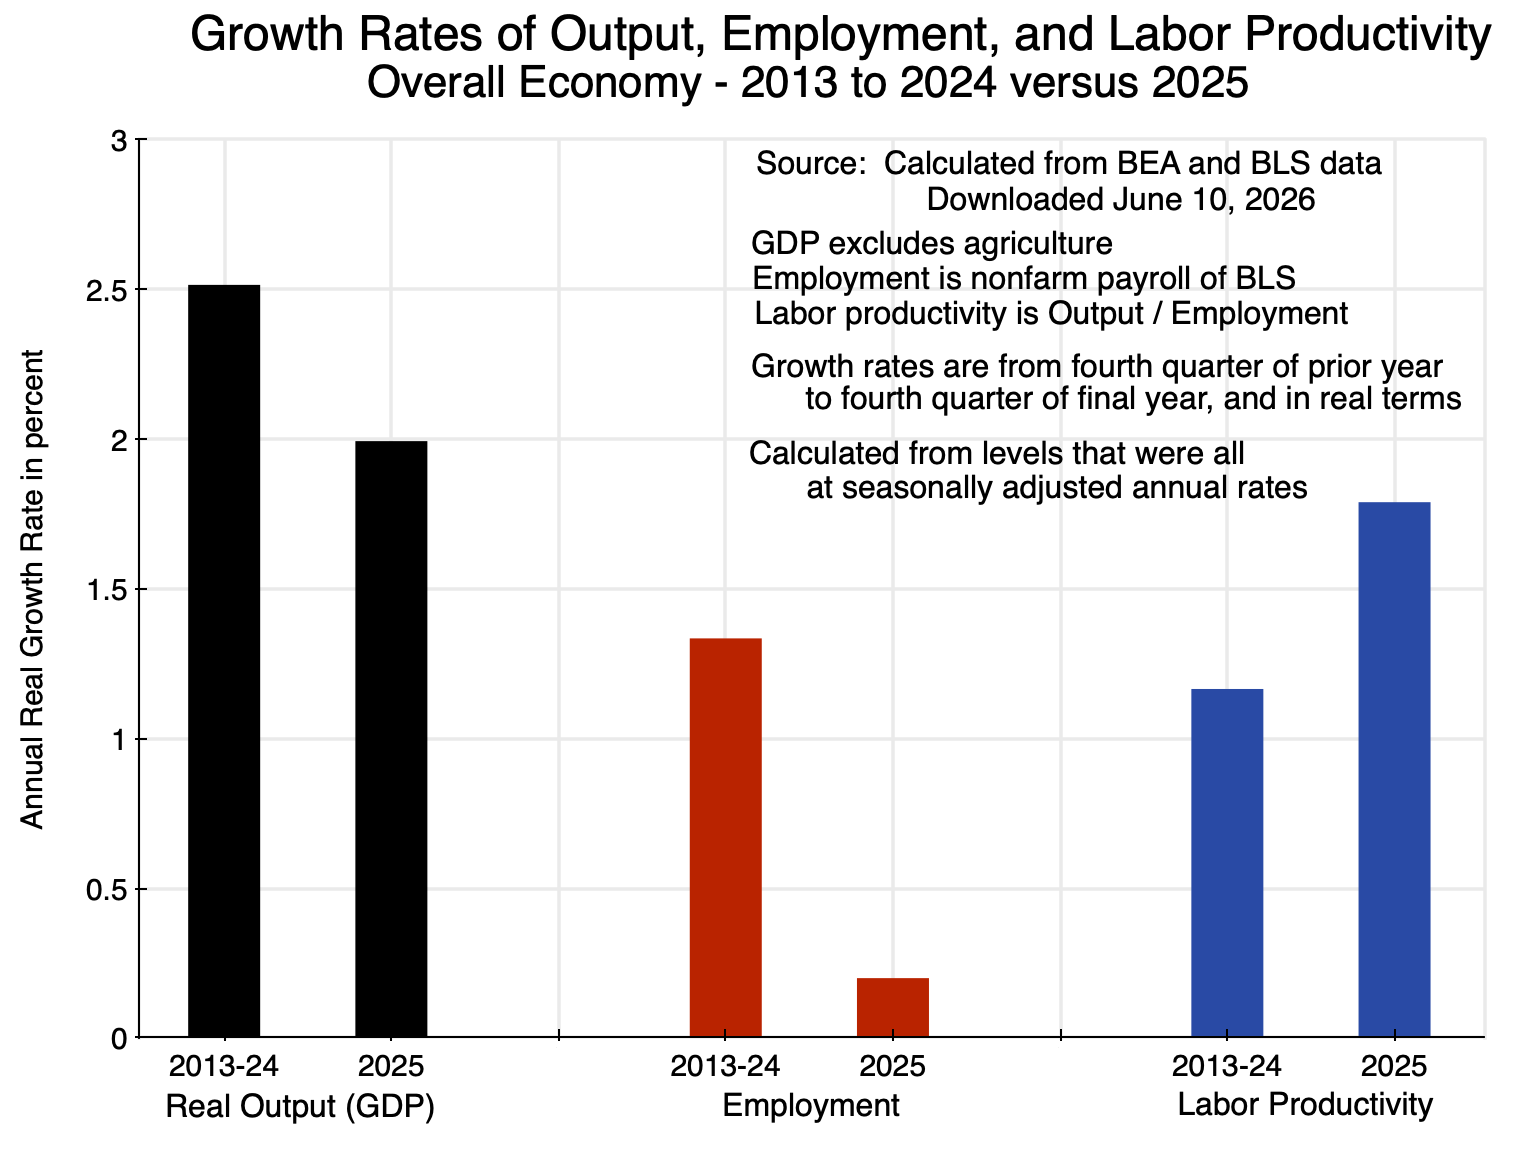
As I was finalizing this blog post, the BEA released (on December 23) its first estimate of GDP growth for the third quarter of 2025 (i.e. July to September). The estimate was of growth in real GDP of 4.3% at an annual rate when measured by the demand components of GDP – the measure that most people focus on. Real GDP was estimated to have grown at a 2.4% rate when measured by the income components of GDP (with this measure of GDP referred to as Gross Domestic Income, or GDI). In principle, the two measures (GDP and GDI) should come out exactly the same, as whatever is produced and sold will be someone’s income. But typically they do not due to measurement error and statistical noise. The 4.3% growth rate is certainly high, and the highest since the third quarter of 2023 when real GDP grew at a rate of 4.7%. Estimated inflation in the third quarter of 2025 was also high, with the price index for GDP rising by 3.8% at an annual rate – up from 2.1% in the second quarter and 3.6% in the first, and the highest since 2023. The core Personal Consumption Expenditures price index (i.e. the price index excluding food and energy items) rose at a rate of 2.9% – an increase from the 2.6% rate in the second quarter and above the Fed’s target rate of 2.0%.
This high rate of real GDP growth (when measured by the demand components of GDP) is especially surprising given the lack of significant growth in employment. For a proper comparison, one should compare the growth in GDP to the growth in average employment in the third quarter (the average number employed in July to September) over that in the second (the April to June average). Between those periods, average employment rose by 0.2% (at an annual rate).
No one really knows why this first estimate of GDP growth in the third quarter was so much higher than the growth in employment in that period. With labor productivity growth of 2% per annum (not far from the long-term average in the US before around 2008), then to get real GDP growth of 4% would require additional employment of about 2% (using rounded figures). But as noted, employment grew only at a rate of 0.2% in the third quarter.
There are many possible reasons. I may put up a post on this blog to discuss such issues, and on the new GDP report more broadly. This current blog post will remain focused on what has happened to employment this year.
B. Growth in Employment
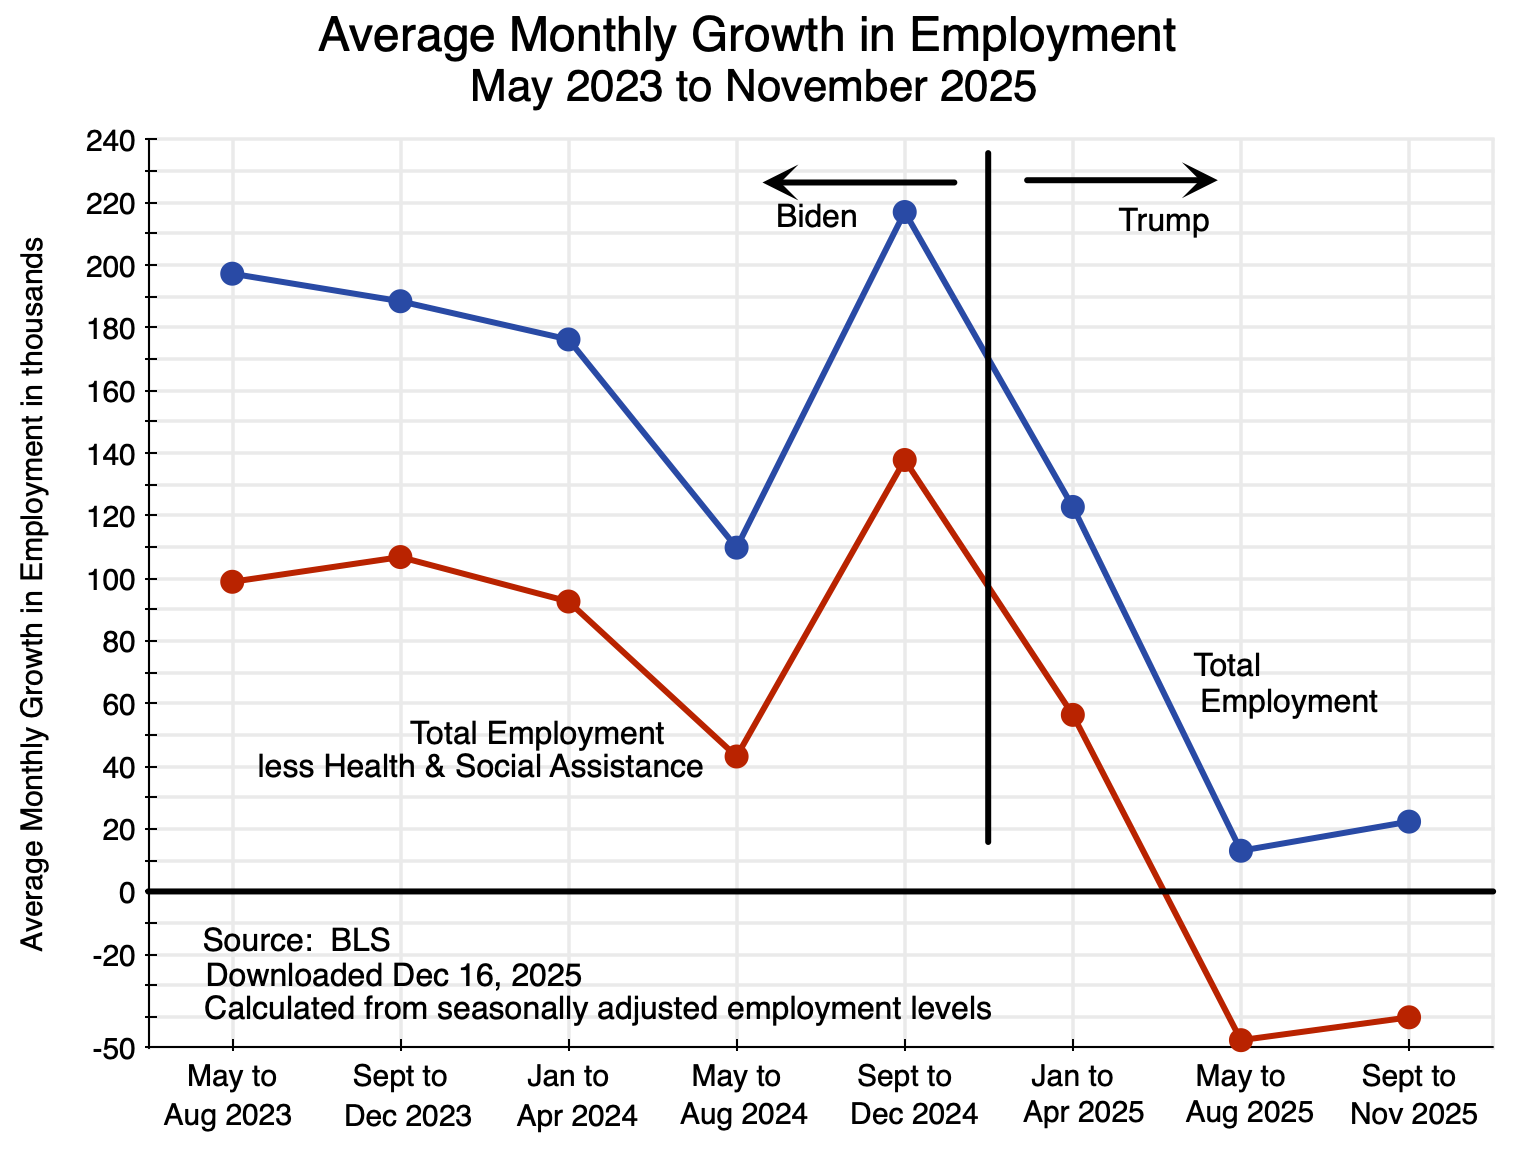
Chart 1 at the top of this post shows average monthly growth in total employment since May 2023 and in the monthly average outside of the health and social assistance sector. Growth from the May 2023 date was chosen as the unemployment rate reached a trough in the prior month of just 3.4% of the labor force – the lowest unemployment rate in more than 50 years. The economy was then at essentially full employment through the end of Biden’s term. Four-month averages are taken to smooth out the normal month-to-month fluctuation in the figures (due in part simply to statistical noise), with a three-month average for the September to November 2025 figures.
The figures come from the CES survey of employers on the number of employees on their payroll (as of the payroll period that includes the 12th day of each month). The survey does not include those employed in the farm sector. Thus the figures are more properly referred to as the “nonfarm payroll”. But since agriculture employees account only for 0.8% of the labor force (based on CPS numbers), the difference – especially when looking at month-to-month changes in employment – is not significant and is typically ignored. Of much greater significance is that the nonfarm payrolls also exclude the self-employed in unincorporated enterprises. The self-employed account for 6.0% of the labor force (based again on CPS data). One cannot know if they are self-employed by choice or because they cannot find a job on some firm’s payroll.
Employment growth during Biden’s term in office was high. Total employment grew at a rate of 603,000 per month in 2021 and 380,000 per month in 2022 as the economy recovered rapidly from the downturn in the last year of Trump’s first administration. But setting this aside and limiting the analysis to job growth during Biden’s term in office from May 2023, employment grew at a good and sustainable pace under Biden. Total employment grew by 1.3% in 2024, in the last year of Biden’s term.
Employment growth then fell sharply under Trump, especially since May. This is seen in Chart 1 at the top of this post. Overall job growth in the economy as a whole fell from 217,000 per month in September to December 2024 under Biden, to 123,000 per month in January to April 2025, just 13,000 per month from May to August, and 22,000 per month from September to November. And more than all of the growth in 2025 was due to growth in the health and social assistance sector. Other than in just this one sector, job growth fell from 138,000 per month in September to December 2024 under Biden, to 56,000 per month in January to April 2025, and then to a fall of 48,000 per month from May to August and again a fall of 40,000 per month from September to November.
Trump’s policies of high tariffs and other measures have also failed in their stated aims of raising employment in the manufacturing sectors and in particular in the motor vehicles sector. Jobs in manufacturing fell by a total of 58,000 between January and November 2025, while jobs in the motor vehicles sector fell by a total of 15,000.
Trump’s press people have also been proud to assert that “100% of the job growth” under Trump “has come in the private sector”. It is true that job growth – such as it was – was greater in the private sector than in the economy as a whole (i.e. including the public sector). But the reason is that while the growth in private sector jobs fell in the first ten months of Trump’s term in office by 45% compared to what it was during Biden’s last ten months in office, total employment in the economy as a whole fell by an even greater 68% under Trump:
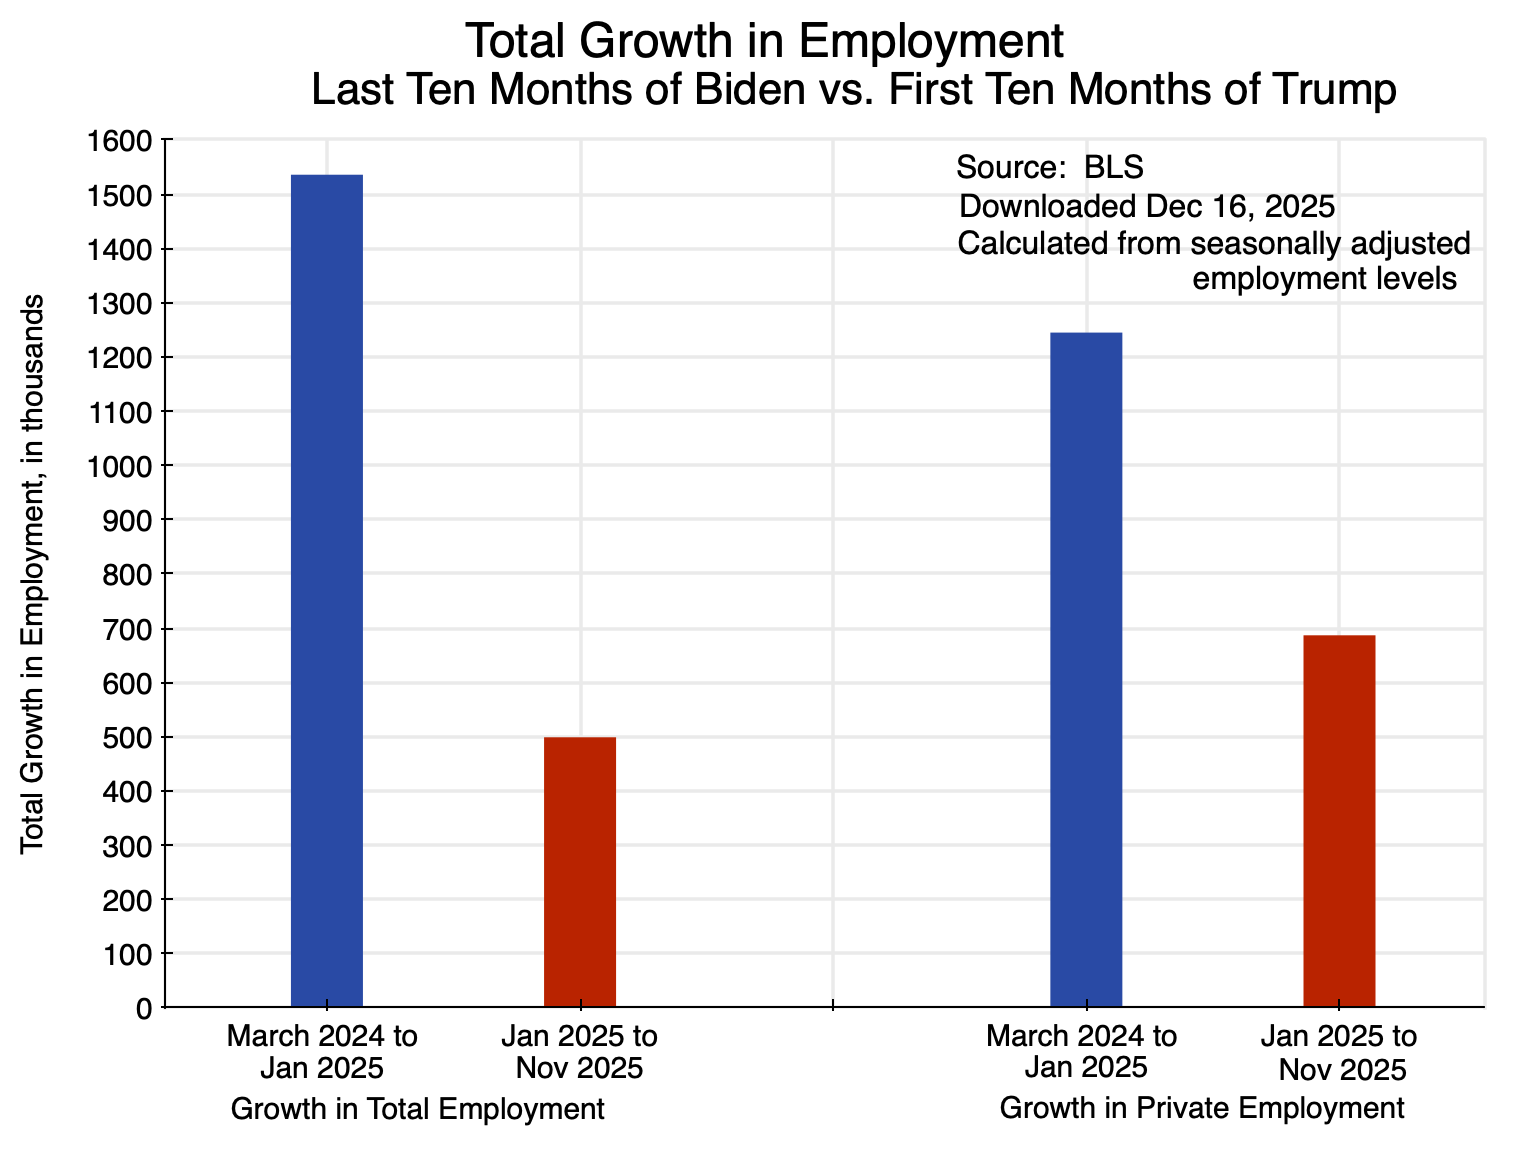
Chart 2
It is not clear why this is a record one should be proud of. It is true that public sector jobs – particularly in the federal government – have fallen under Trump. This was a consequence of the chaotic federal job cuts that Trump empowered Musk and DOGE to force through. But the federal workers who were dismissed have not been able to transition easily to private employment in a robust job market. Private employment grew at a far slower pace than it had before.
Another issue to consider is the extent to which Trump’s policies to deport migrants in the US and block new ones from entering the country may account for some share of the reduction in employment in 2025. There is little doubt that it accounts for some share of the fall, but when one looks at the numbers, it is clear it can only account for a small share of it. There is also no indication that the reduction in the number of migrants employed led to greater employment of native-born Americans – at least at the aggregate level. The unemployment rate for native-born Americans rose in 2025. It did not fall, as it would have if migrants taking jobs had kept native-born Americans from finding employment.
I will address these issues related to migrants in the labor force in the penultimate section below. But first, we will look at what has been happening to the growth in nominal and real wages under Trump.
C. Nominal and Real Wages
In addition to the employment figures, the CES survey of employers gathers data on the average wages paid by the surveyed firms. From this the BLS can calculate what has happened to average nominal wages. Coupled with estimates for inflation (the CPI – also estimated by the BLS), one can then obtain an estimate of what has happened to average real wages.
By definition, such changes need to be measured over some period of time. Using changes over the same month one year earlier, one has:

Chart 3
Over this period, average nominal wages over the same month in the previous year grew at a pace of between 4.0 and 4.2% in the period leading up to the end of Biden’s term in office. In more recent months, that growth has slowed to a pace of 3.5% to 3.7%. The change is not huge, but it is on a declining trend. The 12-month increase in the CPI has varied more – within a range of 2.4 and 3.0% over the period – going up some over the 12 months ending in January 2025, then declining in the 12 months ending in March to May, and then rising again. The 12-month increase in real wages – the combination of the changes in nominal wages and in inflation – has since May been on a falling trend.
A few cautions should be noted regarding the recent data. First, no CPI data was collected for October 2025 due to the government shutdown. For the calculations here, I assumed the CPI index for October was simply the average of the estimates for September and November. Second, analysts have noted that the November data for the CPI should be treated cautiously as it may be biased low. The figure published indicated inflation as measured by the overall CPI was 2.7% over the year-earlier period, when most analysts were expecting an increase of 3.0 or 3.1%. Two main issues have been highlighted. First, some specialists on such data believe that inflation in the Shelter component of the CPI (which accounts for 35% of the overall CPI index) may have been underestimated due to an assumption (possibly implicit) of zero inflation in October in the Owners’ Equivalent Rent of Residences component of Shelter (accounting for three-quarters of the Shelter index). No data had been gathered for October due to the government shutdown, but whatever it may have been was almost certainly not zero.
Second, field data on prices only began to be collected on November 14, when the federal government reopened. That meant that the November data used to estimate inflation came only from the second half of the month. That meant that a higher than normal share of the prices would have come from a period when many items are on sale due to the holidays (Black Friday and such). While seasonal adjustment factors for November would normally take into account the late November sales, they would have undercompensated this year as the historically determined seasonal adjustment factors are estimated for the month as a whole, not just for the second half of the month. That is, had the BLS been able to collect data over the full month rather than just the second half, the resulting inflation estimate may have been higher.
It is difficult to know how significant these possible biases in the CPI data might have been. But while we cannot estimate the magnitude, they point in the direction of a higher rate of inflation. At a higher rate of inflation, real wages in October and November grew by something less than what is shown in Chart 3 above.
But even without such corrections, real wages have not been rising as fast as they were before. They are still increasing, but at a somewhat slower pace. That pace has certainly not risen.
D. The Impact of Immigrants
One factor that will account for a share of the lower employment figures in 2025 (relative to the trend under Biden), will be the reduction in immigrant labor due to Trump’s aggressive policies on migration. Immigrants resident in the US (often long-time residents in the US) are being deported, while new immigration is being blocked (other than by White South Africans).
A first question is how large an impact this might have. It is difficult to come up with hard data on this, but perhaps the best estimate can be found in a study published by the American Enterprise Institute (a center-right think tank in Washington, DC). It came out in July 2025 and is thus a forecast of what net migration may be in the context of Trump’s new policies. Estimates are provided for 2025 as well as the next several years.
It provides its estimates as a range. For 2025, it estimates that net migration may be somewhere between net outward migration of 525,000 and net inward migration of 115,000. That is a broad range, but gives a sense of what the magnitude may be. One must then make several adjustments. First, multiplying by 11/12 as November is the 11th month of the year, the range would be (with all figures rounded) net migration of – 480,000 to + 105,000. Second, these are figures for the total number of migrants, not just those employed. It will include spouses, children, university students, retirees, and others not seeking employment. Among adults, the labor force participation rate has been around two-thirds. Adjusting for children, the share is likely less than half. Assuming one-half, the range is then – 240,000 to + 52,500, with a mid-point of – 94,000.
That is, with Trump’s policies in place, the net outmigration of workers in 2025 may be on the order of perhaps 100,000, although perhaps up to 240,000 or even a net inmigration of 94,000. While not trivial, these figures are small compared to the reduction in employment of 1.2 million that one has seen under Trump (through November) compared to what it would have been had employment continued to grow as it had during Biden’s last year in office. And 100,000 fewer workers is just 0.06% of the US labor force of over 171 million.
Net outmigration of that magnitude – or even several times that magnitude – is too small to have a major impact on the number of native-born American citizens employed. Further, the unemployment rate of native-born Americans has been rising in 2025 rather than falling – from a rate of 3.8% in November 2024 to a 4.3% rate in November 2025. This will be discussed further below.
There is thus no evidence at the macro level that employing fewer migrants has led to an observable increase in employment of native-born American citizens. What has happened instead under Trump’s policies is that some number of migrants – who had been working at jobs and paying their taxes (including Social Security taxes, even though they will not be eligible for Social Security benefits) – will no longer be producing goods and services for the American economy. That work – at the overall level – is just not being done.
Trump administration officials have nevertheless repeatedly claimed that BLS data can be used to show that the number of native-born Americans employed jumped dramatically in 2025. They are wrong. They do not understand how the BLS data are constructed. Jed Kolko, a senior fellow at the Peterson Institute and who has explained their error in detail, has called those assertions a “multiple-count data felony”.
A full explanation will not be provided here. It is a technical issue, and a mistake that non-specialists can make if they are unfamiliar with how the BLS estimates are constructed. Dean Baker provides an easy to follow explanation of the issues here ahd here, while Jed Kolko explains the issues in more detail here and here.
Briefly, the figures often cited (incorrectly) come from the standard Table A-7 of the BLS monthly Employment Situation report. That table provides figures from the CPS survey of households for native-born citizens and separately for the foreign-born (whether citizen or not) on the adult population, the number in the labor force, the number employed and unemployed, those not in the labor force, and the unemployment rate as well as the employment/population ratio.
The issue arises because the population controls to go from the survey results to the aggregate figures for the adult population as a whole are set annually and then not changed. These controls for the total adult population (native and foreign-born together) come from the Census Bureau, and it is then forecast to grow at some steady rate from month to month over the year from the figure fixed in January.
There are then two major problems. One is that when the population control figures are updated each January, the BLS does not go back to revise the CPS estimates (on anything) in the prior year. Thus the BLS clearly warns people not to make comparisons of figures on totals (such as the number employed) from one year to the next (such as between November 2024 and November 2025). In contrast, the number employed in prior years in the CES estimates – the nonfarm payroll estimates – are revised each January when the population and other controls are updated. That is why figures such as those above in Charts 1 and 2 are comparable over time.
The second major issue is that the BLS estimates the number of foreign-born in the adult population from figures obtained through the CPS, and then calculates the number of native-born by subtracting the foreign-born from the estimated population totals. Thus if the number of foreign born respondents in the CPS household survey goes down in some month (which might happen because those in the household were deported, or were worried they might be deported if they responded honestly and hence decided either not to respond at all or to indicate they were native born – understandable given that the Trump administration has openly violated the confidentiality rules that are supposed to apply to such surveys), then the BLS estimate of the number of foreign-born in the adult population will go down. And since the totals for the adult population derived from the Census Bureau figures each January are not changed (but rather grow from month to month at some pre-set level), a smaller estimate for the foreign-born population from the CPS responses will lead by simple arithmetic to an increase in the figure provided for the native-born population.
Year-to-year comparisons of the number of native-born Americans in the BLS figures can thus jump around and are not meaningful. For example, between November 2024 and November 2025 the figure for the adult population of native-born Americans jumped by 5.3 million, or 2.5%. The year before (November to November) it grew by 346,000, or 0.2%. And the year before that by 1.9 million, or 0.9%. In reality, the native-born population of adults in the US does not jump around like that from one year to the next. As Kolko has said, to make such year-over-year comparisons in these BLS figures is a “multiple-count data felony”. The error in such comparisons will carry over to comparisons across years in the labor force and employment figures.
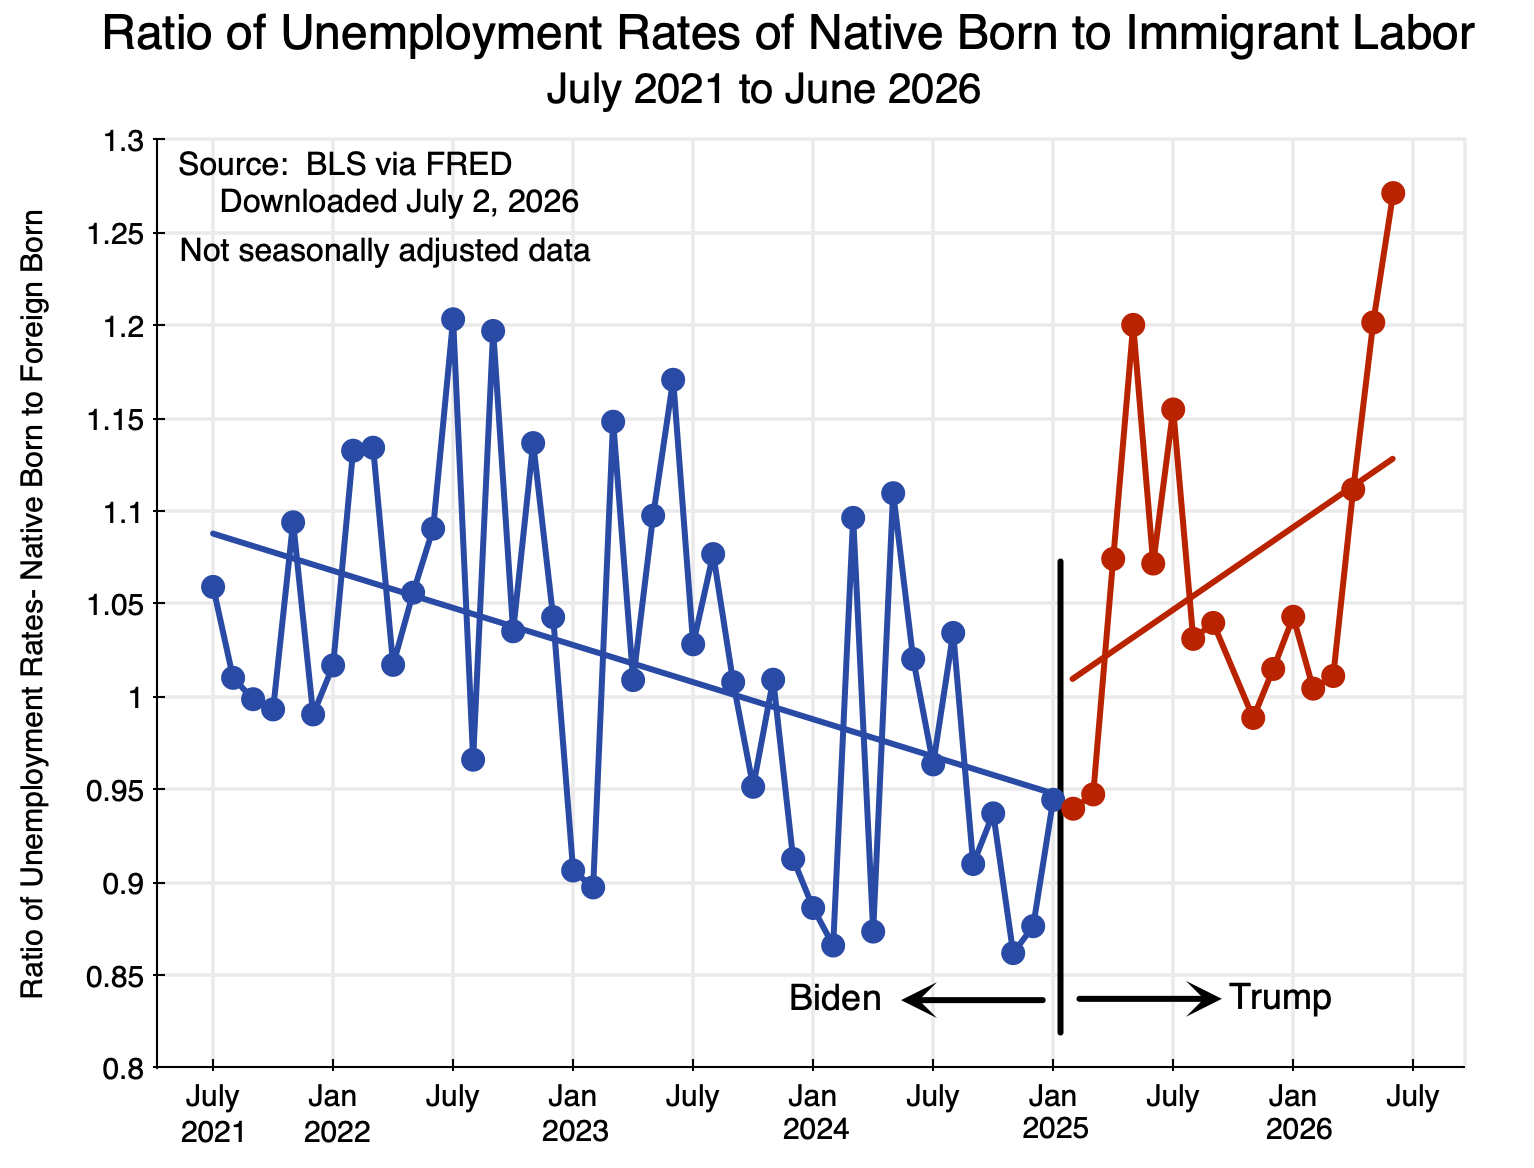
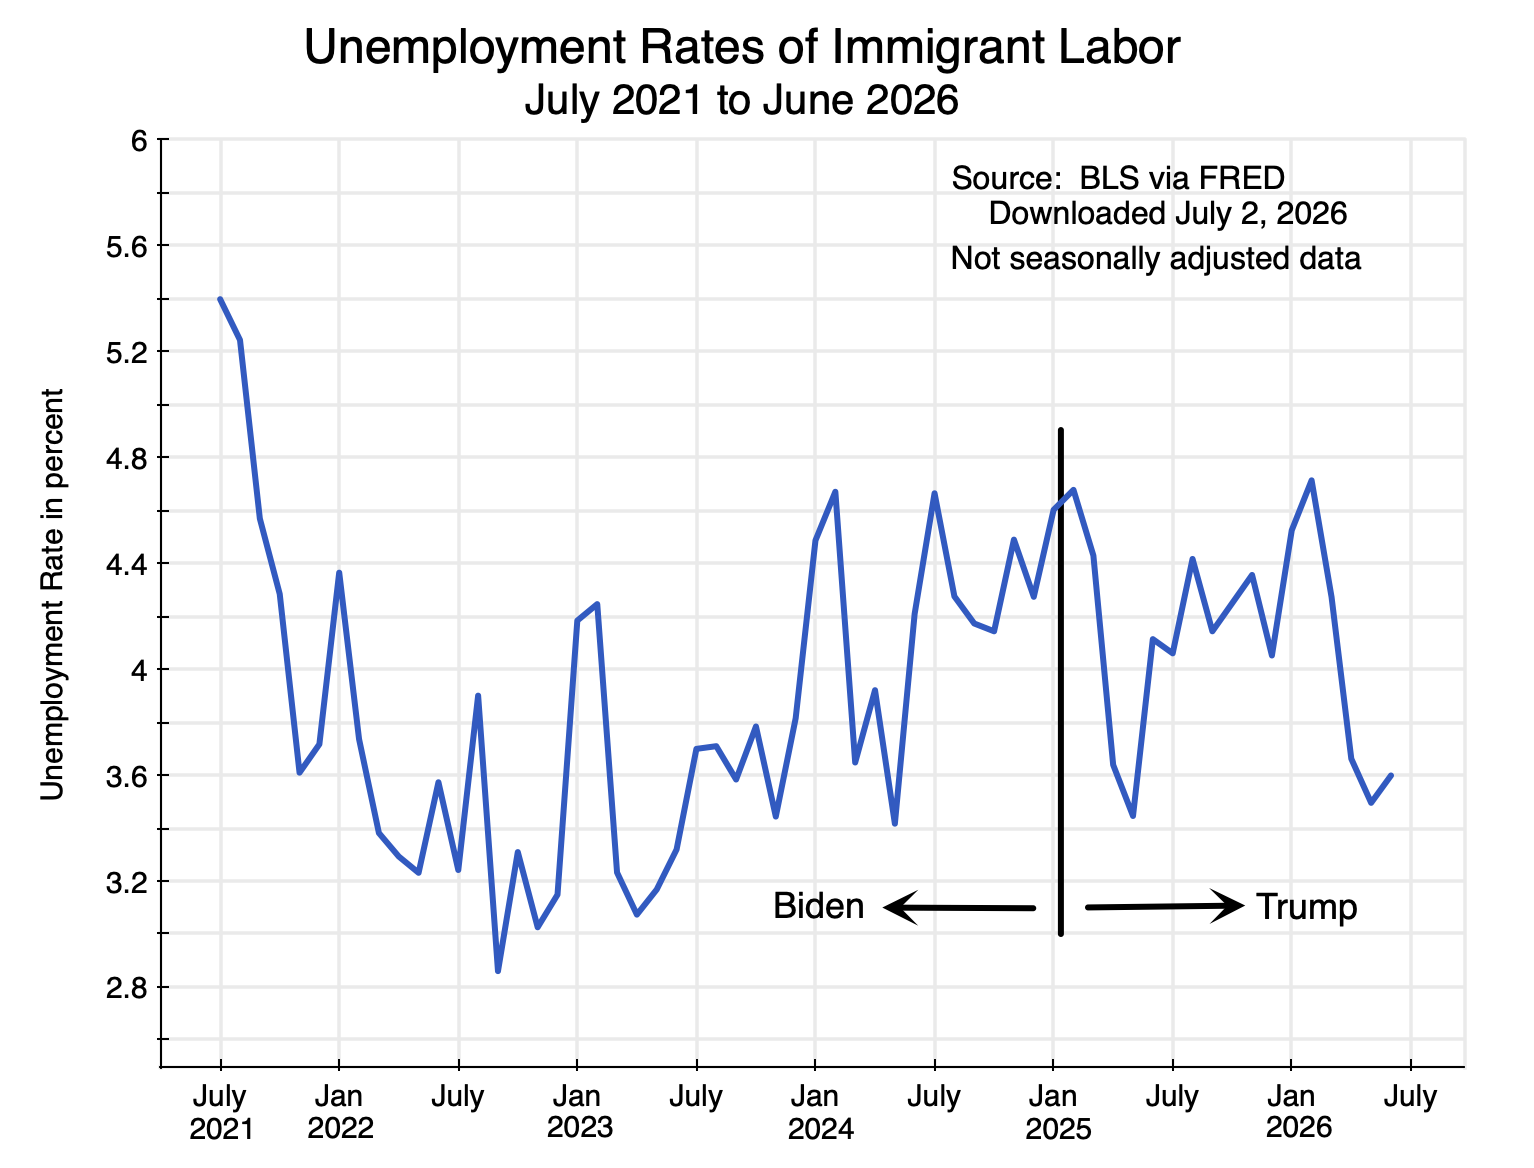
As Kolko has noted, the most meaningful way to track what may be happening to the native-born and foreign-born populations in the labor market is to look at their reported unemployment rates. These rates come directly from the household surveys, are independently determined for each, and will indicate whether employment prospects are improving or worsening. An issue is that none of the figures in the BLS Table A-7 of its monthly Employment Situation report are seasonally adjusted. Thus the month-to-month reported changes in the unemployment rates will vary due to seasonal effects. It is better (although still not ideal) to compare the reported unemployment rate to that of the same month the year before. And these have been going up in 2025 for native born Americans. The November 2025 rate was 4.3%, up from 3.9% in Novermber 2024.
A seasonally adjusted series would be more useful to track the trends. Jed Kolko has calculated an estimate of this for the unemployment rates of the native-born and foreign-born, using standard software for making seasonal adjustments from historical data. The estimates he has released go through July 2025, and show a rising trend in 2025 (and since mid-2023 in his chart) for the unemployment rate of the native-born labor force. While there is still a good deal of month-to-month fluctuation in the figures, the trend is basically the same from mid-2023 to mid-2025. That is, Trump’s aggressive policies on immigrants have not affected this trend.
Trump administration officials continue to claim that the BLS data show that the employment of native-born Americans soared in 2025. Despite analysts pointing out already last August the error in making such year-to-year comparisons in the BLS CPS data, Trump administration officials continue to make this mistake. It would be understandable that originally they may have misunderstood the basis of the BLS figures. It is a technical issue, and non-specialists would likely not be aware of it. But by failing to correct their understanding of the issue once it was pointed out to them, their continued and repeated claims (most recently for the November figures) can only be viewed as moving from misunderstanding to misrepresentation to outright lying.
E. Summary and Conclusion
The labor market has weakened substantially this year. Employment had been growing at a good pace under Biden. But in the first ten months of Trump’s second term in office, the country ended up with 1.2 million fewer jobs than there would have been had they grown at the pace achieved during Biden’s last year in office. And if one excludes just the growth in employment in the health and social assistance sector, there were 134,000 fewer employed by November than there were in January, and 311,000 fewer compared to the number that were in April.
Trump’s deportations and other aggressive policies on migrants likely accounted for some share of this drop in employment. But the fall in employment under Trump (relative to what it would have been had it continued to grow as under Biden) has been far more than can be accounted for by fewer migrants being employed. And there is no evidence that fewer migrants being employed led to more native-born Americans being employed. The unemployment rate of native-born Americans has gone up under Trump. Furthermore, the growth in nominal and in real wages has diminished under Trump. Deporting migrants did not lead to higher wages for those remaining.
Trump’s White House claims otherwise. The White House press release issued on the day the BLS Employment Situation report for November was released opened by saying (in bold in the original):
“The strong jobs report shows how President Trump is fixing the damage caused by Joe Biden and creating a strong, America First economy in record time. Since President Trump took office, 100% of the job growth has come in the private sector and among native-born Americans — exactly where it should be. Workers’ wages are rising, prices are falling, trillions of dollars in investments are pouring into our country, and the American economy is primed to boom in 2026.”
— White House Press Secretary Karoline Leavitt
Breaking this down by phrase, with then what has in fact happened:
The strong jobs report shows how President Trump is fixing the damage caused by Joe Biden and creating a strong, America First economy in record time.: Not true. Job growth was substantial under Biden, and this growth then collapsed under Trump. By November, there were 1.2 million fewer jobs under Trump than there would have been had growth continued at the pace it had in the last year of Biden’s term.
Since President Trump took office, 100% of the job growth has come in the private sector: The growth in private sector jobs was 45% less in the first ten months of Trump’s second term in office than it was in the last ten months of Biden’s term in office. Private job growth was greater than job growth in the economy as a whole (including the public sector) only because that growth fell by an even greater 68% under Trump. This is not a record to be proud of.
and among native-born Americans — exactly where it should be.: As explained in Section D above, this conclusion is based on a mistaken understanding of how the BLS figures on employment of the native-born and the foreign-born are estimated. Such year-to-year comparisons are not meaningful. What we do know from the BLS figures is that the unemployment rate of the native-born labor force has gone up in 2025.
Workers’ wages are rising,: They are rising at a slower rate than they were during the Biden administration.
prices are falling,: No. Prices are rising.
trillions of dollars in investments are pouring into our country,: While not something addressed in the BLS report, this reference is to promises made by various countries – as part of their trade negotiations with the Trump administration – to increase their investment into the US. Figures “promised” range up to $1.4 trillion (by the United Arab Emirates), $1.2 trillion (by Qatar), and $1.0 trillion (by Japan), along with promises from other nations as well. The investments would largely be made by private firms from the respective countries, even though it is not clear how public officials can commit their private firms to make investments of the magnitude promised. The time frames are also not always clear.
There is no evidence that such investment is “pouring into” the US. They are certainly not “pouring into” new fixed investments being made. Total private fixed investment expenditures in the US from all sources (almost entirely domestic) were only $126 billion higher in the first three-quarters of 2025 than they were in the last quarter of 2024. This is far from “trillions” even if it were entirely by foreign investors (which it was not). Unless the vision is that foreign investors will displace domestic American investors – and take over control of the American economy – foreign investment of such magnitude will never happen.
Nor is it something most would want. Recall the worries in the late 1980s (such as depicted in the popular book and movie Rising Sun) that Japanese investment would soon take ownership and control over significant assets in the US. Recall also the concerns that arose after Japanese investors had purchased existing assets such as Rockefeller Center, Columbia Records, and the Pebble Beach Golf Course.
If anything close to the scale of investments by foreign firms the Trump White House is citing eventually materialize, the Japanese investment in the late 1980s will look puny.
Furthermore, for such foreign investment into the US to materialize on anything close to the scale the Trump White House is claiming, the trade deficit of the US would have to increase sharply. This is the exact opposite of the claim that the negotiated trade agreements will lead the US trade deficit to go down. Foreign investors will only be able to get the dollars to make the additional investments in the US if the US imports more from others. This illustrates the confusion and lack of coherence in the Trump administration’s trade policies.
The discussion is, however, academic. There will never be anything close to an increase in foreign investment into the US at the scale being claimed.
and the American economy is primed to boom in 2026.: That remains to be seen.


You must be logged in to post a comment.