
A. Introduction
One of the main arguments Bernie Sanders has made for why he should be the nominee of the Democratic Party to run against Trump is that he would spur a much higher turnout, especially of young voters who would not otherwise go to the polls (with those young voters favoring him). But this has not turned out to be the case in the Democratic primaries held thus far. While turnout has gone up substantially, Sanders has not been receiving an exceptionally high share of that increased turnout. And even Sanders has now acknowledged that a higher number of younger voters that he argued would go to the polls to vote for him have not materialized.
So what has been going on? To summarize what will be discussed in more detail below, in the primaries held thus far the share of the votes going to Sanders has gone down compared to what he received in the same primary states in the 2016 elections. But the share going to Sanders and Elizabeth Warren combined has been similar (indeed almost identical overall) to what Sanders received in 2016, when it was essentially only him running against Hillary Clinton. Similarly, the share going to Joe Biden, Amy Klobuchar, Pete Buttigieg, and Michael Bloomberg has been similar to the share that had gone to Clinton. This very much looks like a case of Democratic Party primary voters with a separation between those who hold the more extreme liberal views of Sanders and Warren, and those with the more moderate views of Biden, Klobuchar, Buttigieg, and Bloomberg (although it is not really correct to view them as moderates – the positions they hold are all well to the left of the positions that were held by Obama when he served as president). Primary turnout has gone up, but with similar shares as before of voters in those two channels in that increased turnout.
Pundit commentary, at least until recently, has not focused on this. Rather, in the Democratic primaries and caucuses held in February before South Carolina (i.e. following the contests in Iowa, New Hampshire, and especially Nevada), all attention was on Sanders winning the vote count (modestly in Iowa and New Hampshire, more significantly in Nevada). It was not on what the outcomes might be telling us on the broader issue of who will, in the end, amass the delegates needed ultimately to win the Democratic nomination. Sanders was deemed the “front-runner”.
And then all were surprised when the vote in the South Carolina primary appeared to be so different. However, if a comparison had been made to the results of the 2016 primary in that state one would have seen important similarities.
This has now become more clear with the results from the Super Tuesday primaries. Turnout (in all but one of the states) has gone up, and sometimes quite substantially. The Democratic base is clearly energized. But the higher turnout was not of voters disproportionately supporting Sanders. Indeed, the share voting for Sanders has gone down compared to the share that voted for him in 2016. Rather, across the states with primaries held thus far, the share going now to Sanders and Warren together is very close to what Sanders had received before, and the share going to Biden, et. al., was similarly close to what Clinton had received before. Thus the higher turnout was composed of similar shares of voters in the two groups.
There were of course differences in several of the individual states. For the analysis here I looked at the ten states who held primaries and not caucuses (vote counts in caucuses are different, with far lower participation), did so in both 2016 and 2020, and held their primaries in each of those years on Super Tuesday (March 1 in 2016, March 3 in 2020) or before. Thus this excluded states like Colorado and Minnesota (which held caucuses in 2016), or had primaries (or caucuses) after Super Tuesday in 2016. The most important, and largest, state thus excluded is California, which held its primary on June 7 in 2016. I will discuss separately the special case of California.
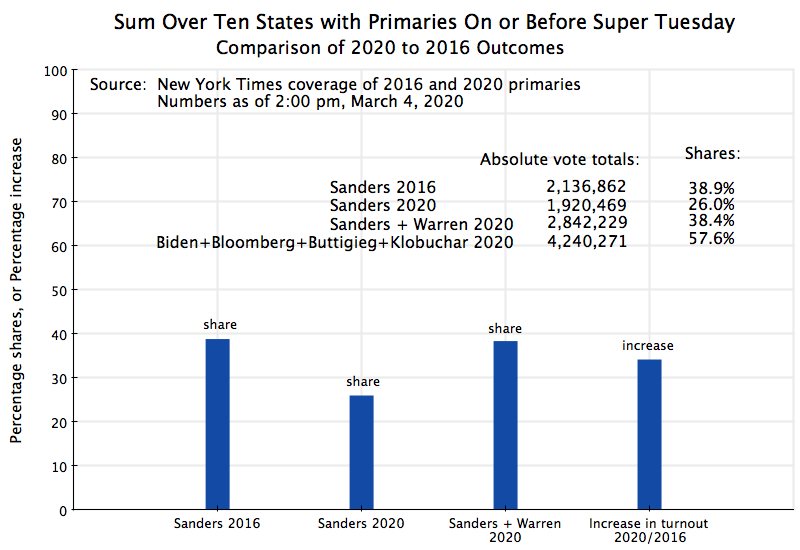
The overall results for those ten states are summarized in the chart at the top of this post. But rather than discuss that one first, it is perhaps better to examine the cases in a few of the states individually, before looking at the overall totals across the ten states. The vote numbers are all as reported in the New York Times, at this post for 2016, or at this post for 2020. The 2020 results are all as shown as of about 2:00 pm on Wednesday, March 4. At that point, almost all were either complete (with 100% of precincts reporting) or close to it (with 99% or more in two cases, one at 97.0%, one at 93.8%, and one at 93.4%). There will be some differences, but small, as they get to 100% of precincts reporting, and as mail-in ballots are fully counted (rules vary by state). However, these will likely not affect the shares to any significant degree, which are the focus of the analysis here. And while it will not change the shares, I did scale up to 100% the figures for the cases where fewer than 100% of the precincts had reported, in order to estimate what the total votes (and hence change in turnout) will be and to add up the figures consistently across the states.
B. Individual States
The South Carolina primary, which was critical for Biden, shows well what the pattern has been. The key results are summarized in this chart:
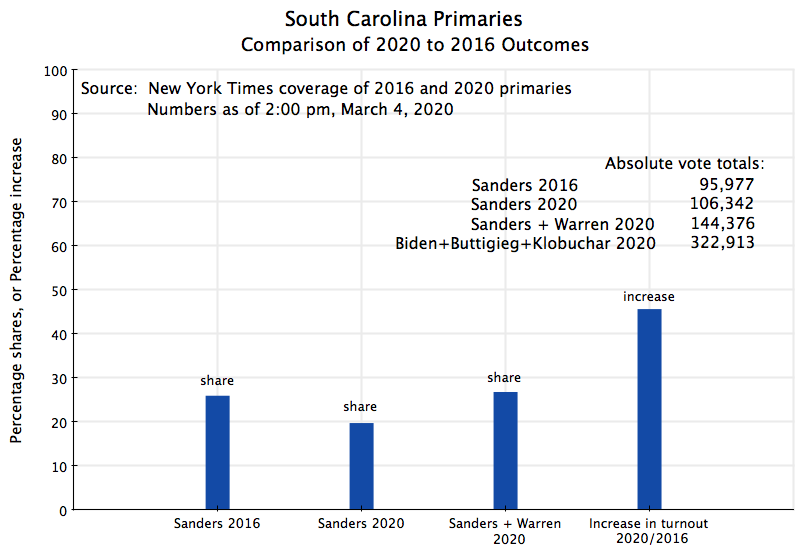 Sanders received only 26% of the vote in this primary in 2016, losing badly to Clinton who received 73% of the vote. And that share of Sanders went down to 20% this year, even though there was a 46% increase in turnout. But Sanders plus Warren together received 27% of the vote, almost the same as what Sanders received in 2016. Despite an increase in turnout of close to half, the share going to the extreme liberal candidates remained about the same – not more, not less.
One saw the same in Virginia:
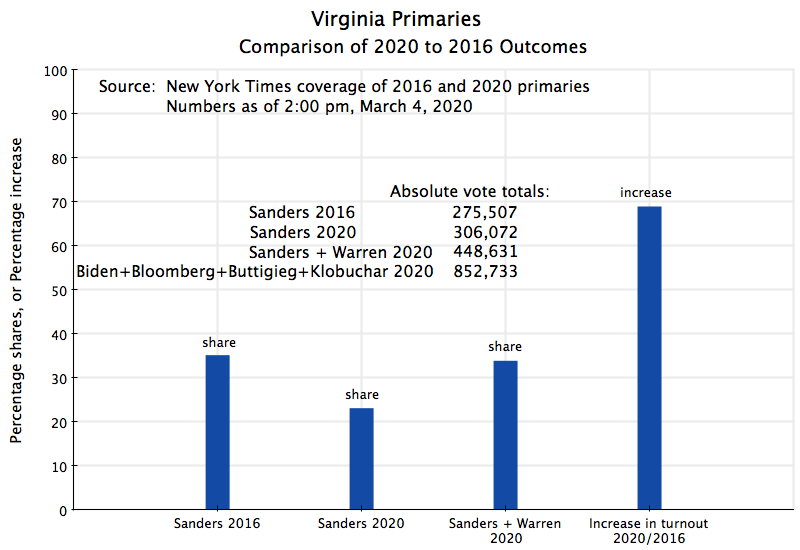
Here turnout rose by close to 70%. And the Sanders share fell again, from 35% in 2016 to 23% in 2020. But Sanders and Warren together received 34%, very close to what Sanders had received before. Despite the far higher turnout, the shares were close to unchanged (taking Sanders and Warren together).
As noted above, there were a total of ten states where one could make such a comparison. I won’t go through them all, and there were individual exceptions. One noteworthy case was that of New Hampshire, the state with the first primary (Iowa is a caucus):
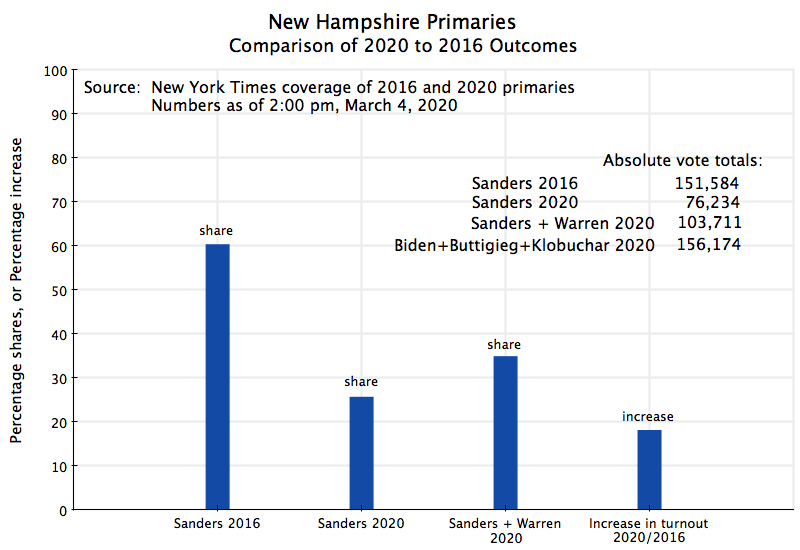
Bernie Sanders did exceptionally well in that primary in 2016, receiving 60% of the vote, against Hillary Clinton’s 38% (with other candidates receiving the rest). Sanders won again in 2020, but this time with only 25.7% of the vote (with Pete Buttigieg in second place at 24.4%). But while the pundits focused on Sanders winning that primary again, I did not see mentioned that despite an increase in turnout (of a not insignificant 18%), the absolute number of votes Sanders received fell in half (falling from 151,584 in 2016, to just 76,234 in 2020). And even if one adds in the votes that Warren received, the total still came only to 103,711, with a share of 35%.
There were two other states where Sanders and Warren together did significantly worse than Sanders alone in 2020. One was in Sanders’ home state of Vermont, where Sanders received 86% of the vote in 2016 while Sanders and Warren together received just 63% in 2020 (despite a 17% increase in turnout). The other was Oklahoma, where Sanders received 52% of the vote in 2016 while Sanders and Warren together received just 39% in 2020 (and is the one state where turnout fell – by 7%).
These states were offset by Texas, where Sanders received 33% of the vote in 2016 (and 30% in 2020), but where Sanders and Warren together received 41% (with turnout rising 47%). In the other states, the shares of Sanders in 2016 and Sanders plus Warren together in 2020 were pretty much the same. Especially similar was the case of Massachusetts (the home state of Warren): Sanders received 48.7% of the vote in 2016, while Sanders plus Warren received 48.3% in 2020.
California is also a special case, but an important one. In 2016, the California primary was held on June 7, close to the end of the primary season. Close to 5.1 million voted in the Democratic primary in that year, and Sanders won 45.7% of the vote. As I write this (in the evening of Friday, March 6, and based on what is shown on the New York Times website), California has posted results for only 89% of the precincts. Why this is less than 100% three days after the primary is not clear to me. California also accepts mail-in ballots that were mailed on election day or before, and the state allows up to a month for these to come in.
But based on what has been reported as of now, Sanders plus Warren together received 45.9% of the votes, almost exactly the same as the 45.7% Sanders received in 2016. But there was a big change in turnout, likely tied to the different election date. While 5.1 million voted in 2016, the total votes recorded as of today is just 3.3 million. While this will go up as all the mail-in ballots are counted (and as full reports are provided on all of the precincts), it will certainly not go up to anywhere close to the 5.1 million of 2016.
C. The Ten States as a Whole
The chart at the top of this post reflects the figures added up across all of the ten states. And one finds that as with most of the states (where the few exceptions basically offset each other), the share of the vote Sanders and Warren together received in 2020 (38%) was very close to what Sanders alone received in 2016 (39%). The share of Sanders alone went down, with this offset almost exactly by the share Warren received. And this was despite a substantial increase in turnout – of 34% across the ten states as a group.
In terms of what has been called the “more moderate” wing, the share across the ten states of those voting for Clinton in 2016 was 59%. The share going to Biden plus Klobuchar plus Buttigieg plus Bloomberg in 2020 was 58%. Again almost the same.
With turnout up by a third, the Democratic primary electorate appears to be energized. There are real concerns about Trump, and what he has done to our country. But the higher turnout is not because Sanders is pulling in a large number of new voters who will vote for him and him only. Rather, the split in the new voters between those voting for Sanders or Warren on one side, or for Biden, Klobuchar, Buttigieg, or Bloomberg on the other side, is very close to the split between Sanders and Clinton voters in 2016.
With the withdrawal in the past week of all of the major remaining candidates other than Sanders and Biden, we will now see whether this pattern continues. It is now basically a two-person race, and the results should be clear to all.

You must be logged in to post a comment.