
 Fuel economy standards are certainly popular in the US, with recent polling indicating that 78% of the population (including 66% of Republicans) are in favor. The primary instrument that has been used for this has been the CAFE (Corporate Average Fuel Economy) standards, established by a law passed in 1975 for new cars to be sold starting in 1978. The original objective was to reduce petroleum use – and hence the import of oil into the US – following the shock of the 1973/74 oil crisis. More recently the objective has centered on reducing greenhouse gas emissions resulting from the burning of fossil fuels.
Fuel efficiency has certainly improved dramatically since the CAFE standards were established. And I want to be clear from the start that I am very much in favor of some such standards (although the CAFE system itself leaves much to be desired – it is riddled with provisions favoring special interests that undermine its effectiveness, but such issues merit a separate discussion). Fuel efficiency standards provide an incentive to improve performance (financial penalties are due when they are not met) and thus serve to guide the direction of technological change. But whether they in fact lead to less fuel being used overall (and hence fewer greenhouse gases being emitted) is not so clear. The cost to run your car is effectively cheaper – as the amount and hence the cost of the fuel you will burn will be less – and this makes driving your personal car more attractive than it would be otherwise. So you drive more.
On average, Americans certainly are now driving much more each year than they were in the early 1970s, as the chart at the top of this post shows. (The underlying data for the calculations came from estimates produced by the FHA and the EIA, and can be found in the National Transportation Statistics database of the US Department of Transportation.) Note that the curve for miles per gallon (as well as the other curves in the chart) are for the stock of all cars on the roads in the respective years – not just for new cars sold in that year.
There were certainly several factors behind the long-term trend of more miles being driven each year per person in the population, with the effective cost of fuel being just one. It will also depend on what has happened to real incomes (which, while stagnant since the 1970s for the bottom 90% of the population, have grown for the top 10%), the cost and availability of public transit alternatives, and other such factors.
But it is striking that the increase in miles driven per person in the population (the line in blue) has basically paralleled the rise in average fuel efficiency (the line in orange) over the last several decades. Hence the gallons of gasoline used per person (the line in red) has been basically flat. And from 2008 up to 2019 – just prior to the Covid disruptions – the miles driven per person and the average fuel efficiency had both grown by almost the same proportion, so the gallons of gas used per person were almost exactly the same as they were in 1970. That is, despite far greater fuel efficiency in the vehicles we drive, we are (as a nation) using the same gallons of gas (per person) as we did in 1970. The greater fuel efficiency did not lead to less gas being burned – nor to less greenhouse gases being emitted. (And I will address below the argument that the standards led to less fuel being burned “than would otherwise be the case”.)
The basic economics of this is really rather simple. Higher fuel standards might result in a higher up-front cost for a vehicle (with the emphasis on “might” – as it really depends on technological developments). But whether it does or does not affect the up-front costs, what matters in a decision on whether to drive on a particular day is the additional cost (what economists call the marginal cost) of driving that day. The up-front cost (if any) is a sunk cost that has already been incurred and will not affect the decision on whether or not to drive for some particular trip.
That decision, rather, will be affected by the marginal cost of driving that day, which depends primarily on the cost of the fuel. With the effective cost of the fuel reduced with a more fuel efficient vehicle, there will be a greater incentive to drive rather than use some alternative, thus offsetting – at least to some degree – what would have been saved in fuel by the higher standards. If a 10% improvement in fuel efficiency leads to 10% more miles being driven, there will be no overall reduction in fuel use at all.
How much of an increase will there be in miles driven for a given reduction in the effective cost of driving a car? While there have been efforts to try to estimate this, it is not easy to do. There are numerous factors one needs to take into account – such as what has happened to real incomes, the distribution of those incomes, the costs of alternatives, the social customs of the time, and more.
But one factor that is key that should be highlighted is the issue of time frame. In the very short run, if the price of gas should go up or down, you are unlikely to change your driving behavior by much if at all. Your car will be the same, and you will likely commute to work or school as you have been doing, make the number of shopping trips as you have been doing, and so on. But as the time frame lengthens, there might be some changes in your driving behavior. As more fuel efficient cars become available you may well decide it is worthwhile to purchase one (even if the up-front cost is higher). You may then decide to stop using public transit or carpools to go to work or school, but rather drive alone. You may decide to make more shopping trips by car, and to drive on holiday trips rather than fly to a destination. Over an even longer time frame of decades, you might decide to choose to buy a home that requires a longer commute. While further out from a city (or wherever you are employed), you may be able to buy a larger house in a more pleasant environment than you would be able to buy for the same price closer in.
That is, with a lower marginal cost of driving, one will make decisions that lead to more miles being driven each year. And that is what one sees in the chart. How much more is not clear, and it is almost certainly a coincidence that the proportional increases in the number of miles driven after 1970 were similar to the proportional gains in fuel efficiency in the period (and almost exactly the same in the 12 years from 2008 to 2019). But one should expect at least some offset due to the improved fuel efficiency, and over a period of decades possibly a very large offset. And that is what we observe.
As was noted above, some will argue that what matters is that the improved fuel efficiency will lead to less fuel being burned “than would otherwise be the case”. This would, of course, be true by definition if one takes as given that a certain number of miles will be driven each year regardless of fuel efficiency. But the issue is whether the number of miles being driven each year would have in fact been the same regardless of what happened to fuel efficiency. Almost certainly not, for the reasons noted above. It is not known with any certainty how large of an impact the improved fuel efficiency may have had on driving decisions – particularly over a time span of decades where many adjustments (such as where one will live) are possible. But it is unreasonable to assert there would have been no impact. And we do know from the data (as shown in the chart) that over time the gallons of gas burned per person were largely unchanged despite the dramatic gains in average fuel efficiency in the cars on the road.
So far we have only been looking at the relative impact the greater fuel efficiency will have on the effective cost of fueling a vehicle, relative to what it otherwise would have been in the period. But for changes over time – and how those might impact decisions on whether to drive or not – one should also look at how the fuel prices themselves changed:
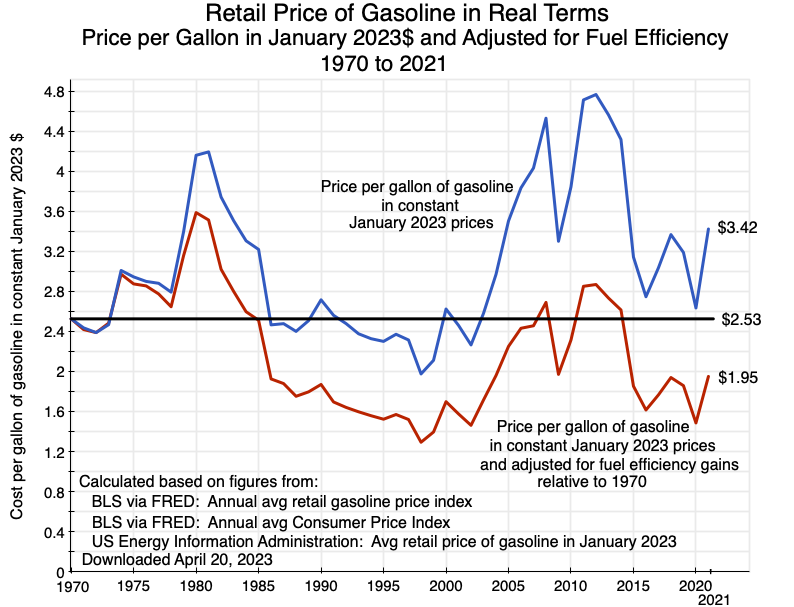
The top line in the chart (in blue) shows the average price per gallon of gasoline each year, as adjusted for general inflation based on the overall Consumer Price Index and expressed in terms of prices of January 2023. The figures are annual averages, and are the average retail prices of gasoline as estimated by the Bureau of Labor Statistics from the data it gathers for estimating the Consumer Price Index.
The average price per gallon in 1970 (in terms of the January 2023 overall price level) was $2.53 per gallon. It rose sharply in 1974 and again in 1979 and 1980 due to the oil embargoes of those periods, but then came down. Many may not realize that in real terms, the price of gasoline was usually below the (relatively low) level of 1970 from the mid-1980s through to 2003. It then rose to a peak in 2012 before falling again. The chart ends in 2021 as the data required for the 2022 calculations of fuel efficiency were not yet available, but the price of gasoline rose sharply in the first half of 2022 due to the Russian invasion of Ukraine, before falling back to earlier levels by the end of the year.
The lower line in the chart (in red) adjusts these prices per gallon for fuel to reflect the gains in average fuel efficiency for the cars on the road in those years, relative to 1970. Because of the fuel efficiency gains, that red curve will always be below the one in blue. And it becomes significant over time. By 2008 it was 40% lower than the price of fuel without an adjustment to reflect the efficiency gains, and was 43% lower than the unadjusted price as of 2021. This meant that as of 2021, the price effectively being paid for gas was $1.95 per gallon, rather than the $3.42 price per gallon paid at the pump (all expressed in terms of the overall price level of January 2023).
This effective cost of $1.95 per gallon in 2021 was not only 43% below the $3.42 price paid at the pump, but was also 23% below the price paid in 1970 of $2.53 per gallon. Of greater relevance – as it is the long term factors that matter most – is that the average price per gallon of fuel between 1986 and 2021 (and including the period of higher prices in the decade between 2004 and 2014) was $1.92 per gallon when adjusted for fuel efficiency rather than $3.03 when not adjusted (i.e. 37% less on average over the period). And this $1.92 per gallon was 24% less than the $2.53 per gallon cost of 1970.
Does this lower effective cost of fuel explain all of the increase in miles driven each year over this period? Probably not. But it was a factor, and one that should be recognized. Higher fuel efficiency standards are a good policy, but one needs to recognize that they will not translate one-for-one directly into less fuel being burned (and greenhouse gases being emitted). People will drive more, offsetting at least some of the gain.
This also has another implication that does not appear – from what I have seen – to be widely recognized. And that is that greater fuel efficiency, and hence a greater incentive to drive alone in your car on your commutes and for other trips rather than taking public transit or carpooling, will lead to greater road congestion. There will simply be more cars driving more miles on the limited roads we have when the marginal cost of driving your car is lower due to the greater fuel efficiency. This has almost certainly contributed to the greater road congestion we have seen in recent decades. As shown in the chart at the top of this post, the miles driven per person in 2019 (before the Covid crisis) was 74% higher than in 1970. Looking forward, as there are more electric battery cars on the roads with their extremely low marginal cost of operation (the cost of the electric power to charge the batteries is well below what the equivalent cost of gas would be), we should expect even more congestion. This is not to say that a switch to electric cars should in any way be discouraged. The benefits to the environment will be great if the electric power required comes from renewable sources such as solar or wind. But we should not ignore that the resulting low cost of driving on any given day will contribute to increased congestion issues in the years ahead.
Most importantly, the response of drivers to improved fuel efficiency needs to be recognized as we design the environmental regulations needed to address a warming planet and the resulting climate change. Burning fossil fuels is the major contributor to this warming and needs to fall. Higher fuel economy standards have been viewed as a good instrument to help with this. But once one takes into account that people can be expected to respond to the lower effective fuel costs by driving more, we need to recognize that this instrument will not be as effective as many assume. Higher fuel efficiency standards are still good. I am all in favor of them. But one should not expect that they will contribute as much as many might believe to what needs to be done to address climate change. Much more will be necessary.

You must be logged in to post a comment.