
 This will be just a brief post on a point that was central in the March 19 post on this blog on the need for the World Bank to rethink its strategy on climate change. It was argued there that while the cost, for example, to generate power from renewable sources might on average be higher than from fossil fuels (given the implicit subsidy to fossil fuels by not requiring such plants to pay for the damage they cause), one needs to recognize that there is in fact a range of costs around those averages. One should not simply focus on whatever the averages are and ignore the ranges. Costs and hence prices will vary a great deal around the averages, and in the conditions of a particular locale the cost of solar-generated power, for example, will often be less. Much can be achieved by the World Bank Group by focusing its efforts on ensuring those projects that are viable (meaning profitable) in their particular local conditions will be able to proceed.
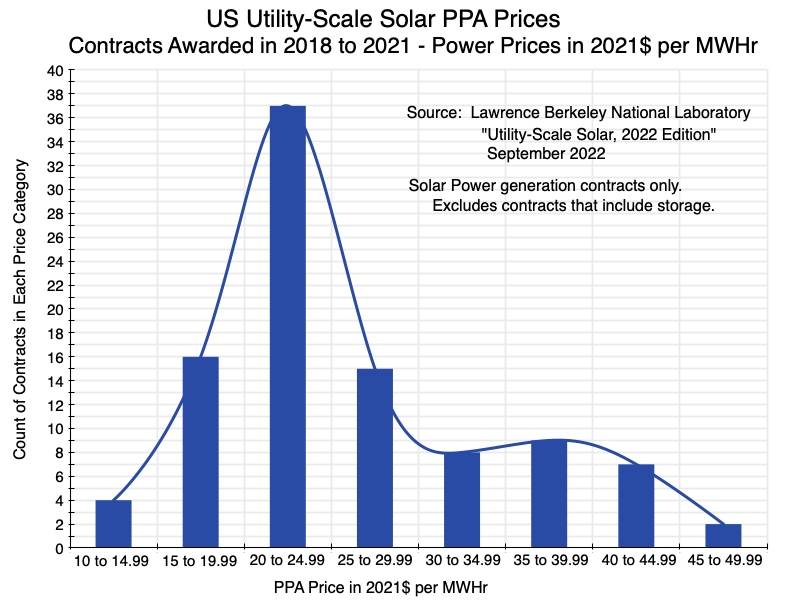
To illustrate this, the chart above shows the distribution of the price per megawatt-hour (MWHr), in constant 2021 dollars, that were bid in the power purchase agreement (PPA) contracts awarded for utility-scale solar projects in the United States in the years 2018 to 2021. The data on solar power generation costs are assembled each year by the Lawrence-Berkeley National Laboratory, with the data here from the 2022 report (released in September 2022). There were 98 such PPA contracts for solar power generation in those years (excluding contracts that also included a storage component, as their costs will vary widely depending on, among other factors, how much storage capacity would be provided).
Even though the US is a relatively well-integrated market, without the high degree of segmentation one would see in many developing countries, those PPA contract prices nonetheless varied widely. There were four contracts awarded in the price group of $10 to $14.99 per MWHr and two in the upper end group of $45 to $49.99 per MWHr (and in fact two others that I have excluded here: one for $59.40 and one for $158.50, where special factors probably played a role). The modal group was for $20 to $24.99 per MWhr, but only 37 of the 98 contracts (38%) had a price in that bracket.
Several points should be noted. First, the overall range is wide. Even excluding the two special cases at the upper end, the PPA prices varied by a factor of four between the lowest and highest groupings. Second, the prices are in fact all pretty low. The lowest was $11.64 per MWHr for a contract with an execution date of April 1, 2021, to provide a capacity of 150 MW. That cost corresponds to a price of 1.164 cents per kilowatt-hour (KWHr) – just over a penny. This is the amount that a provider chose to bid to cover their full cost of providing that energy, including the up-front capital cost of the solar plant plus whatever operational and maintenance costs they would then have for the life of their contract. And while 1.164 cents per KWHr is extremely low, even the price at the top of the range included in the chart (for a PPA contract with an execution date of January 15, 2021, for a 90 MW plant) was just $46.86 per MWHr (equivalent to 4.686 cents per KWHr). By way of comparison, the lifetime cost (in 2018) of a new coal-fired generation plant would have been (on average) almost $80 per MWHr and the average cost of a new gas-fired plant would have been about $45 per MWHr.
(And while some might note that the variation in the PPA prices might reflect, in part, that larger projects (in MW capacity) may have lower PPA prices bid, a simple regression of the MW size vs. the PPA prices finds an R-squared of less than 0.1. That is, more than 90% of the variation in the PPA prices cannot be explained by the MW size of the projects.)
It should be recognized that these PPA prices will reflect any subsidies received. But the main such subsidy in the US over this period was the Investment Tax Credit (ITC) for such projects. The Lawrence-Berkeley report estimated that without that subsidy, the leveled costs for the power would be about 22 to 23% higher (on average for the projects approved between 2018 and 2021). Even after marking up the prices by such an amount, the prices that were bid to provide such power were still very low – and generally still far below what the costs would have been from traditional, fossil-fuel fired, power plants.
But while such low prices for power from solar generation are interesting and important in themselves, the main point I wish to make here is that there is a wide range in those prices, even in a market as well integrated as that of the US. People often lose sight of the fact there is such a range when they compare prices of, for example, power generated from renewable sources to the cost from traditional, fossil-fuel fired, plants. They typically focus on the mean (average) prices rather than the ranges, and hence lose sight of the fact there while the average cost might well be higher in the comparison of one to the other, there will still often be circumstances where the relative cost in a particular locale was the reverse.
Diversity is important in economics. Indeed, it is central to how markets operate. It is critical not to ignore it.

You must be logged in to post a comment.