
The United States terribly bungled the introduction of testing for the virus that causes Covid-19, with a delay of more than a month during a critical time. Even now, the testing rate is still less than half that of a number of European countries (per unit of population). As a result, public health officials as well as regional hospitals have been “flying blind” as they try to manage their way through this crisis.
It is widely acknowledged that with the continued limitations on testing, the US is severely undercounting the number of Covid-19 cases in the country. But undercounting by how much? One can arrive at a rough estimate using the measured case fatality rates (which are based on the number of cases that have been confirmed by lab tests), and estimates of what the fatality rate is among all those infected by the virus (which is formally called the “infection fatality rate”). And the figures suggest that we may be undercounting the number of Covid-19 cases by a factor of perhaps six to nine. That is, the true number of Covid-19 cases in the US as of the evening of April 15 was not 633,000, but rather between 3.8 and 5.7 million. That is not a small difference, and provides an indication of how much better the US needs to get at testing if it is to be able to reopen the economy safely.
The method used here is based on aggregate numbers, which limits its precision. Hence the broad range given of six to nine. But only aggregate numbers are at this point publicly available. I would also emphasize that I am an economist (and know a bit of math) and not an epidemiologist. Estimates provided by epidemiologists using micro data sets that trace samples of individuals, will be far better than what can be provided here, and presumably such work is now underway. But for the purpose here, which is to arrive at a rough estimate of what the true Covid-19 case count might be in the US, the method should suffice.
The “case fatality rate” is simply the number of deaths from some disease divided by the number of cases of those that had the disease. Once an epidemic is over, with all cases known and resolved (either by the patients surviving, or not), this rate can be measured easily. But it is far more difficult to arrive at a good estimate during an epidemic. The number of cases may be rising exponentially, as are also the number of fatalities from the disease. But the fatalities occur with a lag. That is, as the disease runs its course over some period of time, the fatalities today will be linked to the number of those coming down with the disease some number of days earlier, not to the number of those who have been diagnosed with the disease as of today. Secondly, and importantly, it can be difficult to know during the course of the epidemic whether the number of cases that have been confirmed by some diagnostic test matches well or not the number of actual cases. No testing is universal, but there are different degrees of how adequate or inadequate it is.
To address the first issue, one can compare the number of fatalities today to what the number of confirmed cases were some number of days before. While there will be some distribution of the number of days between when symptoms are first observed and the death of those who will die from the disease, if that distribution does not vary over time then one can use a simple average for the number of days for this period. That distribution might start to lengthen once we have more effective therapies to treat those with Covid-19, but so far we do not.
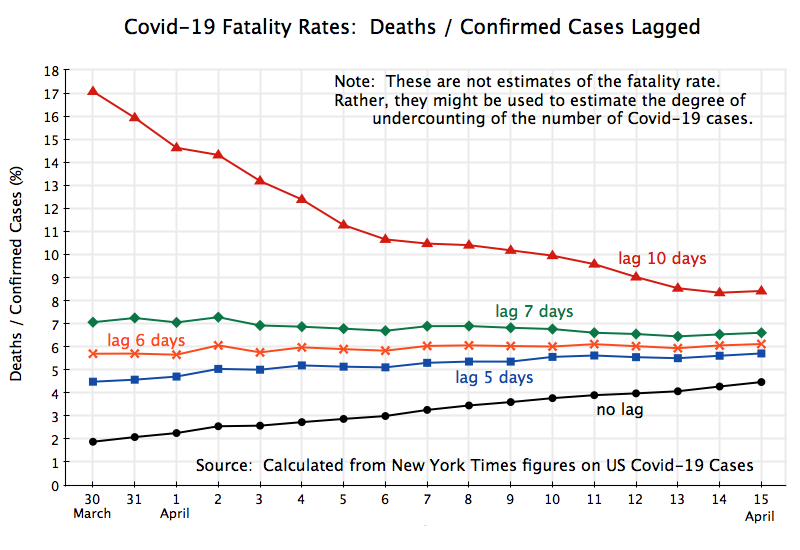
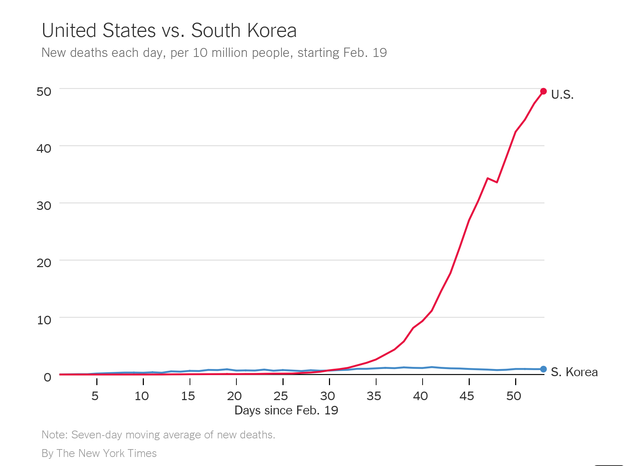
The chart at the top of this post then shows what the observed ratios were in the aggregate numbers for the US, between deaths from Covid-19 and confirmed cases with time lags of 10 days, 7 days, 6 days, 5 days, and none. These are all “case fatality rates”, where the no lag case (where the current total number of deaths is divided simply by the current total number of confirmed cases) is called the “naive case fatality rate”. The data comes from the data set assembled by The New York Times, which it is making available through GitHub.
The figures cover the period from March 30 (when the total number of fatalities first passed 3,000, and the number of confirmed cases totaled 163,000) to April 15 (when fatalities were almost ten times higher at 28.3 thousand, and the number of confirmed cases totaled 630,000). When there is no lag, with the number of total deaths as per some date divided by the total number of cases as of that same date, the curve (shown in black on the chart above) will be low in a situation where both cases and deaths are rising. And it will be rising as the growth rate of each slows (as we will discuss below) because then the number of deaths will more closely “catch up” with the number of confirmed cases.
At the opposite extreme, the curve in red in the chart of the ratio with a lag of ten days will be high (as current total deaths are calculated as a ratio to the number of cases of many days before, when the cases were much smaller), and will decline over time as the underlying growth rates (of cases and deaths) slow and there is again a “catch up”.
In the middle, a lag of six days leads to a ratio which is very close to constant, at about 6.0%. It fits well, but also suggests that since late March there has not been any working off of the backlog of untested cases. If, as we will discuss below, the infection fatality rate were around 1.0% or less (which appears to be the general consensus among the experts at this point), then that curve should be falling from 6% down towards 1%. It isn’t. The only alternative explanation would be that the US is in fact testing most of those who have caught the virus, and that the fatality rate from the disease is therefore in fact 6%. I do not believe that to be true (and it would be horrendous if it were), which implies not only that there has been substantial under-testing, but also that the margin of under-testing has not improved.
One might also question whether the six days for a lag that leads to a close fit in this data is too short given what is known about the disease. But it is consistent with how a “confirmed case” is recorded in the statistics. It is always based on a lab test for the virus that causes Covid-19, and these tests are only given to patients after they show symptoms (and for many, after possible other causes of those symptoms are ruled out). But when someone comes down with symptoms, there will always be some lag, on the order of perhaps 2 to 4 days between when the symptoms start and when they seek a test. There may then be a delay of another day or two before the test is taken. There will then be another delay between when the test is taken and when the results are found. Due to the bungled roll-out of testing in the US, these delays have been as long as 9 days (at least in the Washington, DC, area). Finally, the case is only recorded as a confirmed case to be added to the national statistics on the day the test result is made available, not on the day the test was taken. A death, when it occurs, is then on average some number of days after that.
A six-day lag found in the data between when cases are confirmed and death occurs (in those cases where it is fatal) is therefore consistent with an estimate (from an article published in The Lancet) that the mean time between when symptoms first appear and death was 17.8 days for those who died.
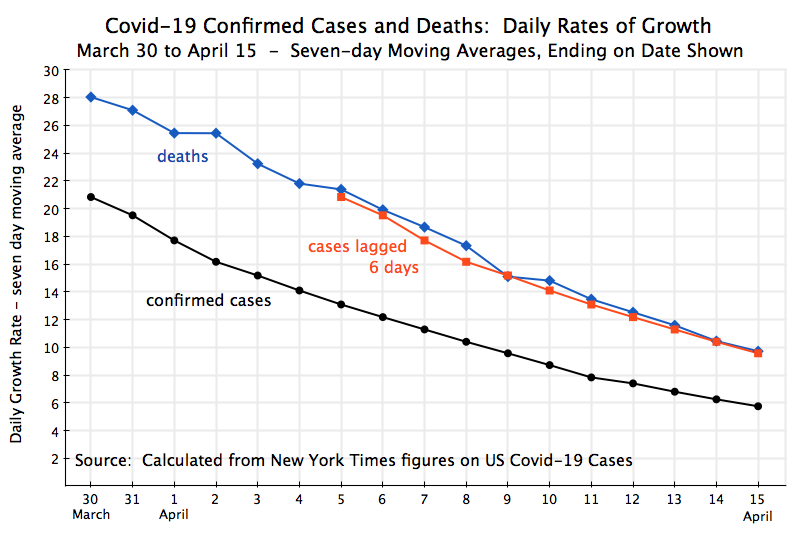
Another way to look at this relationship is in terms of the growth rates:
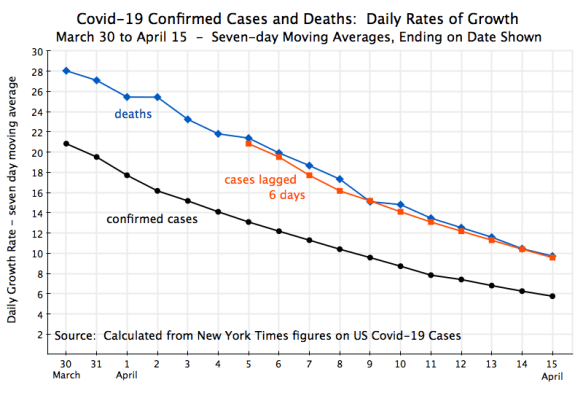
Here I have only included the curves for the rates (expressed in growth rates per day, but on a seven-day moving average ending on the date shown) for total confirmed cases, for total deaths, and for the confirmed cases lagged by six days. They have all fallen substantially over this period, which is of course critically important to the nation – exponential growth at such rates would be disastrous if they did not fall and fall quickly. And one sees that the daily growth in the number of deaths follows very closely to what the daily growth had been in total confirmed cases six days before.
This falling curves also indicate that social distancing has worked. Social distancing measures were only put into force starting in mid-March, and were then often substantially strengthened over the next week or two as state and local officials saw the number of Covid-19 cases exploding. By the last week of March the growth in the total number of confirmed cases had then begun to decline (the peak growth rate was 38% a day in the seven-day period ending March 23), with this then falling to 21% a day for the seven-day period ending March 30, and the rest then as shown in the chart. The growth in the number of deaths then fell similarly, but with a six-day lag.
What does this then imply for the actual number of Covid-19 cases in the US? As noted above, assuming a six-day lag between when a case is recorded as “confirmed” and when those who will die for the disease do die, leads to a ratio of 6.0% between the number of deaths and number of confirmed cases (six days before). And also as noted before, the general consensus among epidemiologists, based on what is now known, is that the fatality rate for all those who come down with Covid-19 may be around 1.0% or less. A good deal of work is underway to try to estimate this better, but it is still early. One careful estimate, part of the same article published in The Lancet cited before, is that the rate is 0.66%.
Using the 1.0% and 0.66% estimates as a range for what the fatality rate might be for all those who come down with Covid-19, why does the data indicate a ratio of 6.0% in what is observed? The answer has to be that testing is not capturing a high share of those with the infection. And while it is not surprising that in the middle of a pandemic the number of cases is being underestimated, what is surprising and significant is the degree of that underestimation for the virus that causes Covid-19. If the true fatality rate of all those who have the disease is 1.0%, the implication of the 6.0% ratio observed is that the true number of cases in the US is six times higher than what is currently estimated. And if the true fatality rate is 0.66%, then the true number of cases is nine times higher. With 633,000 cases as of April 15, that implies the true number of cases is between 3.8 and 5.7 million.
There is both good news and bad news in this. The good news is that a high share of those infected with the virus may be suffering such mild symptoms (and possibly no symptoms at all) that they do not feel compelled to call a doctor and have a test. However, with the continued limitations on testing availability there are also many not being tested who clearly should be. The sum of these two groups together can be easily calculated from the figures. Simple shares would indicate that those not being tested would be in the range of 83 to 89% of all those infected. Most of these are probably in the category of those exhibiting mild or even no symptoms, but we will not know how large that share is until the US is testing all those with any symptoms.
The bad news, however, is that those with mild or even no symptoms appear able to pass on the virus to others. And the person catching the virus from that individual may then suffer severe symptoms. It all depends on the individual – their genes, age, health condition, and other such factors.
This means that carrying out the testing to identify infected individuals will be far more difficult than would be the case if symptoms were always clear. But until vaccines are available or effective therapeutics have been developed, there really is no alternative to the traditional public health measures of identification of those infected, isolating those with the disease, tracing all the contacts of those thus identified, and then quarantining all those contacts until it is clear whether or not they have caught the virus. This will be difficult when a substantial share of those with the disease do not manifest clear symptoms, but is not impossible. Those who have caught the virus got it from someone, and good public health work can often find them.
This would have been far easier to do if action had been taken immediately, in January, when it was clear that what had happened in Wuhan was serious (one does not impose a full lockdown on a city of 11 million if is it not serious) and the WHO was issuing a series of increasingly urgent warnings (starting from January 5). Trump, in contrast, famously asserted on January 22, in an interview while at the Davos meetings in Switzerland, that he was not concerned about the virus – that “We have it totally under control”. He also boasted of having “a great relationship with President Xi” of China, with no problem in cooperation with China on the virus. “The relationship is very good”, Trump said.
If action had been taken in January or even early February, the US would only have had to deal with on the order of dozens of cases a day. Identification, isolation, tracing of contacts, and quarantining then would have been far easier than what will now be necessary, when confirmed new cases since April 2 have averaged 30,000 per day.
Social distancing has worked in bringing the growth rate in new cases down to single digits and, with a lag, to a similar slowdown in the growth in fatalities. But it has been achieved only with an effective shutting down of the economy, with an unemployment rate that is probably now the highest it has been since the Great Depression (we will find out when the April figure is reported at the end of the month). Trump’s refusal until mid-March to see Covid-19 as the serious threat that it is has come at a tremendous cost.
============================================
Update: April 18, 2020
After I put up this post yesterday, I came across two reports with figures that are broadly consistent with the findings of the analysis.
There are two components leading to undertesting. One is that a substantial share of those with the symptoms of Covid-19 are not being tested in the US. The second is that a substantial share of those carrying the virus are asymptomatic or only mildly symptomatic, and hence do not seek a test (or qualify for a test due to the current limits on testing). However, those carrying the virus can still spread it to others, even if they are asymptomatic.
The two reports are of analyses where they could test 100% of an isolated population, and then see among all those testing positive what share were asymptomatic. One report was on testing of the 4,800 sailors on the US Navy aircraft carrier Theodore Roosevelt. Of the 600 sailors who tested positive, roughly 60% did not show symptoms of Covid-19. If one assumes that those showing no symptoms would not have otherwise been tested, and that perhaps half of those exhibiting symptoms would not have been tested (in the US testing as it is being carried out now), then 80% of those with the virus would not be recorded in the US as a “confirmed case”.
The figure of one-half not seeking a test is, of course, a pure guess, but is not necessarily unreasonable. If your symptoms are there but moderate (keep in mind that about 80% of the confirmed cases do not require hospitalization – they stay home instead where they self-monitor), it might well be rational for many individuals not to seek a test unless their condition worsens. Not only do you have to find a testing location, but you will likely need to line up and wait, and stay relatively close to a large number of individuals who are there precisely because they think they have the disease. There may also be insurance issues, even though the tests are in principle supposed now to be free to the individual.
The other report was on the testing of all 3,000 individuals in an isolated village in Northern Italy. It found that 50 to 75% of those who tested positive were asymptomatic (why there is a range on this is not clear to me). They then isolated those who tested positive (88 individuals), and the number of those sick in the village from Covid-19 fell to seven in less than 10 days. Hence isolation works well if you can identify all those carrying the virus. If the share asymptomatic was 50%, and one then assumes that only half of those with symptoms would be tested (under US conditions), then the share of confirmed cases would be just 25% of actual cases. And if the share asymptomatic was 75%, with half of those with symptoms being tested, then the share of confirmed cases would be just 12.5% of actual cases.
There are limitations, of course, to these analyses. The samples are not all that large, they are special populations (sailors who are mostly male and mostly aged between 20 and 50, or those living in an isolated village in Italy, where the share elderly may be high), plus the tests were all done at one point in time. Those asymptomatic at the time of the test may have started to come down with obvious symptoms a few days later. But while this might apply to some, it is also clear from this and other work that many of those with the disease, but who were tested for some reason (most likely as part of the process of tracing and testing the contacts of those who came down with the disease) never exhibit outward symptoms.
All this suggests that current testing in the US is only capturing a small share of those with the disease.


You must be logged in to post a comment.