Impact of the 1994 Assault Weapons Ban on Mass Shootings: An Update, Plus What To Do For a Meaningful Reform

A.  Introduction

An earlier post on this blog (from January 2013, following the horrific shooting at Sandy Hook Elementary School in Connecticut), looked at the impact of the 1994 Federal Assault Weapons Ban on the number of (and number of deaths from) mass shootings during the 10-year period the law was in effect.  The data at that point only went through 2012, and with that limited time period one could not draw strong conclusions as to whether the assault weapons ban (with the law as written and implemented) had a major effect.  There were fewer mass shootings over most of the years in that 1994 to 2004 period, but 1998 and 1999 were notable exceptions.

There has now been another horrific shooting at a school – this time at Marjory Stoneman Douglas High School in Parkland, Florida.  There are once again calls to limit access to the military-style semiautomatic assault weapons that have been used in most of these mass shootings (including the ones at Sandy Hook and Stoneman Douglas).  And essentially nothing positive had been done following the Sandy Hook shootings.  Indeed, a number of states passed laws which made such weapons even more readily available than before.  And rather than limiting access to such weapons, the NRA response following Sandy Hook was that armed guards should be posted at every school.  There are, indeed, now more armed guards at our schools.  Yet an armed guard at Stoneman Douglas did not prevent this tragedy.

With the passage of time, we now have five more years of data than we had at the time of the Sandy Hook shooting.  With this additional data, can we now determine with more confidence whether the Assault Weapons Ban had an impact, with fewer shootings incidents and fewer deaths from such shootings?

This post will look at this.  With the additional five years of data, it now appears clear that the 1994 to 2004 period did represent a change in the sadly rising trend, with a reduction most clearly in the number of fatalities from and total victims of those mass shootings.  This was true even though the 1994 Assault Weapons Ban was a decidedly weak law, with a number of loopholes that allowed continued access to such weapons for those who wished to obtain them.  Any new law should address those loopholes, and I will discuss at the end of this post a few such measures so that such a ban would be more meaningful.

B.  The Number of Mass Shootings by Year

The Federal Assault Weapons Ban (formally the “Public Safety and Recreational Firearms Use Protection Act”, and part of a broader crime control bill) was passed by Congress and signed into law on September 13, 1994.  The Act banned the sale of any newly manufactured or imported “semiautomatic assault weapon” (as defined by the Act), as well as of newly manufactured or imported large capacity magazines (holding more than 10 rounds of ammunition).  The Act had a sunset provision where it would be in effect for ten years, after which it could be modified or extended.

However, it was a weak ban, with many loopholes.  First of all, there was a grandfather clause that allowed manufacturers and others to sell all of their existing inventory.  Not surprisingly, manufacturers scaled up production sharply while the ban was being debated, as those inventories could later then be sold, and were.  Second and related to this, there was no constraint on shops or individuals on the sale of weapons that had been manufactured before the start date, provided just that they were legally owned at the time the law went into effect.  Third, “semiautomatic assault weapons” (which included handguns and certain shotguns, in addition to rifles such as the AR-15) were defined quite precisely in the Act.  But with that precision, gun manufacturers could make what were essentially cosmetic changes, with the new weapons then not subject to the Act.  And fourth, with the sunset provision after 10 years (i.e. to September 12, 2004), the Republican-controlled Congress of 2004 (and President George W. Bush) simply could allow the Act to expire, with nothing done to replace it.  And they did.

The ban was therefore weak.  But it is still of interest to see whether even such a weak law might have had an impact on the number of, and severity of, mass shootings during the period it was in effect.

The data used for this analysis were assembled by Mother Jones, the investigative newsmagazine and website.  The data are available for download in spreadsheet form, and is the most thorough and comprehensive such dataset publicly available.  Sadly, the US government has not assembled and made available anything similar.  A line in the Mother Jones spreadsheet is provided for each mass shooting incident in the US since 1982, with copious information on each incident (as could be gathered from contemporaneous news reports) including the weapons used when reported.  I would encourage readers to browse through the spreadsheet to get a sense of mass shootings in America, the details of which are all too often soon forgotten.  My analysis here is based on various calculations one can then derive from this raw data.

This dataset (through 2012) was used in my earlier blog post on the impact of the Assault Weapons Ban, and has now been updated with shootings through February 2018 (as I write this).  To be included, a mass shooting incident was defined by Mother Jones as a shooting in a public location (and so excluded incidents such as in a private home, which are normally domestic violence incidents), or in the context of a conventional crime (such as an armed robbery, or from gang violence), and where at least four people were killed (other than the killer himself if he also died, and note it is almost always a he).  While other possible definitions of what constitutes a “mass shooting” could be used, Mother Jones argues (and I would agree) that this definition captures well what most people would consider a “mass shooting”.  It only constitutes a small subset of all those killed by guns each year, but it is a particularly horrific set.

There was, however, one modification in the updated file, which I adjusted for.  Up through 2012, the definition was as above and included all incidents where four or more people died (other than the killer).  In 2013, the federal government started to refer to mass shootings as those events where three or more people were killed (other than the killer), and Mother Jones adopted this new criterion for the mass shootings it recorded for 2013 and later.  But this added a number of incidents that would not have been included under the earlier criterion (of four or more killed), and would bias any analysis of the trend.  Hence I excluded those cases in the charts shown here.  Including incidents with exactly three killed would have added no additional cases in 2013, but one additional in 2014, three additional in 2015, two additional in 2016, and six additional in 2017 (and none through end-February in 2018).  There would have been a total of 36 additional fatalities (three for each of the 12 additional cases), and 80 additional victims (killed and wounded).

What, then, was the impact of the assault weapons ban?  We will first look at this graphically, as trends are often best seen by eye, and then take a look at some of the numbers, as they can provide better precision.

The chart at the top of this post shows the number of mass shooting events each year from 1982 through 2017, plus for the events so far in 2018 (through end-February).  The numbers were low through the 1980s (zero, one, or two a year), but then rose.  The number of incidents per year was then generally less during the period the Assault Weapons Ban was in effect, but with the notable exceptions of 1998 (three incidents) and especially 1999 (five).  The Columbine High School shooting was in 1999, when 13 died and 24 were wounded.

The number of mass shootings then rose in the years after the ban was allowed to expire.  This was not yet fully clear when one only had data through 2012, but the more recent data shows that the trend is, sadly, clearly upward.  The data suggest that the number of mass shooting incidents were low in the 1980s but then began to rise in the early 1990s; that there was then some fallback during the decade the Assault Weapons Ban was in effect (with 1998 and 1999 as exceptions); but with the lifting of the ban the number of mass shooting incidents began to grow again.  (For those statistically minded, a simple linear regression for the full 1982 to 2017 period indicates an upward trend with a t-statistic of a highly significant 4.6 – any t-statistic of greater than 2.0 is generally taken to be statistically significant.)

C.  The Number of Fatalities and Number of Victims in Mass Shooting Incidents 

These trends are even more clear when one examines what happened to the total number of those killed each year, and the total number of victims (killed and wounded).

First, a chart of fatalities from mass shootings over time shows:


Fatalities fluctuated within a relatively narrow band prior to 1994, but then, with the notable exception of 1999, fell while the Assault Weapons Ban was in effect.  And they rose sharply after the ban was allowed to expire.  There is still a great deal of year to year variation, but the increase over the last decade is clear.

And for the total number of victims:


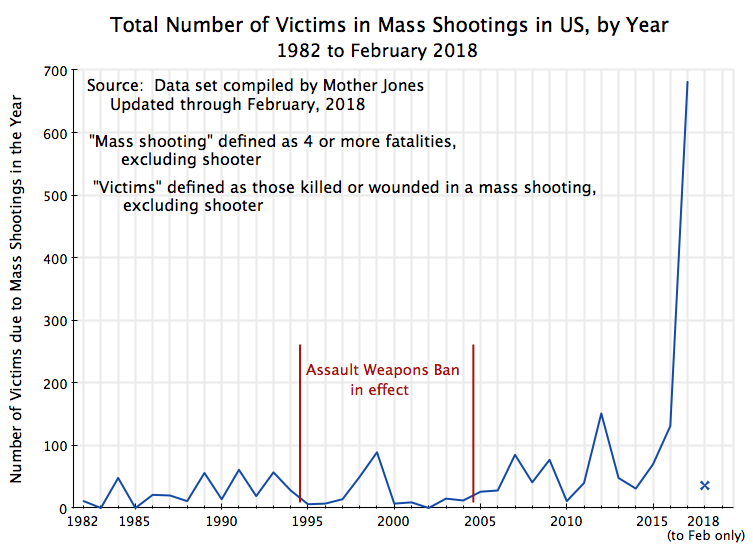
One again sees a significant reduction during the period the Assault Weapons Ban was in effect (with again the notable exception of 1999, and now 1998 as well).  The number of victims then rose in most years following the end of the ban, and went off the charts in 2017.  This was due largely to the Las Vegas shooting in October, 2017, where there were 604 victims of the shooter.  But even excluding the Las Vegas case, there were still 77 victims in mass shooting events in 2017, more than in any year prior to 2007 (other than 1999).

D.  The Results in Tables

One can also calculate the averages per year for the pre-ban period (13 years, from 1982 to 1994), the period of the ban (September 1994 to September 2004), and then for the post-ban period (again 13 years, from 2005 to 2017):

Number of Mass Shootings and Their Victims – Averages per Year

Avg per Year

Shootings

Fatalities

Injured

Total Victims

1982-1994

1.5

12.4

14.2

26.6

1995-2004

1.5

9.6

10.1

19.7

2005-2017

3.8

38.6

71.5

110.2

Note:  One shooting in December 2004 (following the lifting of the Assault Weapons Ban in September 2004) is combined here with the 2005 numbers.  And the single shooting in 1994 was in June, before the ban went into effect in September.

The average number of fatalities per year, as well as the number injured and hence the total number of victims, all fell during the period of the ban.  They all then jumped sharply once the ban was lifted.  While one should acknowledge that these are all correlations in time, where much else was also going on, these results are consistent with the ban having a positive effect on reducing the number killed or wounded in such mass shootings.

The number of mass shootings events per year also stabilized during the period the ban was in effect (at an average of 1.5 per year).  That is, while the number of mass shooting events was the same (per year) as before, their lethality was less.  Plus the number of mass shooting events did level off, and fell back if one compares it to the previous half-decade rather than the previous 13 year period.  They had been following a rising trend before.  And the number of mass shootings then jumped sharply after the ban was lifted.

The data also allow us to calculate the average number of victims per mass shooting event, broken down by the type of weapon used:

Average Number of Victims per Mass Shooting, by Weapon Used

Number of Shootings

Fatalities

Injured

Total Victims

Semiauto Rifle Used

26

13.0

34.6

47.6

Semiauto Rifle Not Used

59

7.5

5.6

13.1

Semiauto Handgun Used

63

10.0

17.5

27.5

Semiauto Handgun (but Not Semiautomatic Rifle) Used

48

7.7

6.0

13.7

No Semiauto Weapon Used

11

6.6

4.0

10.6

There were 26 cases where the dataset Mother Jones assembled allowed one to identify specifically that a semiautomatic rifle was used.  (Some news reports were not clear, saying only that a rifle was used.  Such cases were not counted here.)  This was out of a total of 85 mass shooting events where four or more were killed.  But the use of semiautomatic rifles proved to be especially deadly.  On average, there were 13 fatalities per mass shooting when one could positively identify that a semiautomatic rifle was used, versus 7.5 per shooting when it was not.  And there were close to 48 total victims per mass shooting on average when a semiautomatic rifle was used, versus 13 per shooting when it was not.

The figures when a semiautomatic handgun was used (from what could be identified in the news reports) are very roughly about half-way between these two.  But note that there is a great deal of overlap between mass shootings where a semiautomatic handgun was used and where a semiautomatic rifle was also used.  Mass shooters typically take multiple weapons with them as they plan out their attacks, including semiautomatic handguns along with their semiautomatic rifles.  The fourth line in the table shows the figures when a semiautomatic handgun was used but not also a semiautomatic rifle.  These figures are similar to the averages in all of the cases where a semiautomatic rifle was not used (the second line in the table).

The fewest number of fatalities and injured are, however, when no semiautomatic weapons are used at all.  Unfortunately, in only 11 of the 85 mass shootings (13%) were neither a semiautomatic rifle nor a semiautomatic handgun used.  And these 11 might include a few cases where the news reports did not permit a positive identification that a semiautomatic weapon had been used.

E.  What Would Be Needed for a Meaningful Ban

It thus appears that the 1994 Assault Weapons Ban, as weak as it was, had a positive effect on saving lives.  But as noted before, it was flawed, with a number of loopholes which meant that the “ban” was far from a true ban.  Some of these might have been oversights, or issues only learned with experience, but I suspect most reflected compromises that were necessary to get anything approved by Congress.  That will certainly remain an issue.

But if one were to draft a law addressing these issues, what are some of the measures one would include?  I will make a few suggestions here, but this list should not be viewed as anything close to comprehensive:

a)  First, there should not be a 10-year (or any period) sunset provision.  A future Congress could amend the law, or even revoke it, as with any legislation, but this would then require specific action by that future Congress.  But with a sunset provision, it is easy simply to do nothing, as the Republican-controlled Congress did in 2004.

b)  Second, with hindsight one can see that the 1994 law made a mistake by defining precisely what was considered a “semiautomatic” weapon.  This made it possible for manufacturers later to make what were essentially cosmetic changes to the weapons, and then make and sell them.  Rather, a semiautomatic weapon should be defined in any such law by its essential feature, which is that one can fire such a weapon repeatedly simply by pulling the trigger once for each shot, with the weapon loading itself.

c)  Third, fully automatic weapons (those which fire continuously as long as the trigger is pulled) have been banned since 1986 (if manufactured after May 19, 1986, the day President Reagan signed this into law).  But “bump stocks” have not been banned.  Bump stocks are devices that effectively convert a semiautomatic weapon into a fully automatic one.  Following the horrific shooting in Las Vegas on October 1, 2017, in which 58 were killed and 546 injured, and where the shooter used a bump stock to convert his semiautomatic rifles (he had many) into what were effectively fully automatic weapons, there have been calls for bump stocks to be banned.  This should be done, and indeed it is now being recognized that a change in existing law is not even necessary.  Attorney General Jeff Sessions said on February 27 that the Department of Justice is re-examining the issue, and implied that there would “soon” be an announcement by the department of regulations that recognize that a semiautomatic weapon equipped with a bump stock meets the definition of a fully automatic weapon.

d)  Fourth, a major problem with the 1994 Assault Weapons Ban, as drafted, was it only banned the sale of newly manufactured (or imported) semiautomatic weapons from the date the act was signed into law – September 13, 1994.  Manufacturers and shops could sell legally any such weapons produced before then.  Not surprisingly, manufacturers ramped up production (and imports) sharply in the months the Act was being debated in Congress, which provided then an ample supply for a substantial period after the law technically went into effect.

But one could set an earlier date of effectiveness, with the ban covering weapons manufactured or imported from that earlier date.  This is commonly done in tax law.  That is, tax laws being debated during some year will often be made effective for transactions starting from the beginning of the year, or from when the new laws were first proposed, so as not to induce negative actions designed to circumvent the purpose of the new law.

e)  Fifth, the 1994 Assault Weapons Ban allowed the sale to the public of any weapons legally owned before the law went into effect on September 13, 1994 (including all those in inventory).  This is related to, but different from, the issue discussed immediately above.  The issue here is that all such weapons, including those manufactured many years before, could then be sold and resold for as long as those weapons existed.  This could continue for decades.  And with millions of such weapons now in the US, it would be many decades before the supply of such weapons would be effectively reduced.

To accelerate this, one could instead create a government-funded program to purchase (and then destroy) any such weapons that the seller wished to dispose of.  And one would couple this with a ban on the sale of any such weapons to anyone other than the government.  There could be no valid legal objection to this as any sales would be voluntary (although I have no doubt the NRA would object), and would be consistent with the ban on the sale of any newly manufactured semiautomatic weapon.  One would also couple this with the government buying the weapons at a generous price – say the original price paid for the weapon (or the list price it then had), without any reduction for depreciation.

Semiautomatic weapons are expensive.  An assault rifle such as the AR-15 can easily cost $1,000.  And one would expect that as those with such weapons in their households grow older and more mature over time, many will recognize that such a weapon does not provide security.  Rather, numerous studies have shown (see, for example, here, here, here, and here) that those most likely to be harmed by weapons in a household are either the owners themselves or their loved ones.  As the gun owners mature, many are likely to see the danger in keeping such weapons at home, and the attractiveness of disposing of them legally at a good price.  Over time, this could lead to a substantial reduction in the type of weapons which have been used in so many of the mass shootings.

F.  Conclusion

Semiautomatic weapons are of no use in a civilian setting other than to massacre innocent people.  They are of no use in self-defense:  One does not walk down the street, or while shopping in the aisles of a Walmart or a Safeway, with an AR-15 strapped to your back.  One does not open the front door to your house each time the doorbell rings aiming an AR-15 at whoever is there.  Nor are such weapons of any use in hunting.  First, they are not terribly accurate.  And second, if one succeeded in hitting the animal with multiple shots, all one would have is a bloody mess.

Such weapons are used in the military precisely because they are good at killing people.  But for precisely the same reason as fully automatic weapons have been banned since 1986 (and tightly regulated since 1934), semiautomatic weapons should be similarly banned.

The 1994 Assault Weapons Ban sought to do this.  However, it was allowed to expire in 2004.  It also had numerous loopholes which lessened the effectiveness it could have had.  Despite this, the number of those killed and injured in mass shootings fell back substantially while that law was in effect, and then jumped after it expired.  And the number of mass shooting events per year leveled off or fell while it was in effect (depending on the period it is being compared to), and then also jumped once it expired.

There are, however, a number of ways a new law banning such weapons could be written to close off those loopholes.  A partial list is discussed above.  I fully recognize, however, that the likelihood of such a law passing in the current political environment, where Republicans control both the Senate and the House as well as the presidency, are close to nil.  One can hope that at some point in the future the political environment will change to the point where an effective ban on semiautomatic weapons can be passed.  After all, President Reagan, the hero of Republican conservatives, did sign into law the 1986 act that banned fully automatic weapons.  Sadly, I expect many more school children will die from such shootings before this will happen.

Delusional: Is This What We Are to Expect from the New Trump Administration?

Definition of delusional in English:

delusional

ADJECTIVE

Characterized by or holding idiosyncratic beliefs or impressions that are contradicted by reality or rational argument, typically as a symptom of mental disorder:

‘hospitalization for schizophrenia and delusional paranoia’

‘he was diagnosed with a delusional disorder’

 Based on or having faulty judgement; mistaken:

‘their delusional belief in the project’s merits never wavers’

‘I think the guy is being a bit delusional here’


Donald J. Trump was inaugurated as President of the United States at 12:00 noon on January 20.  A day later, his new White House Press Secretary and Communications Director Sean Spicer in his very first press briefing of the new administration, launched a tirade against the press, for reporting (falsely he claimed) that attendance at the inauguration was less than the number who had attended Obama’s inauguration in 2009 (or indeed any prior inauguration). And he was visibly angry about this, as can be seen both in the transcript of the press briefing, and in a video of it.  He charged that “some members of the media were engaged in deliberately false reporting” and claimed that “This was the largest audience to ever witness an inauguration — period — both in person and around the globe.”

Furthermore, after many reports challenged Spicer’s assertions, the new administration doubled down on the charges.  Reince Priebus, the new White House Chief of Staff, vowed on Sunday that the new administration will fight the media “tooth and nail every day and twice on Sunday” over what they see as unfair attacks on Trump (by claiming, falsely they say, that the crowds had been larger at Obama’s inauguration).  And Kellyanne Conway, a spokesman for the White House and Counselor to the President, said on Sunday that what Press Secretary Spicer had asserted was not wrong but rather “alternative facts”.

Finally, one has Donald Trump himself, who claimed that he saw what “looked like a million, a million and a half people” present at his inauguration as he took the oath of office. One does not know how he was able to make such a count, and perhaps he should not be taken too seriously, but his administration’s senior staff appear to be obliged to back him up.

What do we know on the size of the crowds?  One first has to acknowledge that any crowd count is difficult, and that we will never know the precise numbers.  Unless each person has been forced to pass through a turnstile, all we can have are estimates.  But we can have estimates, and they can give some sense as to the size.  Most importantly, while we might not know the absolute size, we can have a pretty good indication from photos and other sources of data what the relative sizes of two crowds likely were.

So what do we know from photos?  Here we have a side-by-side photo (taken at Obama’s first inauguration and then at Trump’s) from the top of the Washington Monument, of the crowd on the Mall witnessing the event.  They were both taken at about the same time prior to the noon swearing-in of the new president, where the ceremony starts at 11:30:


inaugeration-attendance-2017-vs-2009


The crowd in 2017 is clearly far smaller.  This has nothing to do with the white mats laid down to protect the grass (which was also done in 2013 for Obama’s second inauguration).  There are simply far fewer attendees.

There is also indirect evidence from the number of Metrorail riders that day.  Spicer said in his press briefing “We know that 420,000 people used the D.C. Metro public transit yesterday, which actually compares to 317,000 that used it for President Obama’s last inaugural.”  Actually these numbers are wrong, as well as misleading (since the comparison at issue is to Obama’s first inauguration in 2009, not to his second in 2013). As the Washington Post noted (with this confirmed by CNN) the correct numbers from the Washington Metropolitan Area Transit Authority (which operates the Metro system) are that there were 570,500 riders on Metro on Trump’s inauguration day, 1.1 million riders in 2009 on Obama’s first inauguration day, and 782,000 riders in 2013 on Obama’s second inauguration day.  What Trump’s press secretary said “we know” was simply wrong.

It is also simply not true that Trump drew a larger estimated TV audience than any president before.  Nielsen, the TV ratings agency, estimated that Trump drew 30.6 million viewers, while Obama drew 38 million viewers at his first inauguration.  And Reagan drew more, at 42 million viewers, for his first inauguration.  Furthermore, both Nixon (in 1973) and Carter (in 1977) drew more viewers than Trump, at 33 million and 34 million respectively. The Trump figure was far from a record.

So how many people attended Trump’s inauguration, and how does that figure compare to the number that Obama drew for his first inauguration?  A widely cited figure is that Obama drew an estimated 1.8 million for his first inauguration, but, as noted above, any such estimate must be taken as approximate.  But based on a comparison of the photos, experts estimate that Trump drew at most one-third of the Obama draw in terms of the number in attendance just on the Mall.  There were in addition many others at the Obama inaugural who were not on the Mall because they could not fit due to the crowding.

Why does this matter?  It matters only because the new Trump administration has made it into an issue, and in doing so, has made assertions that are clearly factually wrong.  Trump did not draw a record number to his inauguration, nor a record number of viewers, nor were there a record number of riders on the Washington Metro system.  These are all numbers, and they can be checked.  While we may not be able to know the precise number of those who attended, we can come to a clear conclusion on the relative size of those who attended this year versus previous recent inaugurations.  And Trump’s attendance was not at all close to the number who attended Obama’s first inaugural.

What is disconcerting is that Trump, his new Press Secretary, his Chief of Staff and others in his administration, should feel compelled to make assertions that are clearly and verifiably wrong, and then to attack the press aggressively for pointing out what we know. And this on his second day in office.  While this is not inconsistent with what the Trump team did during his campaign for the presidency, one would have hoped for more mature behavior once he took office.  And especially so for an issue which is fundamentally minor. It really does not matter much whether the number attending Trump’s inauguration was more or less than the number who had attended prior inaugurations.

Presumably (and assuming thought was given to this) they are setting a marker for what they intend to do during the course of the presidential term, with aggressive attacks on the press for reporting errors in their assertions or on contradictions with earlier statements.  If so, such a strategy, including denial of facts that can readily be verified, is truly worrisome. Facts should matter.  Not all that we will hear from the new administration will be so easy to check, and the question then is what can be believed.

Perhaps, and more worrying, they really believe their assertions on the numbers attending. If so, they are truly delusional.

Why It Is Important to Vote This November 8

trump-and-clinton-picture2-001

There is little need to repeat here the many reasons why the election of Donald Trump to the presidency (or indeed any position of authority) would be a disaster.  He has eminently disqualified himself by both his words and his actions, and I have little to add.  And there are many reasons why Hillary Clinton should be elected, not simply in order not to elect Trump.  Even her critics admit that she has the background and experience in both the executive and legislative branches of government – as First Lady (with an active role in policy discussions), as Senator from New York, and as Secretary of State for four years under President Obama –  that few candidates for the presidency could match.

Furthermore, even Donald Trump has said she is a fighter, and that is precisely what is needed if the policies that Obama has championed are to continue to move forward.  A Clinton administration will fight for action to address global warming, to moderate health care costs, to improve education, to reform immigration, to re-build our infrastructure, and more, just in the domain of domestic policy.  A Trump administration would move us backwards on each.  And I far prefer an administration that takes pride in making decisions based on what is in their head, as Obama has done, rather than based on what is in their gut, as Obama’s predecessor was proud to brag of.

As I write this, the polls indicate Hillary Clinton holds a substantial lead.  That may unfortunately have the effect of leading some share of Clinton supporters (and Trump opposers) not to bother to vote on November 8.  They may feel it would not matter, so why bother.  But there are important reasons why all those supporting Clinton, who want the country to move forward rather than backward, need to make the effort to vote.  This blog post will outline a few.

a)  Trump’s share in the vote might well be higher than what the polls indicate:  As of October 23, an average of recent polls indicates that Clinton leads Trump by about 7 percentage points nationally.  While in the US system the candidate receiving the most votes nationally is not necessarily the one elected (due to the electoral college system, so only the votes in a limited number of swing states decide the outcome, as discussed in this earlier blog post), a national margin of 7 percentage points is substantial and reflective of what is happening in the key states.

But the final vote may well be different.  First, it is common that there is a tightening in the race in the last few weeks of most American elections.  There is a good chance this might happen again here.  But second, and more fundamentally, it is important to recognize that the polls may not be assessing accurately the extent of Trump’s support.  This is not due to any kind of conspiracy, or incompetence, but rather because polling this year is particularly difficult to do well.  Trump is an especially controversial candidate, known for his racist as well as misogynist remarks in this campaign.  Some Trump supporters might not admit to a pollster that they support him.  His true support might be several percentage points higher than what the polls indicate, and there are indications that this may have been an issue during the polling for the primaries in at least some of the states. I am not saying that it necessarily is now, but rather that we just do not know.

b)  A focus by Trump on high turnout of his base, instead of a broadening of his base, is not an unreasonable strategy:  Most major party candidates for the presidency seek to broaden their base of support as the election approaches by appealing to the middle.  Trump has not done this.  His focus has been and continues to be on energizing his base, with a continued use of extremist remarks to stoke concerns (the election is rigged, Hillary is a crook whom I will throw into jail, I won’t necessarily accept the results of the election unless they show I won, and so on).

With a base of support that is well less than 50% (even if one discounts the polls to a significant extent; see above), such a strategy might be seen as making it impossible to win.  The moderate middle is not attracted, but indeed repelled.  But it is not necessarily an unreasonable strategy.

The key is to recognize that a very high share of eligible Americans do not vote.  In the 2012 presidential election, only 58% of the population that were eligible to vote in fact cast a ballot for the presidency.  If Trump is able to energize his base and get a high share of them to vote, they can end up winning.

This can be illustrated with some numbers.  Using the polling averages as worked out by the Huffington Post, and rescaling to remove the undecideds, then as of October 23, polling indicated that Clinton would receive 48% of the vote and Trump 41% (with others receiving 11%, primarily Gary Johnson of the Libertarians and Jill Stein of the Greens).  To arrive at these numbers, pollsters used various methods to try to take into account the likelihood that those being polled would actually vote.  But none of these methods are very good.  Some pollsters ask the individual whether they voted in the previous election. However, the share saying they voted is always substantially higher than the share we know actually did vote.  Or some pollsters adjust the figures based on patterns for the share of those who voted in the past who have a similar income or education level, or are of the same ethnic group, or some other such grouping (using exit polling).  But this also does not work very well since the share of different groups who vote changes from election to election depending on the candidates and other issues.

For the purposes here, which are simply illustrative, let’s assume that these polling numbers reflect accurately the share of the population who prefer each of the candidates, but not necessarily the shares of those who actually will vote.  Furthermore, let’s assume that 53% of Clinton’s supporters will actually vote while 63% of Trump’s supporters will (recall the actual average in 2012 was 58%).  Multiplying out the numbers to get those who actually will vote, one finds that Trump in such a scenario would receive a higher share of the vote than Clinton:

Supporters

Turnout

Voters

Share of Vote

Clinton

48%

53%

25.44

44.1%

Trump

41%

63%

25.83

44.8%

Other

11%

58%

6.38

11.1%

All

100%


57.65

100.0%

Turnout matters.  A strategy focussed on turning out a high share of your base supporters, by energizing them through extremist rhetoric with no suggestion of compromise, is not necessarily an irrational one, even if it means losing the more moderate voters.  You could end up with more votes than your opponent.

c)  The winning margin matters for Trump to accept the result of the election:  If Hillary Clinton wins the election, but by a relatively narrow margin, Trump has said that he will not necessarily accept the result.  Trump made this clear in the third presidential debate, and has repeated his remarks since then despite of, and in the face of, strong criticism.  An important strength of American democracy, which distinguishes it from what is seen in a number of other countries around the world, is that the loser of the election concedes and accepts the result.  It might take some time (and court challenges) to determine the winner, but in the end the loser has always graciously accepted the decision (as Al Gore did in 2000).

Trump has been intentionally ambiguous on whether he will.  But the larger the margin by which he loses, the more difficult it will be for him to contest the results.

d)  The winning margin matters for the Republicans to move on:  Trump has upended the national Republican Party by capturing a base, primarily of angry white males with less than a college education, who have said they are willing to take extreme measures to get what they want.  If Trump loses, but by a relatively narrow margin, one can be sure that there will be Trump-like candidates seeking the Republican nomination in 2020, and perhaps even Trump himself.

Strong supporters of the Democrats might feel that this may not be so bad.  Such a candidate would likely lose again.  But that would be short-sighted.  Democracies need a multi-party system, with at least two responsible parties that can each govern responsibly. One-party states, whether in Japan or elsewhere, end up in difficulty.  And one-party states are indeed rare.  Eventually, an opposition party wins, as the electorate tires of those in power and as those long in power become increasingly ineffective.

American democracy needs a responsible opposition party.  Republicans at the national level are not providing that now, and that is a problem for all of us.

e)  The winning margin matters for Clinton to govern effectively:  Everyone agrees that there is much that needs to be done.  But opponents of the measures a Clinton administration would promote to move the  country forward would be emboldened in their opposition should Clinton win by a relatively narrow margin.  The larger the margin, the more difficult it will be for her opponents to block her proposals.

f)  There is an innate inconsistency to be opposed to Washington gridlock, but also to be in favor of divided government:  Everyone agrees that gridlock in Washington is bad.  The country needs to move forward in numerous areas, but gridlock is blocking it.  At the same time, political scientists have long observed (and backed up in their research) that voters often prefer “balanced” government, where the executive branch is controlled by one party with the legislature by the other.

This arrangement may have worked well in periods in the past.  With the system of checks and balances built in to the US Constitution, one branch of government cannot change much alone, but must also receive the support of the other branches (with the judiciary playing an essential, but separate, role as well).

This changed, however, over the last two decades.  Rather than seek common ground on measures, with compromises in order to move things forward, Republicans in Congress decided to adopt a position of opposition.  As documented in the excellent book of Thomas Mann and Norman Ornstein, It’s Even Worse Than It Looks, Republicans decided that if the administration supported something, they would be opposed.  This applied even on measures that they themselves had originally proposed.  The authors, one based at the left-of-center Brookings Institution and one at the right-of-center American Enterprise Institute, provide numerous examples.

Such opposition continues.  Last week, Senator John McCain (who at one time was considered a relative moderate among Republicans) said on a radio talk show that he and his colleagues will oppose any Supreme Court nominee of Hillary Clinton.  He said “I promise you that we will be united against any Supreme Court nominee that Hillary Clinton, if she were president, would put up. … I promise you.”  While a spokeswoman later sought to moderate his position, it does not appear that his views had in fact changed.

Such an approach to government, of united opposition to any proposals put forward by the chief executive, can work in a different form of government.  In parliamentary systems (such as in the UK), the opposition party will typically oppose any measures put forward by the prime minister.  But the prime minister represents a majority in parliament, and hence with party line votes the measure will pass.

But the US Constitution did not establish a parliamentary form of government.  Rather, the system set up by the US Constitution has an independently elected president, along with certain powers assigned to the legislature (such as to make laws, pass a budget, provide “advice and consent” on judicial and senior executive branch appointments, and more).  It is a system of checks and balances, and does not work well when one party decides to act like the opposition in a parliamentary system and routinely oppose measures proposed by the chief executive.

A large winning margin by Hillary Clinton will make it more difficult for a Republican majority to continue to act in this way, at least at the start of the new administration.  And while it is conceivable that the Democrats might win control of the Senate (they need to pick up a net of four seats, assuming Clinton wins so that Vice President Tim Kaine will have the tie-breaking vote), it is doubtful they will pick up the net of 30 seats required to win control of the House.  Too many seats have been gerrymandered.

Voters can resolve this by not voting for divided government, but rather for one party.  And if that party is not to be the one with Trump as president, that means the Democrats. What will not resolve the issues would be to vote for Clinton, but then vote for Republican candidates for the House and the Senate, including those who have sought to keep their distance from Trump, with a number saying they will not themselves vote for Trump.  But it is not really that vote that matters.  What matters is the vote they will take for the leadership of the House or the Senate, and whether that leadership says that they will oppose anything and everything proposed by Clinton, as they have for Obama.  If so, then gridlock will continue.

Conclusion

It would be surprising if Hillary Clinton were not to win this election.  I do not expect her to lose.  But it should be recognized that it is possible.  While the polls put her comfortably ahead as I write this, polls can be wrong, for reasons discussed above.  And we have seen two major such cases already this year.  Most expected British voters would reject the proposal in the June referendum to leave the European Union (Brexit).  Most polls indicated the vote would be in favor of staying.  Instead, it lost, and by the substantial margin of 52% to leave and 48% to stay.

To be fair, the polls in the Brexit referendum were relatively close, especially just before the day of the vote.  A better example of how the polls can be wrong in a major way was the vote in Colombia on October 2 on whether to accept the peace accord the government had negotiated with the FARC rebel army.  The war had been going on for decades, and about 220,000 Colombians have died over the years.  Polls before the vote indicated that over 60% of Colombians would vote in favor of the accord.  But it narrowly lost, by 50.2% to 49.8%.  It is not clear why, although there are many theories.  But one important factor was turnout.  Only 37% of eligible Colombian voters actually voted, perhaps because they believed the peace accord would win easily.  Voter turnout was especially hurt along the country’s Caribbean coast, where a hurricane, while it remained off shore, nonetheless delivered heavy rains on the day of the vote.  Support for the peace accord was especially high in that region, but turnout was low.

I would not predict that the polls in the US presidential elections are wrong, but that there can be uncertainties.  This is especially so this year.  And, for reasons discussed above, the issue is not only who will win or lose, but also what the winning margin will be.  So vote this November 8, and vote for Hillary Clinton.