Part Time Workers and the Affordable Care Act: A Proposal to Address the Real Issue

Part Time Workers as Share of Total Employed, Dec 2007 to Dec 2014

A.  Introduction

The Affordable Care Act (ACA, and also often referred to as ObamaCare) has been working well by any objective measure.  There are now more than 10 million additional Americans who have health insurance who could not get affordable health care before; the share of the uninsured in the US population is now a quarter less than what it was before the individual mandate of the Affordable Care Act went into effect; and this has been achieved at premium rates for the new plans that are reasonable and well less than opponents charged they would be.  Health care costs have also stabilized under Obama, both as a share of GDP and in terms of health prices relative to overall prices, in contrast to the relentless increases in both before.  And while some have criticized this, it is good that there are now minimum quality and coverage standards in health insurance plans.  Such standards are good in themselves.  And without such standards, purported health care “plans” which offer next to nothing (due, for example, to extremely high deductibles) and which can then cost next to nothing, would lead to a death spiral for genuine health care plans that cover costs when you are sick and need treatment.

Gains from the ACA are also reflected in the findings of a recently published report from The Commonwealth Fund.  The Commonwealth Fund has been organizing a periodic survey on health care coverage since 2001.  The most recent survey (for 2014) found that for the first time since the question was first asked in 2003, there was a reduction in the number of Americans avoiding (because of cost) health care services that they needed.  And for the first time since the question was first asked in 2005, the number reporting medical bill or debt problems also fell.  Personal financial distress due to medical problems has been reduced, due to greater access to health insurance and due to health insurance plans that now meet minimum standards.

Despite this (but not surprisingly given the position they staked out against the reform), the Republican Congress continues to vote to repeal, or at least weaken, the law.  The most recent vote was aimed at the provision in the Act which complements the individual mandate to purchase health insurance, with an employer mandate requiring firms with 100 full time equivalent employees or more from January 1 of this year (and with 50 or more from January 1, 2016) to offer health insurance to their full time employees or pay a fee.  The proposed Republican bill would change the definition of a full time worker from one who normally works 30 hours or more a week, to one who works 40 hours or more a week.

The supporters of the change charge that the prospect that employers (with 50 or 100 employees or more) will soon be required to offer health insurance to their full time employees has led firms to cut working hours of their employees, to shift them from full time to part time status, and hence avoid the employer mandate of the ACA.  As a Republican congressman from Texas said:  “We have heard story after story from every state in the union that employers are dropping workers’ hours from less than 39 hours a week to perhaps less than 29.”

This accusation is confused on several levels.  This post will first look at whether there is in fact any evidence that workers are being shifted from full time to part time status as a result of the ACA (or indeed for any other reason).  The answer is no, at least at the level of the overall economy.  Second, there has been a good deal of confusion in the discussion on what the issue really is with regard to part time workers, including by prominent congressmen such as Paul Ryan.  Either Ryan does not understand what the employer mandate is, or if he does, then he has deliberately mischaracterized it.

The public discussion has also avoided altogether the real issue.  It is not that firms with 50 workers or more would be required to offer health insurance to their employees (most do already), but that this insurance is only made available to their full time workers.  Part time workers get nothing, no matter what size firm they work at.  The final section of this blog post will discuss a way to resolve this equitably.

B.  What is the Evidence on Whether the ACA Has Increased the Ranks of Part Time Workers?

The opponents of ObamaCare assert that as a result of the employer mandate, firms have been shifting workers from full time to part time status.  E.g., instead of employing one worker for 40 hours, they are choosing to employ two workers for 20 hours each.  If true, the ratio of part time workers to the total employed will rise.

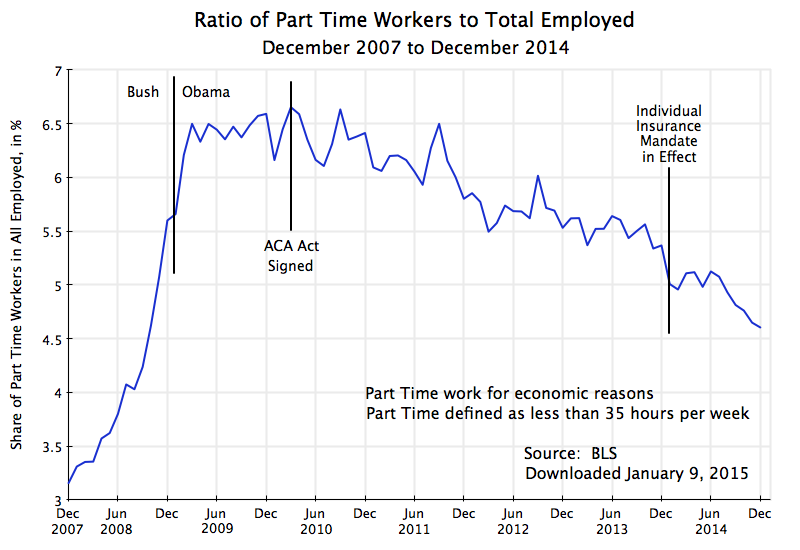
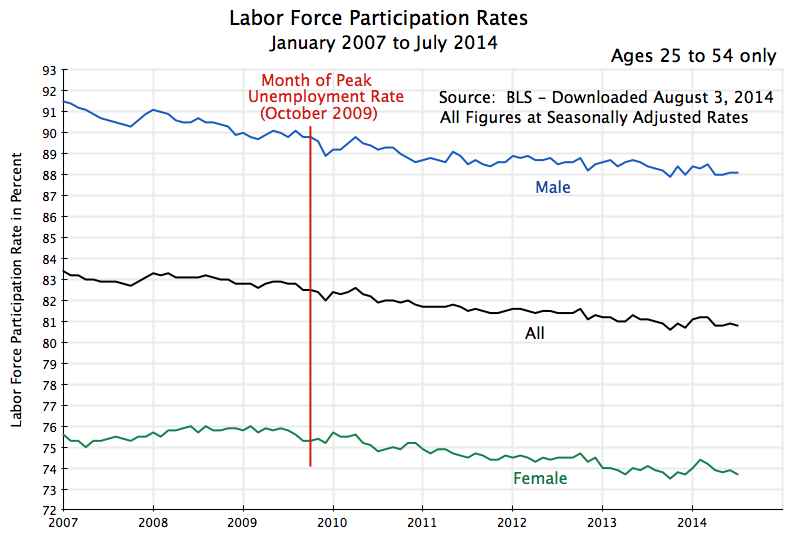
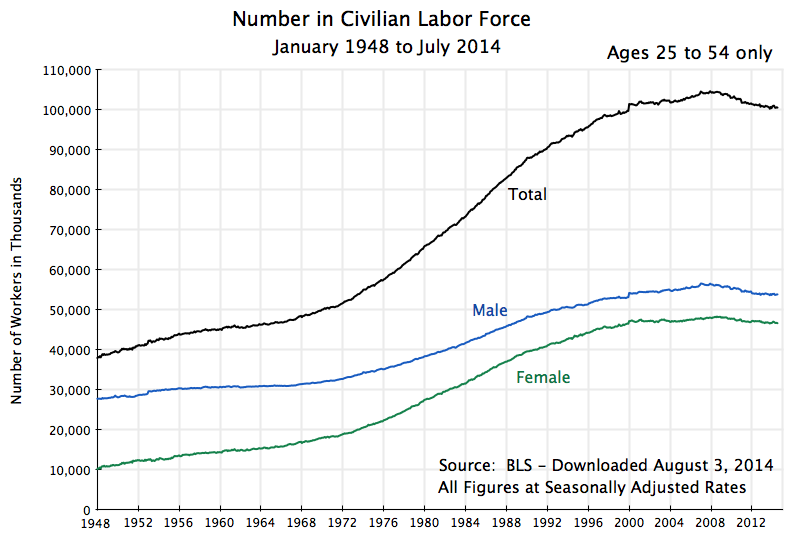
The chart at the top of this post shows this has not been the case.  It is based on data from the Bureau of Labor Statistics, from its Current Population Survey.  This monthly survey of households is used to determine the unemployment rate among other statistics.  The households surveyed are asked whether household members are employed full time or part time (if employed), and if part time, whether this is by choice (because they only want to work part time) or because they want a full time job but cannot find one.  The chart above shows the ratio of workers who are working part time not by choice but for economic reasons, to all workers employed.  Note that the BLS data defines a part time worker as one with fewer than 35 hours of work per week.  While this differs from the 30 hour standard in the ACA, as well as the 40 hour standard in the recently passed Republican legislation, the results in terms of the trends should be similar.  The BLS does not publish data with a different cutoff in terms of hours per week for what is considered part time work.

As in any economic downturn, the ratio rose rapidly in the economic collapse of the last year of the Bush administration.  Regular jobs were disappearing, with some of them shifting to part time status.  Indeed, the absolute number of part time jobs was increasing at the time, even as the total number of jobs was falling, thus leading to two reasons for the ratio to rise, and rise rapidly.

The ratio reached a peak soon after Obama took office, and began to fall about a year later.  Since then it has fallen at a fairly steady pace in terms of the trend.  There were sometimes relatively sharp month to month fluctuations in the data, but this can be on account of statistical noise.  The data comes from a limited sample of households, with only 5 to 6% or so of those employed on part time status (for economic reasons) for most of this period, so the statistical noise in a relative sense (month to month) will be large.  But the downward trend over time is clear, and at a similar downward pace for close to five years now.

What one does not see is any shift in this downward trend linked either to the signing of the Affordable Care Act in March 2010, or to the start of the individual health insurance mandate in January 2014, or to the anticipation of the start of the employer health insurance mandate in January 2015.  Note that since the classification of a worker as a full time or part time worker (and hence the classification of the firm as crossing the 100 or 50 full time worker standard) will be in a period of up to 12 months before the employer mandate goes into effect, one would have seen an impact in 2014 if the 2015 mandate mattered.  There is no indication of this.

The data cover the overall economy.  The figures refer to millions of workers as well as millions of employers.  The US is a large place.  Within such a large place, it will undoubtedly be possible to find particular cases where employers will say that they reduced worker hours to part time status so that they could avoid the health insurance employer mandate.  And one could indeed probably find a long list of firms making such statements.  It would be even easier to find a long list of firms and other entities where working hours were cut, whether or not there was any employer mandate pending.  In a dynamic economy, there will always be a large number of such cases (along with a large number of cases of firms going in the opposite direction, converting part time jobs to full time jobs).

Such anecdotal information, and even a long list of such anecdotes, is not evidence of an issue of substantial scale.  As seen above, there is no evidence of it in the overall numbers.  But one should still recognize that the issue could exist in particular cases.  The question, however, is what is the real issue here, and if there is one, how can it be addressed.

C.  What the Employer Health Insurance Mandate Says

For better or worse, the US health care insurance system is built around health plans normally provided to workers through their place of employment, as part of their overall wage compensation package.  The system began during World War II and has expanded since, supported through substantial tax advantages.  By now, health insurance provision is close to universal among large employers, but substantially less so among small private firms:

Share of Private Firms Offering Health Insurance – 2013
< 10 employees 28.0%
10 to 24 employees 55.3%
25 to 99 employees 77.2%
100 to 999 employees 93.4%
≥ 1000 employees 99.3%
< 50 employees 34.8%
≥ 50 employees 95.7%
All private employees 84.9%
Source:  MEPS, Tables I.A.2 and I.B.2 (2013)

Overall, 84.9% of private sector employees are in firms that offer health insurance as part of their wage packages.  And 96% of firms with more than just 50 employees offer health insurance.

The Affordable Care Act built on this and did not replace it.  Liberals (including myself) would have preferred moving to a system where Medicare would be extended to cover the entire population rather than just those over age 65.  Medicare is an efficient and well managed program, and as an earlier post in this blog discussed, its administrative expenses come to only 2.1% of the benefits paid.  In contrast, administrative costs (including profits) of private health insurance are seven times higher at 14.0% of benefits paid, and an even higher 18.6% of benefits paid in the privately administered Medicare Advantage plans.

But Obama agreed instead to support an approach first proposed by the conservative Heritage Foundation, which was then put forward by Republicans in Congress as their alternative to the health reforms proposed by the Clinton administration (coming out of the task force Hillary Clinton chaired), and which was later adopted in Massachusetts when Mitt Romney was governor.  These plans were built around keeping the existing employer-based provision of health insurance for most of those employed, but to complement this with markets where individuals could purchase health insurance directly if they did not have employer-based coverage, coupled with an individual mandate to buy such health insurance.  The individual mandate is necessary to counter what would otherwise be a resulting death spiral of health insurance plans if everyone is granted access (including those with pre-existing conditions) but only the sick then purchased health insurance (for a description and discussion, see this earlier Econ 101 blog post).

It was not unreasonable to believe that the Republicans would not oppose a plan whose origins lies in their own earlier proposals, but that was not to be.

As noted, the individual mandate is necessary to avoid death spirals in health insurance plans for individuals.  Complementing this, an employer mandate to offer health insurance to their employees is necessary to counter what could otherwise be a “race to the bottom”.  If certain firms did not support such health insurance for their employees, thus reducing the cost to them of their workers, they could undercut competitors who did provide good health insurance support.  It could lead to a race to the bottom.  While not yet widespread in the US, especially for larger firms (see the table above), there has been increasing competitive pressure in the US over the last couple of decades to cut such health insurance support.  An increasing number of employers have done so.

Thus the ACA includes an employer mandate to complement the individual mandate.  However, while the individual mandate went into effect on January 1, 2014, the employer mandate has been twice delayed, and has now (as of January 1, 2015) gone into effect for firms employing 100 of more full time equivalent employees, and will go into effect on January 1, 2016, for firms employing 50 or more full time equivalent employees.  It is this provision that the Republicans in Congress are now trying to subvert.

The charge by Paul Ryan and others has been that medium to small size firms have been cutting the hours of their employees to shift the workers from a full-time classification to a part-time one.  The aim, they say, has been to reduce the number of their full time workers to below 50 so as to avoid the employer mandate.  For example, in a recent opinion piece published in USA Today, Congressman Ryan wrote:  “The law requires employers with more than 50 full-time employees to give them health insurance.  But because the law defines “full time” as 30 hours or more, employers are keeping employees below that threshold to avoid the mandate entirely.”

However, that is not what the law says.  Precisely to avoid such an incentive, the boundaries on the size of a firm subject to the employer mandate is defined in terms of full time equivalent workers (whether 50 or 100).  That is, if a job is split from one full time worker to two half time workers, the number of full time equivalent workers is unchanged.  The two half time workers count as one full time worker for the purposes of the statute.  Cutting back on the number of hours of individual workers to make them part time will not change the status of the firm when the total hours of labor to produce whatever the firm is producing remains unchanged.  And it would be foolish for a firm to produce and sell less when the demand exists for such sales, simply to avoid this mandate.

There is, however, a critically important issue here which Ryan and his colleagues have not discussed.  While splitting jobs of full time workers into multiple part time jobs will not change the status of the firm on whether it is subject to the employer mandate, shifting workers from full time to part time status does affect whether the firm would be required to include health insurance as part of their wage compensation package.  Firms subject to the mandate must offer an affordable health insurance plan available to at least 95% of full time (not full time equivalent) workers, or pay a fee.  The fee (of up to $2,000 per year per worker, less 30 workers per firm) is designed to partially offset (and only very partially offset) the cost of health insurance that they are shifting to others.

But such health insurance typically only is provided to full time workers.  This is true even for giant corporations.  Hence a firm can avoid making health insurance available to its workers by shifting them from full time to part time status.  This has always been the case, and is indeed a problem.

The Affordable Care Act addresses the issue only partially and tangentially.  By including a definition of what constitutes full time work at 30 hours a week or more, the ACA reduces the incentive to shift workers from the traditional 40 hours per week for full time work, to just under 40 hours in order to avoid providing health insurance cover.  A firm would need to cut a normal worker’s hours to below 30 hours per week to avoid providing health insurance, and is unlikely to do that for its regular work force.  But by moving the dividing line up to 40 hours per week, as the Republican legislation passed on January 8 would do, one opens up a loophole for firms to reduce worker hours from 40 to say 39 per week (or 39 1/2 or even 39.99 I would suppose).  Firms would be able easily to avoid offering health insurance to what are in reality their regular, full time, workers; use this to undercut competitors who do offer such insurance; and thus spark a race to the bottom on health insurance coverage in those industries.

D.  Addressing the Problem of Health Insurance for Part Time Workers

As noted above, the ACA does not do much to address the problem of part time workers receiving nothing from their employers for the health insurance everyone needs.  Setting the floor at 30 hours per week helps by ensuring workers close to the traditional 40 hour workweek will receive an employer contribution to their health insurance, and avoids the incentive to shift workers from 40 hours per week to just a bit below.  But part time workers of less than 30 hours per week will still normally receive nothing from their employer to help cover their health insurance.  And it creates an incentive for employers to structure positions as two workers at 20 hours per week, say, than one at 40.  While whether or not the firm was subject to the employer mandate would not be affected (since it is expressed in terms of full time equivalent workers), whether or not the firms would need to provide anything in terms of health insurance would be affected.

But there is a way to address this, now that the individual health insurance marketplaces are operational under the ACA.  All firms could be required to contribute an amount for their part time workers proportional to the hours of such part time work to what full time work would be.  That is, if two workers are each working half time, the firm would contribute an amount of 50% (for each) of the cost of the employer contribution to the health insurance for one full time worker.  The total cost would be the same whether the firm employed one full time or two half time workers.  There would also then not be an incentive to split jobs from full time workers to multiple part time workers.

The employer contribution to the part time worker’s health insurance costs would then be paid, along with taxes such as for Social Security or Medicare, to the government in the name of the specific part time worker.  These funds would then be used as a partial pay down of the costs of that worker purchasing health insurance on the individual health insurance market exchanges set up under the ACA.  And while other splits could be considered, I would recommend that those funds would be split half and half between what the worker would need to pay on the exchange for his or her health plan, and what the government subsidy would provide.

A simple numerical example may help clarify this.  Using made up numbers, suppose the full monthly cost of a standard (Silver level) health insurance plan on the individual exchange where the worker resides is $400.  Assume also that at the current income level of this (part time) worker, the government subsidy for such insurance would be $200 per month, while the worker would pay $200 per month.  Now assume that firms would be required to pay proportional shares of what they provide to full time workers for their health insurance, and that this would come to $100 per month for this part time worker.  This would be split half and half between what the government subsidy would be and what the worker would pay, so under the new approach the government would provide $150, the worker would pay $150, and the funds coming from the firm would cover $100, summing to the $400 total cost.

A few specifics to note:  Many part time workers hold down multiple jobs.  They would receive for their “account” the total proportional amounts from all of their employers.  Many part time workers are also part of married couples.  There could be a household account into which all the sums were paid (for each family member), which could be used to purchase a family health plan on the exchanges.  In the event that the family was not purchasing insurance through the exchange (perhaps, for example, because the spouse worked at a firm providing family coverage), the amount paid by the firm for the part time worker would be returned to the firm (or canceled from the start).

And if the total amounts paid in from the full set of employers for that individual (or family) led to the government subsidy falling all the way to zero, any excess would be allocated to what the individual would pay for the insurance.  This could be common in cases where the family income of the part time worker was close to, or above, the income limit on which government subsidies are provided.

It is only with the advent of the individual health insurance exchanges that this method for covering part time workers became possible.  Previously, firms were not in a position to purchase half of an insurance policy for a half time worker.  But now they can contribute an amount equal to half the cost, with this then used to help purchase coverage on the individual marketplace exchanges.

Note also that with this reform, it would matter less whether full time work was defined as 30 hours per week or 40 hours per week or whatever.  I would recommend keeping the 30 hour per week boundary as it would be a factor in determining what the employer contribution would be.  But it would not be as critical as now, where the boundary determines whether 100% of the employer share of the health insurance cost is paid or 0% is paid.  There would be a smooth transition (a worker of 39 hours when 40 hours is defined as the standard would still receive 39/40 of the payment, and not zero), without a drop straight to zero.

There would also be no reason to limit this extension of the employer mandate only to firms with 50 (or 100) or more full time equivalent workers.  All firms should make such a contribution to covering the cost of their workers’ health insurance needs, just as they all make a contribution to Social Security and Medicare taxes.  Indeed firms of whatever size (although this will soon apply only to firms with less than 50 full time equivalent workers) that do not have any health insurance plan for their staff should participate.  The amounts paid could be set as a proportion to the cost of the medium Silver level plan available on the individual health insurance exchanges in their area.

Undoubtedly, there will be assertions by the Republicans that requiring such a contribution to health insurance costs for their part time workers will lead to an end to such jobs.  This would be similar to the arguments they have made that raising the minimum wage will lead to higher unemployment of lower paid workers, and arguments that were made earlier that paying Social Security taxes would lead to higher unemployment.  But as was discussed in an earlier blog post, there is no evidence that increases in the minimum wage in the magnitudes that have been discussed have led to such higher unemployment.  Ensuring firms contribute proportionally to the health insurance costs of their part time workers would not either.

At One Time, You Could Work Your Way Through College – But Not Any More.

Earnings from Min Wage vs. University Costs, 1963-2013


At one time, not that long ago, a student could work at a minimum wage job over the summers and during holidays, and be able to cover the total cost (including room and board) of attending a four-year state university.  That is now far from possible.

With students now returning to school, it is perhaps a good time to look at what has happened to the affordability of college in recent decades for middle class families.  The chart above provides one indicator.  It compares what a student could earn in a summer job at the minimum wage, or in year-round work at the minimum wage while attending school (i.e. during summers, holidays, and part time during the academic term), as a ratio to what it would cost to attend a four-year state university.

The state university costs are for in-state tuition and required fees, plus the cost of on-campus room and board.  The figures are from the National Center for Education Statistics of the US Department of Education (with figures for 2013 calculated based on the 2012 to 2013 growth in the College Board estimates).  The university cost figures are for four-year, degree granting, state colleges and universities (i.e. they do not include two-year community colleges), and cover all such state schools.  The cost of attending the elite state schools (such as Berkeley, UVA, or the University of Michigan) would be more.  The years shown on the chart are for the beginning of the respective academic years (i.e. 2013 is for the 2013/14 academic year), and the minimum wage rate used is that which was in effect in July of that year.

The chart indicates that one could have covered the cost of attending a state university in the 1960s and 70s solely through minimum wage work.  Based on just a 17 week summer break, one would have earned enough to cover an average of 82% of the full cost of attending school.  An industrious student working full time over the summer and during vacation breaks (such as Christmas), plus 10 hours per week during the academic term, would have been able to cover the full cost and more – an average of 143% of the cost of school.  Hence summer work plus a bit more during vacations would have sufficed to cover the full cost of college.  In terms of dollar figures, the full cost of attending a state university in 1963/64 would have been $929, in the then current dollars.  A student could have earned $782 just from working at minimum wage over the summer, or $1,357 by working at minimum wage over the summer, during vacations, and 10 hours per week during the academic term.

These are, of course, just simple indicators.  One might have been able to earn more than the minimum wage, and/or worked a different number of hours.  But the point is that in the 1960s and 70s, when baby boomers such as myself were going to college, it was possible for the student alone, simply by working at the minimum wage, to have paid for the full cost of attending a four-year state university.

That began to change in the 1980s, as Reagan took office.  The change is indeed striking.  Affordability then began to fall, and it has fallen steadily since, as seen in the chart above.  By 1986, a student working even full time over the summer and during vacation breaks, and 10 hours a week during the academic term, no longer would have been able to cover the full cost of attending school.

The share of schooling costs that could be covered by work then continued to decline (with some bumps up when the minimum wage was sporadically changed) until the present day.  By 2013, summer work would only cover a quarter of the cost of schooling, while more comprehensive work over the entire year would only cover less than half.  In dollar terms, the average cost of attending a state university (for tuition, room, and board) was $18,037 per year in 2013.  But a student working over the summer at the minimum wage would have only been able to earn $4,930, or only a bit over a quarter of the cost of attending school.  Working full time over the summer and during vacations, plus 10 hours per week during the academic term, the student could have only earned $8,555, or less than half the cost of attending school.

As a consequence, students must now rely on their parents (when their parents can afford it), or a scarce number of scholarships (highly limited, especially for state schools), or on student loans.  Otherwise, they must give up on attending university.

The result has been an explosion in student loan debt outstanding.  As of June 30, 2014, student loan debt totaled an estimated $1,275 billion (based on Federal Reserve Board estimates), or five times the level outstanding in 2003 of $250 billion (the earliest figures I could find on a comparable basis; the amounts were so small earlier, that the Fed did not separately break them out).  Student loans have long been common in the US (I had them when I went to school in the early 1970s).  But the amounts outstanding then were relatively small, were at low interest rates, and were for most of us easily manageable.  It is different now.  Student loan debts have exploded in recent years, with a five-fold increase over just the past decade.

The declining affordability of college by this measure is of course a consequence of what has been happening to the two components of the measure.  One has been the unwillingness of Congress to allow the minimum wage to keep up with inflation.  As noted in an earlier post on this blog, the minimum wage in the US has stagnated over the last half century, and is indeed lower now (in real terms) than it was in 1950, when Harry Truman was president.  Real GDP per capita is 3.5 times higher now than it was in 1950, and real labor productivity has increased similarly.  These are not small increases.  I find it amazing (and shameful) that the real minimum wage is lower now than it was then.

For the period since 1963 (the earliest date in the chart), real GDP per capita and real labor productivity are both now 2.7 times higher than what they were then.  But the real minimum wage is close to 20% less now than it was in 1963.

The fall in the real minimum wage fall since the 1960s is half the story.  Note that the inflation measure used for determining the real minimum wage is the general consumer price index (the CPI).  This is the price index for the overall basket of goods and services a US household will purchase.  But the price index is an average over all the goods and services that households buy, and individual items can have price increases that are more than, or less than, this overall average.

In particular, the cost of attending a state university has increased by a good deal more than the overall CPI.  Based on the overall CPI, the real cost of attending a state university (for tuition, room, and board) is now 2.5 times what it was in 1963.  The cost of the tuition component alone is now 4.5 times higher.  The basic cause has been the cutbacks in state budgetary support for their colleges and universities, with tuition and other charges then increased to make up for it.

As a result, the minimum wage has fallen in real terms (based on the overall CPI) since the 1960s, at the same time that the real cost of attending school (relative to the overall CPI) has increased sharply.  The two factors together account for the steep fall in the share of state university costs that one can pay for by working at the minimum wage.  The curves in the chart at the top of this post show that path.

It is important to recognize that this declining affordability of attending state schools was not inevitable, but rather the result of policy choices.  The minimum wage has not been adjusted to reflect general inflation, even though real GDP per capita and labor productivity have both grown substantially.  And as was discussed in another post on this blog, there is no evidence that raising the minimum wage by the modest amounts now being discussed would lead to adverse effects on employment.

Government support for state colleges and universities has also been scaled back, leading to tuition and other cost increases substantially higher than that reflected in the general price index.  This has also been a policy choice.  And it is a policy choice that has prioritized the present generation (with tax cuts a prime example) over the coming generation, that is denying many of the coming generation the educational opportunities we ourselves had.

The (Lack of) Recovery in the Employment to Population Ratio: Not the Concern It Might Appear to Be

Employment to Population Ratios, Jan 2007 to July 2014

Unemployment Rates, Ages 25 to 54, Jan 2007 to July 2014A.  Introduction

A critically important policy question is how close the US economy now is to full employment.  The unemployment rate has been falling, albeit slowly, from a peak of 10.0% in October 2009, to a current 6.2% as of mid-July (ticking up from 6.1% in June, but a 0.1% change is not statistically significant).  That is, the unemployment rate has come down by a bit less than 4% points from its peak.

However, some have noted that one does not see such a recovery if one focusses on the employment to population ratio.  Excellent analysts, such as Paul Krugman and Brad DeLong, have argued that one should.  If the unemployment rate has come down by close to 4% points, then the employment to population ratio should have gone by almost the same in percentage points unless people are dropping out of the labor force.  [It will not go up by exactly the same amount in percentage points since the base for the employment to population ratio is population while the unemployment rate is expressed as a share of the labor force.  But, all else equal, they will be close.  One could make the relationship exact by expressing the unemployment rate in terms of the share of population rather than share of the labor force, but this is not how the unemployment rate is normally reported.]

If the employment to population rate has not recovered by the same amount (in percentage points) as the unemployment rate has, then by arithmetic this is only possible if the labor force participation rate has come down.  The concern is that the pool of unemployed is coming down not because people are finding jobs (which would then be seen in a rising employment to population ratio), but rather because they are dropping out of the labor force after trying, but failing, to find a decent job (thus lowering the labor force participation rate).

There are of course demographic factors as well to take into account to explain what might be happening to the labor force participation rate, in particular the increasing share of the baby boom generation that is reaching normal retirement age.  One way to do this is to focus the analysis on the prime working age group of those aged 25 to 54 only.  All the charts in this post therefore do this.  But even with this refinement, the apparent concern remains:  The employment to population ratio does not show the same recovery that one sees in the falling unemployment rate.  What is going on?

B.  Recent Years

The chart at the top of this post shows the employment to population ratios from January 2007 to July 2014, for those aged 25 to 54, and for everyone together as well as for males and females separately.  The chart below it shows the unemployment rates for these same groups.  The data all come from the Bureau of Labor Statistics.  The peak unemployment rate was hit in October 2009, after which there was a fairly steady recovery.  [The month to month fluctuations mostly reflect statistical noise.  The employment, unemployment, and labor force participation figures are all based on surveys of households, and there will be statistical noise in any such surveys.]

For the group as a whole (male and female), the unemployment rate for those aged 25 to 54 rose by about 5% points between late 2007 / early 2008 and its peak in October 2009.  Over this period the employment to population ratio fell by a similar 5% points.

But this relationship then broke down going forward.  Over the two years between October 2009 and October 2011, for example, the unemployment rate for those aged 25 to 54 fell by 1.1 percentage points, dropping to 7.9% from 9.0% at the peak (for this age group).  But the employment to population ratio hardly moved.  And between October 2009 and the most recent figures (for July 2014), the unemployment rate came down 3.8% points, while the employment to population ratio rose by only 1.6% points.

The question for policy makers is whether the 3.8% fall in the unemployment rate is a reasonable measure of how far the economy has recovered from the 2008 collapse, or the 1.6% recovery in the employment to population ratio is.  As noted above, both the unemployment rate and the employment to population ratio deteriorated by 5% points during the 2008 collapse and follow-on into 2009.  If the 3.8% recovery in the unemployment rate is the right indicator, then we would have retraced about three-quarters of the fall (3.8/5.0 = 0.76).  But if the 1.6% recovery in the employment to population ratio is the right indicator, then we are less than one-third of the way (1.6/5.0 = .32) back.  This is a huge difference.

Since the difference between the two measures must be reflected, by arithmetic, in a declining labor force participation rate, one needs to look there to see what is going on.  For the January 2007 to July 2014 period, the picture is:

Labor Force Participation Rates, Jan 2007 to July 2014

The rates are all falling after October 2009, for males and females, and hence for the two combined.  What is interesting is that they appear to be falling at a fairly steady pace throughout the period (aside from the month to month squiggles that are mostly statistical noise).  And for males, the rate appears to be falling at a broadly similar pace before October 2009.  The trend is not so clear for females before October 2009, whose rate may have been rising until a few months before October 2009.  This then leads to little change in the overall rate for males and females combined, but the period is so short that the trends are not clear.

C.  A Longer Term Perspective

When one then takes a longer view, the trends do become clear:

Labor Force Participation Rates, Jan 1948 to July 2014

Going back to 1948 (the first year in the BLS series for all these labor market indicators), one sees a pretty steady fall in the labor force participation rate for males from around the mid-1950s (with the squiggles in the curves due to statistical noise), and a strong rise in the female labor force participation rate from the initial year with data (1948) to around 2000.  There was some acceleration in the rise for females in the 1970s, and then a deceleration from the early 1990s, leading to a leveling off around 2000.  Since then, the labor force participation rate for females has fallen, on a path that appears to parallel the similar fall in the rate for males, but at 14 to 15% points lower.

The data are consistent with the broader socio-economic story we have of the labor market in the post-World War II period.  Male labor force participation rates are quite high, but have fallen some over time.  Female rates started very low but then grew, and grew at an especially rapid rate starting in the 1970s.  Female labor market participation rates then reached maturity and leveled off around 2000, after which the female rates paralleled the downward path of the male rates, but at a certain distance below.

In this longer term perspective, the decline in the labor force participation rates since 2009 therefore does not appear to be unusual, but rather a continuation of the longer term trend.  There have been some small fluctuations around the long term trends in recent years that appear to coincide with the business cycle (in particular for the female rates), but they are small and dominated over time by the long term trends.  There have also been similar fluctuations in the participation rates in the past (such as in the mid-1990s) that did not coincide in the same way with the business cycle, as well as large business cycle changes in the past that did not show such fluctuations (such as during the big downturn in the early 1980s at the start of the Reagan presidency, that did not lead to such fluctuations in the labor force participation rates).

The implication of this analysis is that the reported unemployment rates are a better indicator of the state of the labor market than the employment to population ratio is.  The fall in the labor market participation rates in recent years has not been something new, driven by the 2008 economic downturn, but rather a continuation of the trend seen in these rates over the longer term.

Looking at unemployment rates for this age group going back to 1948 provides a useful perspective on what to expect for it:

Unemployment Rates, Jan 1948 to July 2014

Unemployment rates continue to be high in mid-2014.  Even though they have retraced about three-quarters of the deterioration in 2008/2009 (more for males, less for females), they are, at 5.2% currently (for males and females together) still well above the unemployment rates for this group of about 4% in late 2007 /early 2008, and of only 3 1/2% in late 2006 / early 2007.  And the unemployment rate for this group was only 3.0% in late 2000, at the end of the Clinton years.

There is therefore still a significant distance to go before the economy will have returned to full employment.  But the improvement since October 2009 is substantial, and is real.

D.  Implications of the Long Term Trends for Aggregate GDP

Finally, while the employment to population ratio might not be a good indicator of how much slack there is in the labor market in the short run, there are long term implications of the trends noted above.  Specifically, while the overall labor force participation rate rose steadily from 1948 (the earliest year for which we have this data) to about 2000, this was entirely due to the strong rise in the female rate over this period.  The male rate was falling, steadily but slowly.  Once the female rate peaked in the year 2000 and then began to fall at a rate similar to that for males, the overall rate began to fall.  There is no indication this will be reversed any time soon.  Indeed, the degree to which the female rate is now paralleling the male rate suggests that this really is a “new normal”.

A falling labor force participation rate is not necessarily an indication of something bad in itself.  It might reflect increased prosperity, which is being enjoyed by choosing not to work but to retire early, or to attend university or post-graduate education programs in your 20s, or to stay at home and raise a family.  But to the extent it reflects lack of free choice, such as being fired in your 40s or 50s and then not being able to find a job, or to remain a perpetual student due to lack of job opportunities, or to stay at home due to the unavailability of affordable child care, the implications are different.  But it is well beyond the scope of this blog post to dig into this deeper.

But there will be important long term implications of declining labor force participation rates on long term GDP growth.  With fewer in the labor force, aggregate GDP growth will be less.  Note that this does not imply growth in GDP per capita (or more precisely, GDP per worker) will be less.  GDP per worker is a function of productivity growth.  But with fewer workers than otherwise, aggregate GDP growth will be less.

Two final charts, then, to close this blog post.  The first shows the absolute number of people in the ages 25 to 54 population cohort, who are not in the labor force:

Population Not in Labor Force, Jan 1948 to July 2014

The number of males in this age group not in the labor force has been growing steadily since the late 1960s.  The number of females not in the labor force fell until around 1990, was then flat for a decade, and then began to grow.  Overall, the number aged 25 to 54 not in the labor force started to grow around 1990, and has continued to grow since.

Looking at the numbers of those in the 25 to 54 age group in the labor force:

Labor Force Number, Jan 1948 to July 2014

Due to a growing population in this age group (baby boomers, for example, but others as well), and the growing labor force participation rates of females until 2000, the total labor force in this group rose from the starting year (1948) until 2008.  It grew especially fast in the 1970s, 80s, and 90s.  But the absolute size of the labor force (in the 25 to 54 age group) then started to fall from 2008.  This is a historic change for the US, and based on the fall in labor force participation rates discussed above, as well as slowing population growth, should be expected to continue.  While GDP growth per capita (or per worker) might continue to grow as it has in the past (and it has grown at a remarkably consistent 1.9% a year since 1870 in the US, as discussed in this earlier blog post), one should expect aggregate GDP growth to slow.

E.  Summary and Conclusion

The unemployment rate has fallen substantially since hitting its peak in October 2009, but one does not see a similar recovery in the employment to population ratio.  The labor force participation rate therefore has to have fallen.  However, it does not appear that this fall in the labor force participation rate has been driven by the economic downturn, where high unemployment and poor job prospects led workers to drop out of the labor force on a widespread basis.  Rather it appears largely to be a continuation of longer term trends, that become clear when one separates out the paths for male and female labor force participation rates.

The implication is that the unemployment rate is probably a good indicator of how much slack there is in the labor force.  The unemployment rate has retraced about three-quarters of the rise during the 2008/2009 downturn, but is still high.  And it is substantially higher than what was seen as possible in late 2006 / early 2007, and especially the rate achieved in late 2000.

But there are longer term implications.  The analysis suggests that we should not expect much of a recovery in the labor force participation rate when the economy finally returns to full employment.  Rather, the labor force participation rate is on a downward slope, and has been since the year 2000 (when the female rates reached maturity).  This is likely to continue.  The result is that the absolute size of the labor force in the prime working age years of 25 to 54 should be expected to continue to fall for the foreseeable future.  Japan and most of the European economies have already been facing this.  While GDP per worker, which is driven by productivity change, need not necessarily slow, one should expect growth in aggregate GDP to be less than what one saw in the past.  The ability to adapt to, and manage in, this new economic environment remains to be seen.