A Carbon Tax with Redistribution Would Be a Significant Help to the Poor

A.  Introduction

Economists have long recommended taxing pollution as an effective as well as efficient way to achieve societal aims to counter that pollution.  What is commonly called a “carbon tax”, but which in fact would apply to all emissions of greenhouse gases (where carbon dioxide, CO2, is the largest contributor), would do this.  “Cap and trade” schemes, where polluters are required to acquire and pay for a limited number of permits, act similarly.  The prime example in the US of such a cap and trade scheme was the program to sharply reduce the sulfur dioxide (SO2) pollution from the burning of coal in power plants.  That program was launched in 1995 and was a major success.  Not only did the benefits exceed the costs by a factor of 14 to 1 (with some estimates even higher – as much as 100 to 1), but the cost of achieving that SO2 reduction was only one-half to one-quarter of what officials expected it would have cost had they followed the traditional regulatory approach.

Cost savings of half or three-quarters are not something to sneer at.  Reducing greenhouse gas emissions, which is quite possibly the greatest challenge of our times, will be expensive.  The benefits will be far greater, so it is certainly worthwhile to incur those expenses (and it is just silly to argue that “we cannot afford it” – the benefits far exceed the costs).  One should, however, still want to minimize those costs.

But while such cost savings are hugely important, one should also not ignore the distributional consequences of any such plan.  These are a concern of many, and rightly so.  The poor should not be harmed, both because they are poor and because their modest consumption is not the primary cause of the pollution problem we are facing.  But this is where there has been a good deal of confusion and misunderstanding.  A tax on all greenhouse gas emissions, with the revenue thus generated then distributed back to all on an equal per capita basis, would be significantly beneficial to the poor in purely financial terms.  Indeed it would be beneficial to most of the population since it is a minority of the population (mostly those who are far better off financially than most) who account for a disproportionate share of emissions.

A specific carbon tax plan that would work in this way was discussed in an earlier post on this blog.  I would refer the reader to that earlier post for the details on that plan.  But briefly, under this proposal all emissions of greenhouse gases (not simply from power plants, but from all sources) would pay a tax of $49 per metric ton of CO2 (or per ton of CO2 equivalent for other greenhouse gases, such as methane).  A fee of $49 per metric ton would be equivalent to about $44.50 per common ton (2,000 pounds, as commonly used in the US but nowhere else in the world).  The revenues thus generated would then be distributed back, in full, to the entire population in equal per capita terms, on a monthly or quarterly basis.  There would also be a border-tax adjustment on goods imported, which would create the incentive for other countries to join in such a scheme (as the US would charge the same carbon tax on such goods when the source country hadn’t, but with those revenues then distributed to Americans).

The US Treasury published a study of this scheme in January 2017, and estimated that such a tax would generate $194 billion of revenues in its initial year (which was assumed to be 2019).  This would allow for a distribution of $583 to every American (man, woman, and child – not just adults).  Furthermore, the authors estimated what the impact would be by family income decile, and concluded that the bottom 7 deciles of families (the bottom 70%, as ranked by income) would enjoy a net benefit, while only the richest 30% would pay a net cost.

That distributional impact will be the focus of this blog post.  It has not received sufficient attention in the discussion on how to address climate change.  While the Treasury study did provide estimates on what the impacts by income decile would be (although not always in an easy to understand form), views on a carbon tax often appear to assume, incorrectly, that the poor will pay the most as a share of their income, while the rich will be able to get away with avoiding the tax.  The impact would in fact be the opposite.  Indeed, while the primary aim of the program is, and should be, the reduction of greenhouse gas emissions, its redistributive benefits are such that on that basis alone the program would have much to commend it.  It would also be just.  As noted above, the poor do not account for a disproportionate share of greenhouse gas emissions – the rich do – yet the poor suffer similarly, if not greater, from the consequences.

This blog post will first review those estimated net cash benefits by family income decile, both in dollar amounts and as a share of income.  To give a sense of how important this is in magnitude, it will then examine how these net benefits compare to the most important current cash transfer program in the US – food stamp benefits.  Finally, it will briefly review the politics of such a program.  Perceptions have, unfortunately, been adverse, and many pundits believe a carbon tax program would never be approved.  Perhaps this might change if news sources paid greater attention to the distribution and economic justice benefits.

B.  Net Benefits or Costs by Family Income Decile from a Carbon Tax with Redistribution

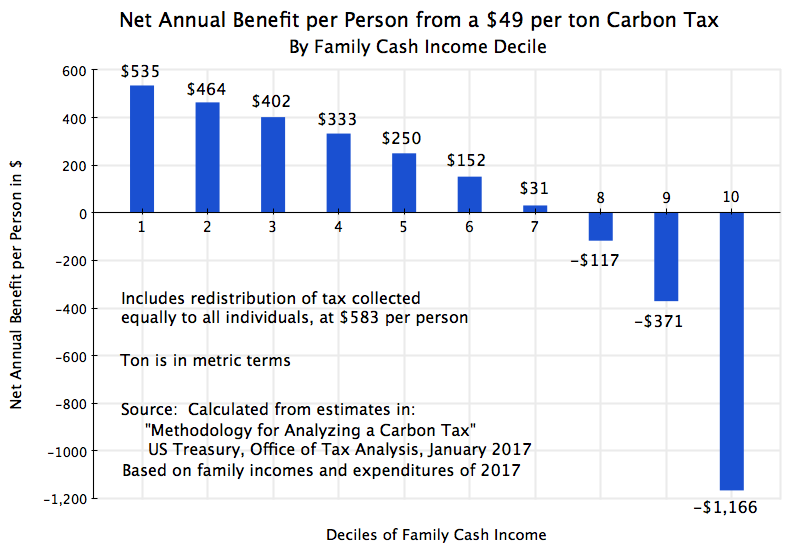
The chart at the top of this post shows what the average net impact would be in dollars per person, by family cash income decile, if a carbon tax of $49 per metric ton were charged with the revenues then distributed on an equal per capita basis.  While prices of energy and other goods whose production or use leads to greenhouse gas emissions would rise, the revenues from the tax thus generated would go back in full to the population.  Those groups who account for a less than proportionate share of greenhouse gas emissions (the poor and much of the middle class) would come out ahead, while those with the income and lifestyle that lead to a greater than average share of greenhouse gas emissions (the rich) will end up paying in more.

The figures are derived from estimates made by the staff of the US Treasury – staff that regularly undertake assessments of the incidence across income groups of various tax proposals.  The study was published in January 2017, and the estimates are of what the impacts would have been had the tax been in place for 2019.  The results were presented in tables following a standard format for such tax incidence studies, with the dollars per person impact of the chart above derived from those tables.

To arrive at these estimates, the Treasury staff first calculated what the impact of such a $49 per metric ton carbon tax would be on the prices of goods.  Such a tax would, for example, raise the price of gasoline by $0.44 per gallon based on the CO2 emitted in its production and when it is burned.  Using standard input-output tables they could then estimate what the price changes would be on a comprehensive set of goods, and based on historic consumption patterns work out what the impacts would be on households by income decile.  The net impact would then follow from distributing back on an equal per capita basis the revenues collected by the tax.  For 2019, the Treasury staff estimated $194 billion would be collected (a bit less than 1% of GDP), which would allow for a transfer back of $583 per person.

Those in the poorest 10% of households would receive an estimated $535 net benefit per person from such a scheme.  The cost of the goods they consume would go up by $48 per person over the course of a year, but they would receive back $583.  They do not account for a major share of greenhouse gas emissions because they cannot afford to consume much.  They are poor, and a family earning, say, $20,000 a year consumes far less of everything than a family earning $200,000 a year.  In terms of greenhouse gas emissions implicit in the Treasury numbers, the poorest 10% of Americans account only for a bit less than 1.0 metric tons of CO2 emissions per person per year (including the CO2 equivalent in other greenhouse gases).  The richest 10% account for close to 36 tons CO2 equivalent per person per year.

As one goes from the lower income deciles to the higher, consumption rises and CO2 emissions from the goods consumed rises.  But it is not a linear trend by decile.  Rather, higher-income households account for a more than proportionate share of greenhouse gas emissions.  As a consequence, the break-even point is not at the 50th percentile of households (as it would be if the trend were linear), but rather something higher.  In the Treasury estimates, households up through the 70th percentile (the 7th decile) would on average still come out ahead.  Only the top three deciles (the richest 30%) would end up paying more for the carbon tax than what they would receive back.  But this is simply because they account for a disproportionately high share of greenhouse gas emissions.  It is fully warranted and just that they should pay more for the pollution they cause.

But it is also worth noting that while the richer household would pay more in dollar terms than they receive back, those higher dollar amounts are modest when taken as a share of their high incomes:

In dollar terms the richest 10% would pay in a net $1,166 per person in this scheme, as per the chart at the top of this post.  But this would be just 1.0% of their per-person incomes.  The 9th decile (families in the 80 to 90th percentile) would pay in a net of 0.7% of their incomes, and the 8th decile would pay in a net of 0.3%. At the other end of the distribution, the poorest 10% (the 1st decile) would receive a net benefit equal to 8.9% of their incomes.  This is not minor.  The relatively modest (as a share of incomes) net transfers from the higher-income households permit a quite substantial rise (in percentage terms) in the incomes of poorer households.

C.  A Comparison to Transfers in the Food Stamps Program

The food stamps program (formally now called SNAP, for Supplemental Nutrition Assistance Program) is the largest cash income transfer program in the US designed specifically to assist the poor.  (While the cost of Medicaid is higher, those payments are made directly to health care providers for their medical services to the poor.)  How would the net transfers under a carbon tax with redistribution compare to SNAP?  Are they in the same ballpark?

I had expected they would not be close.  However, it turns out that they are not that far apart.  While food stamps would still provide a greater transfer for the very poorest households, the supplement to income that those households would receive by such a carbon tax scheme would be significant.  Furthermore, the carbon tax scheme would be of greater benefit than food stamps are, on average, for lower middle-class households (those in the 3rd decile and above).

The Congressional Budget Office (CBO) has estimated how food stamp (SNAP) benefits are distributed by household income decile.  While the forecast year is different (2016 for SNAP vs. 2019 for the carbon tax), for the purposes here the comparison is close enough.  From the CBO figures one can work out the annual net benefits per person under SNAP for households in the 1st to 4th deciles (with the 5th through the 10th deciles then aggregated by the CBO, as they were all small):

The average annual benefits from SNAP were estimated to be about $1,500 per person for households in the poorest decile and $690 per person in the 2nd decile.  These are larger than the estimated net benefits of these two groups under a carbon tax program (of $535 and $464 per person, respectively), but it was surprising, at least to me, that they are as close as they are.  The food stamp program is specifically targeted to assist the poor to purchase the food that they need.  A carbon tax with redistribution program is aimed at cutting back greenhouse gas emissions, with the funds generated then distributed back to households on an equal per capita basis.  They have very different aims, but the redistribution under each is significant.

D.  But the Current Politics of Such a Program Are Not Favorable

A carbon tax with redistribution program would therefore not only reduce greenhouse gas emissions at a lower cost than traditional approaches, but would also provide for an equitable redistribution from those who account for a disproportionate share of greenhouse gas emissions (the rich) to those who do not (the poor).  But news reporters and political pundits, including those who are personally in favor of such a program, consider it politically impossible.  And in what was supposed to be a personal email, but which was part of those obtained by Russian government hackers and then released via WikiLeaks in order to assist the Trump presidential campaign, John Podesta, the senior campaign manager for Hillary Clinton, wrote:  “We have done extensive polling on a carbon tax.  It all sucks.”

Published polls indicate that the degree of support or not for a carbon tax program depends critically on how the question is worded.  If the question is stated as something such as “Would you be in favor of taxing corporations based on their carbon emissions”, polls have found two-thirds or more of Americans in support.  But if the question is worded as something such as “Would you be in favor of paying a carbon tax on the goods you purchase”, the support is less (often still more than a majority, depending on the specific poll, but less than two-thirds).  But they really amount to the same thing.

There are various reasons for this, starting with that the issue is a complex one, is not well understood, and hence opinions can be easily influenced based on how the issue is framed.  This opens the field to well-funded vested interests (such as the fossil fuel companies) being able to influence votes by sophisticated advertising.  Opponents were able to outspend proponents by 2 to 1 in Washington State in 2018, when a referendum on a proposed carbon tax was defeated (as it had been also in 2016).  Political scientists who have studied the two Washington State referenda believe they would be similarly defeated elsewhere.

There appear to be two main concerns:  The first is that “a carbon tax will hurt the poor”.  But as examined above, the opposite would be the case.  The poor would very much benefit, as their low consumption only accounts for a small share of carbon emissions (they are poor, and do not consume much of anything), but they would receive an equal per capita share of the revenues raised.

In distinct contrast, but often not recognized, a program to reduce greenhouse gas emissions based on traditional regulation would still see an increase in costs (and indeed likely by much more, as noted above), but with no compensation for the poor.  The poor would then definitely lose.  There may then be calls to add on a layer of special subsidies to compensate the poor, but these rarely work well.

The second concern often heard is that “a carbon tax is just a nudge” and in the end will not get greenhouse gas emissions down.  There may also be the view (internally inconsistent, but still held) that the rich are so rich that they will not cut back on their consumption of high carbon-emission goods despite the tax, while at the same time the rich can switch their consumption (by buying an electric car, for example, to replace their gasoline one) while the poor cannot.

But the prices do matter.  As noted at the start of this post, the experience with the cap and trade program for SO2 from the burning of coal (where a price is put on the SO2 emissions) found it to be highly effective in bringing SO2 emissions down quickly.  Or as was discussed in an earlier post on this blog, charging polluters for their emissions would be key to getting utilities to switch use to clean energy sources.  The cost of both solar and wind new generation power capacity has come down sharply over the past decade, to the point where, for new capacity, they are the cheapest sources available.  But this is for new generation.  When there is no charge for the greenhouse gases emitted, it is still cheaper to keep burning gas and often coal in existing plants, as the up-front capital costs have already been incurred and do not affect the decision of what to use for current generation.  But as estimated in that earlier post, if those plants were charged $40 per ton for their CO2 emissions, it would be cheaper for the power utilities to build new solar or wind plants and use these to replace existing fossil fuel plants.

There are many other substitution possibilities as well, but many may not be well known when the focus is on a particular sector.  For example, livestock account for about 30% of methane emissions resulting from human activity.  This is roughly the same share as methane emissions from the production and distribution of fossil fuels.  And methane is a particularly potent greenhouse gas, with 86 times the global warming potential over a 20-year horizon of an equal weight of CO2.  Yet a simple modification of the diets of cows will reduce their methane emissions (due to their digestive system – methane comes out as burps and farts) by 33%.  One simply needs to add to their feed just 100 grams of lemongrass per day and the digestive chemistry changes to produce far less methane.  Burger King will now start to purchase its beef from such sources.

This is a simple and inexpensive change, yet one that is being done only by Burger King and a few others in order to gain favorable publicity.  But a tax on such greenhouse gas emissions would induce such an adjustment to the diets of livestock more broadly (as well as research on other dietary changes, that might lead to an even greater reduction in methane emissions).  A regulatory focus on emissions from power plants alone would not see this.  One might argue that a broader regulatory system would cover emissions from such agricultural practices, and in principle it should.  But there has been little discussion of extending the regulation of greenhouse gas emissions to the agricultural sector.

More fundamentally, regulations are set and then kept fixed over time in order to permit those who are regulated to work out and then implement plans to comply.  Such systems are not good, by their nature, at handling innovations, as by definition innovations are not foreseen.  Yet innovations are precisely what one should want to encourage, and indeed the ex-post assessment of the SO2 emissions trading program found that it was innovations that led to costs being far lower than had been anticipated.  A carbon tax program would similarly encourage innovations, while regulatory schemes can not handle them well.

There may well be other concerns, including ones left unstated.  Individuals may feel, for example, that while climate change is indeed a major issue and needs to be addressed, and that redistribution under a carbon tax program might well be equitable overall, that they will nonetheless lose.  And some will.  Those who account for a disproportionately high share of greenhouse gas emissions through the goods they purchase will end up paying more.  But costs will also rise under the alternative of a regulatory approach (and indeed rise by a good deal more), which will affect them as well.  If they do indeed account for a disproportionately high share of greenhouse gas emissions, they should be especially in favor of an approach that would bring these emissions down at the lowest possible cost.  A scheme that puts a price on carbon emissions, such as in a carbon tax scheme, would do this at a lower cost than traditional approaches.

So while many have concerns with a carbon tax with redistribution scheme, much of this is due to a misunderstanding of what the impacts would be, as well as of what the impacts would be of alternatives.  One sees this in the range of responses to polling questions on such schemes, where the degree of support depends very much on how the questions are worded or framed.  There is a need to explain better how a carbon tax with redistribution program would work, and we have collectively (analysts, media, and politicians) failed to do this.

There are also some simple steps one can take which would likely increase the attractiveness of such a program.  For example, perceptions would likely be far better if the initial rebate checks were sent up-front, before the carbon taxes were first to go into effect, rather than later, at the end of whatever period is chosen.  Instead of households being asked to finance the higher costs over the period until they received their first rebate checks, one would have the government do this.  This would not only make sense financially (government can fund itself more cheaply than households can), but more important, politically.  Households would see up-front that they are, indeed, receiving a rebate check before the prices go up to reflect the carbon tax.

And one should not be too pessimistic.  While polling responses depend on the precise wording used, as noted above, the polling results still usually show a majority in support.  But the issue needs to be explained better.  There are problems, clearly, when issues such as the impact on the poor from such a scheme are so fundamentally misunderstood.

E.  Conclusion 

Charging for greenhouse gases emitted (a carbon tax), with the revenues collected then distributed back to the population on an equal per capita basis, would be both efficient (lower cost) and equitable.  Indeed, the transfers from those who account for an especially high share of greenhouse gas emissions (the rich) to those who account for very little of them (the poor), would provide a significant supplement to the incomes of the poor.  While the redistributive effect is not the primary aim of the program (reducing greenhouse gases is), that redistributive effect would be both beneficial and significant.  It should not be ignored.

The conventional wisdom, however, is that such a scheme could not command a majority in a referendum.  The issue is complex, and well-funded vested interests (the fossil fuel companies) have been able to use that complexity to propagate a sufficient level of concern to defeat such referenda.  The impact on the poor has in particular been misportrayed.

But climate change really does need to be addressed.  One should want to do this at the lowest possible cost while also in an equitable manner.  Hopefully, as more learn what carbon tax schemes can achieve, politicians will obtain the support they need to move forward with such a program.

The Performance of the Stock Market During Trump’s Term in Office: Not So Special

A.  Introduction

Stock market performance is often taken to be a good measure of how the economy as a whole is performing.  But it is not.  For most Americans it is simply irrelevant, as the overwhelming share of investments in the stock markets are held by only a small segment of the population (the wealthy).  And its track record as a broader indicator of how the economy is performing is imperfect at best.

Still, many do focus on stock market returns, and Trump brags that the performance of the market during his term in office has been spectacular.

That is not the case.  This post will look at how the stock market has performed during Trump’s term in office thus far, and compare it to what that performance was under presidents going back to Reagan up to the same point in their terms.

First, however, we will briefly discuss to what extent one should expect stock market prices to reflect actions a president might be taking.  And the answer is some, but there is much more going on.

B.  Presidential Policies and the Stock Market

Owning shares of a firm entitles the owner to a share of the profits generated by that firm, both now and into the future.  And while there are many complications, a simple metric commonly used to assess the price of a share in a firm, is the price/earnings ratio.  If earnings (profits) go up, now and into the future, then for a given price/earnings ratio the price of the stock would go up in proportion.

Economic policies affect profits.  And in a thriving economy, profits will also be rising.  The policies of a presidential administration will affect this, and although the link is far from a tight one (with important lags as well), policies that are good for the economy as a whole will generally also lead to a rising stock market.

But there is also a more specific link to policy.  What accrues to the shareholders are not overall profits, but profits after taxes.  And this changed significantly as a result of the new tax law pushed through Congress by Trump and the Republicans in December 2017.  It resulted in the effective corporate profits (income) tax being cut by more than half:

This chart is an update of one prepared for an earlier post on this blog (where one can see a further discussion of what lies behind it).  It shows corporate profit taxes at the federal level as a share of corporate profits (calculated from figures in the national income accounts issued by the BEA).  While Trump and the Republicans in Congress asserted the 2017 tax bill would not lead to lower corporate profit taxes being paid (as loopholes would be closed, they asserted), in fact they did.  And dramatically so, with the effective corporate tax rate being slashed by more than half –  from around 15 to 16% prior to 2017, to just 7% or so since the beginning of 2018 (and to just 6.3% most recently).

This cut therefore led to a significant increase in after-tax profits for any given level of before-tax profits, which has accrued to the shareholders.  Note that this would not be due to the corporations becoming more productive or efficient, but rather simply from taxing profits less and shifting the tax burden then on to others (i.e. a redistributive effect).  And based on a reduction in the taxes from 16% of corporate profits to 7%, after-tax profits would have gone from 84% of profits to 93%, an increase of about 11%.  For any given price/earnings ratio, one would then expect stock prices, for this reason alone, to have gone up by about 11%.

[Side note:  Technically one should include in this calculation also the impact of taxes on profits by other government entities – primarily those of state and local governments.  These have been flat at around 3 1/2% of profits, on average.  With these taxes included, after-tax profits rose from 80 1/2% of before-tax profits to 89 1/2%, an increase that is still 11% within round-off.]

One should therefore expect that stock prices following this tax cut (or in anticipation of it) would have been bumped up by an additional 11% above what they otherwise would have been.  Other things equal, the performance of the stock market under Trump should have looked especially good as a result of the shift in taxes away from corporations onto others.  But what has in fact happened?

C.  Trump vs. Obama

The chart at the top of this post compares the performance of the stock market during Trump’s term in office thus far (through December 31, 2019) to that under Obama to the same point in his first term in office.  The difference is clear.  Other than during Obama’s first few months in office, when he inherited from George W. Bush an economy in freefall, stock market performance under Obama was always better than it has been under Trump.  Even after slashing corporate profit taxes by more than half, the stock market under Trump did not do exceptionally well.

The S&P500 Index is being used as the measure of the US stock market.  Most professionals use this index as the best indicator of overall stock market performance, as it is comprehensive and broad (covering the 500 largest US companies as measured by stock market value, with the companies weighted in the index based on their market valuations).  The data were downloaded from Yahoo Finance, where it is conveniently available (with daily values for the index going back to 1927), but can be obtained from a number of sources.  The chart shows end-of-month figures, starting from December 31 of the month before inauguration, and going through to December 31 of their third year in office.  The index is scaled to 100.0 on exactly January 20 (with this presented as “month” 0.65).

So if one wants to claim “bragging rights” for which president saw a better stock market performance, Obama wins over Trump, at least so far in their respective terms.

D.  Trump vs. All Presidents Since Reagan

A comparison to just one president is limited.  How does the performance under Trump compare to that under other US presidents up to the same points in their terms in office?  Trump is roughly in the middle:

This chart tracks the performance under each president since Reagan up through the third year of their first terms in office.  I have adjusted here for inflation (using the CPI), as inflation was substantially higher during the Reagan and Bush Sr. terms in office than it has been since.  (I left the chart at the top of this post of just Obama vs. Trump in nominal terms as inflation in recent years has been steady and low.  But for those interested in the impact of this, one can see the Obama and Trump numbers in real terms in the current chart.)  I have included in this chart only the first terms of each president (with one exception) as the chart is already cluttered and was even more so when I had all the presidential terms.

The exception is that I included for perspective the stock market performance during Clinton’s second term in office.  The stock market rose over that period by close to 80% in real terms, which was substantially higher than under any other president since at least before Reagan in either their first or second terms.  The performance in Obama’s first term (of 146% in real terms) was the second-highest.  There was then a set of cases which, at the three-year mark, showed surprising uniformity in performance, with increases of between 32% and 34% in the second Reagan term, the first Clinton term, the second Obama term, and Trump’s term so far.  Bush Sr. was not far behind this set with an increase of 28%.

The worst performances were under Bush Jr. ( a fall of 22% to the third-year point in his first term), and Reagan (an increase of just 8% to that point in his first term).

So the performance of the market under Trump is in the middle – not the worst, but well below the best.

E.  Single Year Increases in the S&P500 from 1946 to 2019

Finally, was the increase under Trump in his best single year so far (2019) a record?  No, it was not.  Looking at the single year performances (in real terms) since 1946, the top 15 were:

The increase in 2019, of 25.9%, was good, but only the sixth-highest of the 74 years between 1946 and 2019 (inclusive).  The stock market rose by more in 2013 during Obama’s term in office (by 27.7%), and in 1997 (28.8%) and 1995 (30.8%) which were both Clinton years.  And the highest increases were in 1958 (35.7%) and 1954 (45.6%) when Eisenhower was president.

The market also rose substantially in 2017, in Trump’s first year in office, by 16.9%.  But it then fell by 8.0% in 2018, in Trump’s second year in office.  Overall, the average rank (out of the 74 years from 1946 to 2019) of the individual year performances over the three years Trump has been in office so far, would place Trump in the middle third.  Not the worst, but also far from the best.  And comparing the three-year average while Trump has been president to rolling three-year averages since 1946, Trump’s average (of 11.6%) is well below the best.  The highest was an average return of 25.3% in 1995-97 during Clinton’s term in office.  And the three-year average return was also higher at 16.7% in 2012-14 during Obama’s term.

F.  Summary and Conclusion

Trump likes to brag that the performance of the stock market during his term in office has been exceptional.  But despite a slashing of corporate profit taxes (which, other things being equal would be expected to increase stock prices by 11%), the performance of the market during Trump’s term in office would put him in the middle.  Specifically:

a)  The market rose by more during the first three years of Obama’s term in office than it has under Trump;

b)  Compared to the first three years in office of all presidents since Reagan (whether first terms only, or first and second terms) would place Trump in the middle.  Indeed, the increase under Trump so far was almost exactly the same as the increases seen (at the three-year point) in Obama’s second term, in Reagan’s second term, and in Clinton’s first term.  And the return under Trump was well below that seen in Obama’s first term, and especially far below that in Clinton’s second term.

c)  The individual year performances during Trump’s three years have also not been exceptional.  While the performance in 2019 was good, it was below that of a number of other years since World War II, and below that of individual years during Obama’s and Clinton’s terms in office.

But as noted at the start of this post, stock market returns should not be over-emphasized.  An increase in the stock market does little for those who do not have the wealth to have substantial holdings in the stock market, and as a broader indicator of how the overall economy is performing, stock market returns are imperfect at best.

Still, one should be accurate in one’s claims.  And as on many things, Trump has not been.

Andrew Yang’s Proposed $1,000 per Month Grant: Issues Raised in the Democratic Debate

A.  Introduction

This is the second in a series of posts on this blog addressing issues that have come up during the campaign of the candidates for the Democratic nomination for president, and which specifically came up in the October 15 Democratic debate.  As flagged in the previous blog post, one can find a transcript of the debate at the Washington Post website, and a video of the debate at the CNN website.

This post will address Andrew Yang’s proposal of a $1,000 per month grant for every adult American (which I will mostly refer to here as a $12,000 grant per year).  This policy is called a universal basic income (or UBI), and has been explored in a few other countries as well.  It has received increased attention in recent years, in part due to the sharp growth in income inequality in the US of recent decades, that began around 1980.  If properly designed, such a $12,000 grant per adult per year could mark a substantial redistribution of income.  But the degree of redistribution depends directly on how the funding would be raised.  As we will discuss below, Yang’s specific proposals for that are problematic.  There are also other issues with such a program which, even if well designed, calls into question whether it would be the best approach to addressing inequality.  All this will be discussed below.

First, however, it is useful to address two misconceptions that appear to be widespread.  One is that many appear to believe that the $12,000 per adult per year would not need to come from somewhere.  That is, everyone would receive it, but no one would have to provide the funds to pay for it.  That is not possible.  The economy produces so much, whatever is produced accrues as incomes to someone, and if one is to transfer some amount ($12,000 here) to each adult then the amounts so transferred will need to come from somewhere.  That is, this is a redistribution.  There is nothing wrong with a redistribution, if well designed, but it is not a magical creation of something out of nothing.

The other misconception, and asserted by Yang as the primary rationale for such a $12,000 per year grant, is that a “Fourth Industrial Revolution” is now underway which will lead to widespread structural unemployment due to automation.  This issue was addressed in the previous post on this blog, where I noted that the forecast job losses due to automation in the coming years are not out of line with what has been the norm in the US for at least the last 150 years.  There has always been job disruption and turnover, and while assistance should certainly be provided to workers whose jobs will be affected, what is expected in the years going forward is similar to what we have had in the past.

It is also a good thing that workers should not be expected to rely on a $12,000 per year grant to make up for a lost job.  Median earnings of a full-time worker was an estimated $50,653 in 2018, according to the Census Bureau.  A grant of $12,000 would not go far in making up for this.

So the issue is one of redistribution, and to be fair to Yang, I should note that he posts on his campaign website a fair amount of detail on how the program would be paid for.  I make use of that information below.  But the numbers do not really add up, and for a candidate who champions math (something I admire), this is disappointing.

B.  Yang’s Proposal of a $1,000 Monthly Grant to All Americans

First of all, the overall cost.  This is easy to calculate, although not much discussed.  The $12,000 per year grant would go to every adult American, who Yang defines as all those over the age of 18.  There were very close to 250 million Americans over the age of 18 in 2018, so at $12,000 per adult the cost would be $3.0 trillion.

This is far from a small amount.  With GDP of approximately $20 trillion in 2018 ($20.58 trillion to be more precise), such a program would come to 15% of GDP.  That is huge.  Total taxes and revenues received by the federal government (including all income taxes, all taxes for Social Security and Medicare, and everything else) only came to $3.3 trillion in FY2018.  This is only 10% more than the $3.0 trillion that would have been required for Yang’s $12,000 per adult grants.  Or put another way, taxes and other government revenues would need almost to be doubled (raised by 91%) to cover the cost of the program.  As another comparison, the cost of the tax cuts that Trump and the Republican leadership rushed through Congress in December 2017 was forecast to be an estimated $150 billion per year.  That was a big revenue loss.  But the Yang proposal would cost 20 times as much.

With such amounts to be raised, Yang proposes on his campaign website a number of taxes and other measures to fund the program.  One is a value-added tax (VAT), and from his very brief statements during the debates but also in interviews with the media, one gets the impression that all of the program would be funded by a value-added tax.  But that is not the case.  He in fact says on his campaign website that the VAT, at the rate and coverage he would set, would raise only about $800 billion.  This would come only to a bit over a quarter (27%) of the $3.0 trillion needed.  There is a need for much more besides, and to his credit, he presents plans for most (although not all) of this.

So what does he propose specifically?:

a) A New Value-Added Tax:

First, and as much noted, he is proposing that the US institute a VAT at a rate of 10%.  He estimates it would raise approximately $800 billion a year, and for the parameters for the tax that he sets, that is a reasonable estimate.  A VAT is common in most of the rest of the world as it is a tax that is relatively easy to collect, with internal checks that make underreporting difficult.  It is in essence a tax on consumption, similar to a sales tax but levied only on the added value at each stage in the production chain.  Yang notes that a 10% rate would be approximately half of the rates found in Europe (which is more or less correct – the rates in Europe in fact vary by country and are between 17 and 27% in the EU countries, but the rates for most of the larger economies are in the 19 to 22% range).

A VAT is a tax on what households consume, and for that reason a regressive tax.  The poor and middle classes who have to spend all or most of their current incomes to meet their family needs will pay a higher share of their incomes under such a tax than higher-income households will.  For this reason, VAT systems as implemented will often exempt (or tax at a reduced rate) certain basic goods such as foodstuffs and other necessities, as such goods account for a particularly high share of the expenditures of the poor and middle classes.  Yang is proposing this as well.  But even with such exemptions (or lower VAT rates), a VAT tax is still normally regressive, just less so.

Furthermore, households will in the end be paying the tax, as prices will rise to reflect the new tax.  Yang asserts that some of the cost of the VAT will be shifted to businesses, who would not be able, he says, to pass along the full cost of the tax.  But this is not correct.  In the case where the VAT applies equally to all goods, the full 10% will be passed along as all goods are affected equally by the now higher cost, and relative prices will not change.  To the extent that certain goods (such as foodstuffs and other necessities) are exempted, there could be some shift in demand to such goods, but the degree will depend on the extent to which they are substitutable for the goods which are taxed.  If they really are necessities, such substitution is likely to be limited.

A VAT as Yang proposes thus would raise a substantial amount of revenues, and the $800 billion figure is a reasonable estimate.  This total would be on the order of half of all that is now raised by individual income taxes in the US (which was $1,684 billion in FY2018).  But one cannot avoid that such a tax is paid by households, who will face higher prices on what they purchase, and the tax will almost certainly be regressive, impacting the poor and middle classes the most (with the extent dependent on how many and which goods are designated as subject to a reduced VAT rate, or no VAT at all).  But whether regressive or not, everyone will be affected and hence no one will actually see a net increase of $12,000 in purchasing power from the proposed grant  Rather, it will be something less.

b)  A Requirement to Choose Either the $12,000 Grants, or Participation in Existing Government Social Programs

Second, Yang’s proposal would require that households who currently benefit from government social programs, such as for welfare or food stamps, would be required to give up those benefits if they choose to receive the $12,000 per adult per year.  He says this will lead to reduced government spending on such social programs of $500 to $600 billion a year.

There are two big problems with this.  The first is that those programs are not that large.  While it is not fully clear how expansive Yang’s list is of the programs which would then be denied to recipients of the $12,000 grants, even if one included all those included in what the Congressional Budget Office defines as “Income Security” (“unemployment compensation, Supplemental Security Income, the refundable portion of the earned income and child tax credits, the Supplemental Nutrition Assistance Program [food stamps], family support, child nutrition, and foster care”), the total spent in FY2018 was only $285 billion.  You cannot save $500 to $600 billion if you are only spending $285 billion.

Second, such a policy would be regressive in the extreme.  Poor and near-poor households, and only such households, would be forced to choose whether to continue to receive benefits under such existing programs, or receive the $12,000 per adult grant per year.  If they are now receiving $12,000 or more in such programs per adult household member, they would receive no benefit at all from what is being called a “universal” basic income grant.  To the extent they are now receiving less than $12,000 from such programs (per adult), they may gain some benefit, but less than $12,000 worth.  For example, if they are now receiving $10,000 in benefits (per adult) from current programs, their net gain would be just $2,000 (setting aside for the moment the higher prices they would also now need to pay due to the 10% VAT).  Furthermore, only the poor and near-poor who are being supported by such government programs will see such an effective reduction in their $12,000 grants.  The rich and others, who benefit from other government programs, will not see such a cut in the programs or tax subsidies that benefit them.

c)  Savings in Other Government Programs 

Third, Yang argues that with his universal basic income grant, there would be a reduction in government spending of $100 to $200 billion a year from lower expenditures on “health care, incarceration, homelessness services and the like”, as “people would be able to take better care of themselves”.  This is clearly more speculative.  There might be some such benefits, and hopefully would be, but without experience to draw on it is impossible to say how important this would be and whether any such savings would add up to such a figure.  Furthermore, much of those savings, were they to follow, would accrue not to the federal government but rather to state and local governments.  It is at the state and local level where most expenditures on incarceration and homelessness, and to a lesser degree on health care, take place.  They would not accrue to the federal budget.

d)  Increased Tax Revenues From a Larger Economy

Fourth, Yang states that with the $12,000 grants the economy would grow larger – by 12.5% he says (or $2.5 trillion in increased GDP).  He cites a 2017 study produced by scholars at the Roosevelt Institute, a left-leaning non-profit think tank based in New York, which examined the impact on the overall economy, under several scenarios, of precisely such a $12,000 annual grant per adult.

There are, however, several problems:

i)  First, under the specific scenario that is closest to the Yang proposal (where the grants would be funded through a combination of taxes and other actions), the impact on the overall economy forecast in the Roosevelt Institute study would be either zero (when net distribution effects are neutral), or small (up to 2.6%, if funded through a highly progressive set of taxes).

ii)  The reason for this result is that the model used by the Roosevelt Institute researchers assumes that the economy is far from full employment, and that economic output is then entirely driven by aggregate demand.  Thus with a new program such as the $12,000 grants, which is fully paid for by taxes or other measures, there is no impact on aggregate demand (and hence no impact on economic output) when net distributional effects are assumed to be neutral.  If funded in a way that is not distributionally neutral, such as through the use of highly progressive taxes, then there can be some effect, but it would be small.

In the Roosevelt Institute model, there is only a substantial expansion of the economy (of about 12.5%) in a scenario where the new $12,000 grants are not funded at all, but rather purely and entirely added to the fiscal deficit and then borrowed.  And with the current fiscal deficit now about 5% of GDP under Trump (unprecedented even at 5% in a time of full employment, other than during World War II), and the $12,000 grants coming to $3.0 trillion or 15% of GDP, this would bring the overall deficit to 20% of GDP!

Few economists would accept that such a scenario is anywhere close to plausible.  First of all, the current unemployment rate of 3.5% is at a 50 year low.  The economy is at full employment.  The Roosevelt Institute researchers are asserting that this is fictitious, and that the economy could expand by a substantial amount (12.5% in their scenario) if the government simply spent more and did not raise taxes to cover any share of the cost.  They also assume that a fiscal deficit of 20% of GDP would not have any consequences, such as on interest rates.  Note also an implication of their approach is that the government spending could be on anything, including, for example, the military.  They are using a purely demand-led model.

iii)  Finally, even if one assumes the economy will grow to be 12.5% larger as a result of the grants, even the Roosevelt Institute researchers do not assume it will be instantaneous.  Rather, in their model the economy becomes 12.5% larger only after eight years.  Yang is implicitly assuming it will be immediate.

There are therefore several problems in the interpretation and use of the Roosevelt Institute study.  Their scenario for 12.5% growth is not the one that follows from Yang’s proposals (which is funded, at least to a degree), nor would GDP jump immediately by such an amount.  And the Roosevelt Insitute model of the economy is one that few economists would accept as applicable in the current state of the economy, with its 3.5% unemployment.

But there is also a further problem.  Even assuming GDP rises instantly by 12.5%, leading to an increase in GDP of $2.5 trillion (from a current $20 trillion), Yang then asserts that this higher GDP will generate between $800 and $900 billion in increased federal tax revenue.  That would imply federal taxes of 32 to 36% on the extra output.  But that is implausible.  Total federal tax (and all other) revenues are only 17.5% of GDP.  While in a progressive tax system the marginal tax revenues received on an increase in income will be higher than at the average tax rate, the US system is no longer very progressive.  And the rates are far from what they would need to be twice as high at the margin (32 to 36%) as they are at the average (17.5%).  A more plausible estimate of the increased federal tax revenues from an economy that somehow became 12.5% larger would not be the $800 to $900 billion Yang calculates, but rather about half that.

Might such a universal basic income grant affect the size of the economy through other, more orthodox, channels?  That is certainly possible, although whether it would lead to a higher or to a lower GDP is not clear.  Yang argues that it would lead recipients to manage their health better, to stay in school longer, to less criminality, and to other such social benefits.  Evidence on this is highly limited, but it is in principle conceivable in a program that does properly redistribute income towards those with lower incomes (where, as discussed above, Yang’s specific program has problems).  Over fairly long periods of time (generations really) this could lead to a larger and stronger economy.

But one will also likely see effects working in the other direction.  There might be an increase in spouses (wives usually) who choose to stay home longer to raise their children, or an increase in those who decide to retire earlier than they would have before, or an increase in the average time between jobs by those who lose or quit from one job before they take another, and other such impacts.  Such impacts are not negative in themselves, if they reflect choices voluntarily made and now possible due to a $12,000 annual grant.  But they all would have the effect of reducing GDP, and hence the tax revenues that follow from some level of GDP.

There might therefore be both positive and negative impacts on GDP.  However, the impact of each is likely to be small, will mostly only develop over time, and will to some extent cancel each other out.  What is likely is that there will be little measurable change in GDP in whichever direction.

e)  Other Taxes

Fifth, Yang would institute other taxes to raise further amounts.  He does not specify precisely how much would be raised or what these would be, but provides a possible list and says they would focus on top earners and on pollution.  The list includes a financial transactions tax, ending the favorable tax treatment now given to capital gains and carried interest, removing the ceiling on wages subject to the Social Security tax, and a tax on carbon emissions (with a portion of such a tax allocated to the $12,000 grants).

What would be raised by such new or increased taxes would depend on precisely what the rates would be and what they would cover.  But the total that would be required, under the assumption that the amounts that would be raised (or saved, when existing government programs are cut) from all the measures listed above are as Yang assumes, would then be between $500 and $800 billion (as the revenues or savings from the programs listed above sum to $2.2 to $2.5 trillion).  That is, one might need from these “other taxes” as much as would be raised by the proposed new VAT.

But as noted in the discussion above, the amounts that would be raised by those measures are often likely to be well short of what Yang says will be the case.  One cannot save $500 to $600 billion in government programs for the poor and near-poor if government is spending only $285 billion on such programs, for example.  A more plausible figure for what might be raised by those proposals would be on the order of $1 trillion, mostly from the VAT, and not the $2.2 to $2.5 trillion Yang says will be the case.

C.  An Assessment

Yang provides a fair amount of detail on how he would implement a universal basic income grant of $12,000 per adult per year, and for a political campaign it is an admirable amount of detail.  But there are still, as discussed above, numerous gaps that prevent anything like a complete assessment of the program.  But a number of points are evident.

To start, the figures provided are not always plausible.  The math just does not add up, and for someone who extolls the need for good math (and rightly so), this is disappointing.  One cannot save $500 to $600 billion in programs for the poor and near-poor when only $285 billion is being spent now.  One cannot assume that the economy will jump immediately by 12.5% (which even the Roosevelt Institute model forecasts would only happen in eight years, and under a scenario that is the opposite of that of the Yang program, and in a model that few economists would take as credible in any case).  Even if the economy did jump by so much immediately, one would not see an increase of $800 to $900 billion in federal tax revenues from this but rather more like half that.  And other such issues.

But while the proposal is still not fully spelled out (in particular on which other taxes would be imposed to fill out the program), we can draw a few conclusions.  One is that the one group in society who will clearly not gain from the $12,000 grants is the poor and near-poor, who currently make use of food stamp and other such programs and decide to stay with those programs.  They would then not be eligible for the $12,000 grants.  And keep in mind that $12,000 per adult grants are not much, if you have nothing else.  One would still be below the federal poverty line if single (where the poverty line in 2019 is $12,490) or in a household with two adults and two or more children (where the poverty line, with two children, is $25,750).  On top of this, such households (like all households) will pay higher prices for at least some of what they purchase due to the new VAT.  So such households will clearly lose.

Furthermore, those poor or near-poor households who do decide to switch, thus giving up their eligibility for food stamps and other such programs, will see a net gain that is substantially less than $12,000 per adult.  The extent will depend on how much they receive now from those social programs.  Those who receive the most (up to $12,000 per adult), who are presumably also most likely to be the poorest among them, will lose the most.  This is not a structure that makes sense for a program that is purportedly designed to be of most benefit to the poorest.

For middle and higher-income households the net gain (or loss) from the program will depend on the full set of taxes that would be needed to fund the program.  One cannot say who will gain and who will lose until the structure of that full set of taxes is made clear.  This is of course not surprising, as one needs to keep in mind that this is a program of redistribution:  Funds will be raised (by taxes) that disproportionately affect certain groups, to be distributed then in the $12,000 grants.  Some will gain and some will lose, but overall the balance has to be zero.

One can also conclude that such a program, providing for a universal basic income with grants of $12,000 per adult, will necessarily be hugely expensive.  It would cost $3 trillion a year, which is 15% of GDP.  Funding it would require raising all federal tax and other revenue by 91% (excluding any offset by cuts in government social programs, which are however unlikely to amount to anything close to what Yang assumes).  Raising funds of such magnitude is completely unrealistic.  And yet despite such costs, the grants provided of $12,000 per adult would be poverty level incomes for those who do not have a job or other source of support.

One could address this by scaling back the grant, from $12,000 to something substantially less, but then it becomes less meaningful to an individual.  The fundamental problem is the design as a universal grant, to all adults.  While this might be thought to be politically attractive, any such program then ends up being hugely expensive.

The alternative is to design a program that is specifically targeted to those who need such support.  Rather than attempting to hide the distributional consequences in a program that claims to be universal (but where certain groups will gain and certain groups will lose, once one takes fully into account how it will be funded), make explicit the redistribution that is being sought.  With this clear, one can then design a focussed program that addresses that redistribution aim.

Finally, one should recognize that there are other policies as well that might achieve those aims that may not require explicit government-intermediated redistribution.  For example, Senator Cory Booker in the October 15 debate noted that a $15 per hour minimum wage would provide more to those now at the minimum wage than a $12,000 annual grant.  This remark was not much noted, but what Senator Booker said was true.  The federal minimum wage is currently $7.25 per hour.  This is low – indeed, it is less (in real terms) than what it was when Harry Truman was president.  If the minimum wage were raised to $15 per hour, a worker now at the $7.25 rate would see an increase in income of $15.00 – $7.25 = $7.75 per hour, and over a year of 40 hour weeks would see an increase in income of $7.75 x 40 x 52 = $16,120.00.  This is well more than a $12,000 annual grant would provide.

Republican politicians have argued that raising the minimum wage by such a magnitude will lead to widespread unemployment.  But there is no evidence that changes in the minimum wage that we have periodically had in the past (whether federal or state level minimum wages) have had such an adverse effect.  There is of course certainly some limit to how much it can be raised, but one should recognize that the minimum wage would now be over $24 per hour if it had been allowed to grow at the same pace as labor productivity since the late 1960s.

Income inequality is a real problem in the US, and needs to be addressed.  But there are problems with Yang’s specific version of a universal basic income.  While one may be able to fix at least some of those problems and come up with something more reasonable, it would still be massively disruptive given the amounts to be raised.  And politically impossible.  A focus on more targeted programs, as well as on issues such as the minimum wage, are likely to prove far more productive.