
A. Introduction
The health care market and especially the health care insurance market, need to be understood if we are to come up with a viable health care reform. Health care services are obtained from, and are paid through, such markets, but these markets have particular characteristics which set them apart from what might be considered an ordinary market. Because of these characteristics, the health care market does not lead to what economists would call an efficient outcome. Rather, they lead to limited competition in local markets, high administrative and other costs, where the most efficient providers are not rewarded, and where there is little market pressure to move the system to those who provide the highest value to those in need of health care services.
This Econ 101 post will review these characteristics, structured around an approach based on defining some of the strange terms and language that economists use to describe such markets. Not all terms will be covered – only those important to an understanding of what is needed in health reform. And the focus will be on aspects relevant to the US system, not necessarily to systems elsewhere. The first section below will be on health insurance, and the next section then on the broader market for the provision of health care services and its funding.
Most (although not all) of the discussion will be couched in terms of individuals buying health insurance directly. It is recognized that most Americans are covered indirectly through their employer (who purchases insurance for them as part of their wage compensation package) or through government programs such as Medicare and Medicaid. But the primary problems are in the individual health insurance market. The Obamacare reforms are designed to address some of these, but issues will remain. And the problems in the individual markets are important not only in themselves, but also as they illustrate issues that arise as well in the markets for insurance through employers or government backed programs. Hence it is necessary to understand what lies behind the failures of the individual health insurance markets prior to the Obamacare reforms, which have led to the extremely high costs and limited access and coverage that Americans have faced in trying to obtain and pay for health care.
B. Health Insurance
1) Insurance: Insurance is a contractual agreement between two parties: The insurer providing the insurance, and the insured party (or insuree, or client, or customer, or patient) purchasing the insurance. The insured party makes a regular payment (often monthly) to the insurer (the payment is called the premium), and in return the insurer will pay part or all of the costs incurred if some event occurs (a claim, as contractually set out). The event will be some health related event for health insurance. The timeline is important (and will be discussed further below): The premium payments are paid first, and the insurance claims are paid at some later point in time when an insured event occurs.
2) Risk pool: An insurance company is a financial institution, with sufficient capital (monitored by regulators) to allow it to pay claims that may come due, and with a high degree of statistical confidence that the capital they have on hand or have access to will indeed suffice. One does not know for any individual whether they will incur health costs leading to an insurance claim in the next period. However, with a large enough pool of clients being insured, the insurance company can work out with some degree of statistical confidence what the total claims will be in any given period, and from this what insurance rate (premium rate) they will need to charge to cover such costs. The group they are insuring is called the risk pool.
3) Unbiased sample: To work out what to charge, the insurance company will need to know the characteristics (in terms of expected health claim costs) of those they are insuring. If they are an unbiased sample taken from the population as a whole, then the health characteristics of the population as a whole (with the characteristics, such as age, of those in the risk pool) can be used to determine the level of claims to expect in any given period, and therefore what to charge.
4) Biased sample: A biased sample, in contrast, is one with a heavier share (or weighting) of some sub-group who will have a different likelihood of making a claim. If that sub-group tends to have higher health care claims than the broader group, then the health care characteristics of that broader group will underestimate the costs that will in fact be incurred by the group being insured.
5) Asymmetric information: Markets do not function well when the parties on one side of a transaction have more information on what is being traded than the parties on the other side. In health insurance, the insured individual will know more about their personal health status than a health insurance company will know.
6) Adverse selection: If the insurance is being priced to cover the costs of a risk pool that the insurance company assumes will be an unbiased sample from the general population, and an individual knows he or she has some illness or condition which will likely result in higher insurance claims than for an average person, then that individual will in general be eager to purchase such insurance. And if an individual knows he or she is relatively more healthy than others, then he or she may decide to forego the purchase of such health insurance despite the risks, as on average their expected costs will be lower. As a result, the insurer will end up with a risk pool that is biased towards those who will likely have higher insurance claims. This is adverse selection. The premium rate that was calculated based on an unbiased sample will not then suffice to cover the costs.
7) Death spiral: In a situation where there is asymmetric information and the individual can choose whether or not to purchase health insurance, a premium rate sufficient to cover costs for an unbiased risk pool will lose money for the pool actually enrolled. The insurance company will respond by raising the premium rates in the next period. But at the higher premium rates, some individuals who were at the borderline of deciding whether or not to enroll (as they were relatively more healthy than those in the biased risk pool), will decide not to re-enroll. This will lead to an even more biased risk pool, leading to another round of the insurance company raising premium rates, and to another round of those then at the new borderline deciding not to re-enroll. There might eventually be a stable equilibrium of relatively high cost enrollees and relatively high premium rates, but it is also possible and indeed likely, depending on the characteristics of the population, that there will be fewer and fewer enrollees in each round until it all collapses. This is the death spiral.
8) Free riders: Individuals may choose not to enroll in a health plan because they believe they will have lower health costs than others. But it is not that they necessarily believe their health costs will be lower than for others for the rest of their lives, but rather only for a period until they once again have the option of enrolling in a health insurance plan. If insurance companies are required to enroll anyone who wishes to enroll at any time, then some might try to enroll literally on the day before they are scheduled to go to a hospital for a major operation. Insurance companies try to address this by limiting open enrollment only to certain periods at some regular time each year, but this will be only partially successful. Many medical procedures can be planned months ahead (such as whether to have a hip or knee replacement, or whether to try to become pregnant or not). Free riders are those who try to game the system by paying in premiums for only a short period before they incur what they know will be major medical costs. And free riders include not only those who seek to postpone coverage just to the next open enrollment period when they know they will incur some major medical expense, but also those who might be relatively young and aim to enroll only decades later when, due to their then advancing age, they know there health care costs will be high.
9) Biased selection: It is not only the insured parties who use the asymmetric information they have on their own health needs or who seek to exploit the system as free riders, who can play this game. Insurance companies have become quite capable at designing health insurance plans to exclude, or at least to discourage, those who could be expected to incur higher health claim costs. One way has been to exclude those with pre-existing medical conditions. Those in the population who have some existing medical condition that has required treatment will generally continue to require higher than average treatment. Insurance companies will deny them coverage if they are legally can. Until Obamacare, they generally could.
10) Individual mandate: These problems of adverse and biased selection will be largely resolved if all in the population are required to secure health insurance coverage. This is the individual mandate. Individuals cannot then game the system as free riders, or choose to avoid cover if they expect (based on the information they know about themselves, which the insurers will not know) that their health care costs will likely be relatively low, at least until the next open enrollment period. And with an individual mandate in place, insurers can then be required to offer coverage at non-discriminatory rates to all, including those with pre-existing conditions. The death spiral would not then take hold.
11) Biased selection II: But issues may still remain. The individual mandate requirement under Obamacare is not terribly strong, with only modest penalties for those who choose not to obtain insurance coverage (and with campaigns also underway by conservative groups to try to stop or at least discourage Americans from enrolling in any health care plan). Insurance companies can play more subtle tricks as well. Even though they will not now be able to block enrollment by someone with a pre-existing condition, they can design plans that will be unappealing to those who might have certain types of medical expenses, that might signal conditions associated with overall higher than average medical expenses. Their hope is that such individuals will then choose to enroll in a health plan offered by some other insurer. Or they can design plans that might be especially appealing to those who are more healthy. The classic example of this is to include the price of gym membership in the insurance plan. The premium rates will be higher than otherwise to cover the cost of gym membership, and those not interested in gym membership will then not find this to be an advantageous plan. But it would be attractive to those who are already paying for a gym, or who wish to enroll in one. The advantage to the health insurer is not so much that their enrollees will now start to go to the gym more often (although that will help), but more that those in the population who do use a gym are generally more healthy than the overall population for many reasons, including diet and other activities.
12) Time inconsistency: A further issue in health insurance is the arrow of time. One enrolls in some health insurance plan, pays the premium for a period of time, and at some later point might have a health insurance claim. But health insurance plans can be extremely complex (often deliberately so), with details buried in the fine print that may give the insurer an excuse to deny a claim that the patient had thought would be insured. For a more normal product the customer would then absorb the loss and choose to switch to a different vendor, after receiving what they see as bad service or a broken promise. But this can be difficult in health insurance. First, the loss incurred on the medical care obtained could well be huge and not easy to absorb. A study published in 2009 by Harvard Medical School researchers found that 62% of all personal bankruptcies filed in 2007 in the US were caused by medical problems. Furthermore, these were not mostly bankruptcies of individuals without health insurance. The Harvard researchers found that 78% of those filing for bankruptcy had medical insurance at the start of their illness.
But a second reason (and until the Obamacare reforms the more important one), is that a person in need for medical care cannot at that point choose to switch to a different health insurance provider. At precisely that point when he realizes his existing health insurer is not performing, the person needs major medical care and hence has a pre-existing condition, and no new insurer will willingly take them on. While denial of cover due to pre-existing conditions will now not be allowed under the Obamacare reforms, the individual will still not be able to switch insurance plans in the middle of the year, but only during an open enrollment period. Depending on the treatment needed and its urgency, the patient will not be able to switch to another insurer precisely when he or she needs insurance the most.
The Obamacare reforms, with effective access for those with pre-existing conditions as well as minimum standards on other aspects of health insurance plans (such as no annual or lifetime limits, and requirements on what will be covered), will be a major step to resolving the time inconsistency problem. But it will still not be fully resolved.
13) Moral hazard: Another commonly cited issue, in particular in conservative circles, is the concern that when patients do not face the full cost of the health care treatment (as insurance covers a part of the cost, and perhaps almost all of it), they will then “over-consume” health care. They will obtain treatments that they do not really need, or choose more expensive treatments than necessary. This is actually an issue that exists in principle for any type of insurance, whether for health or something else. It is called “moral hazard”.
Whether this is an important issue in practice for health care is not so clear. First, few of us want to go into surgery or be subject to some other major medical procedure unless it is really necessary, even if free. Second, it is the doctor and not the patient who will normally decide and recommend whether some medical procedure is warranted. And third, the recommended response by conservatives to the moral hazard issue is high deductible health insurance plans, as was discussed in a previous posting on this blog. They argue that patients will then face the full cost of care when within the deductible. But a high deductible plan is simply not relevant for addressing moral hazard for those who need a major medical procedure or treatment. At that point, the deductible is no longer relevant as it would have already been paid. Incentives and expenses will be the same.
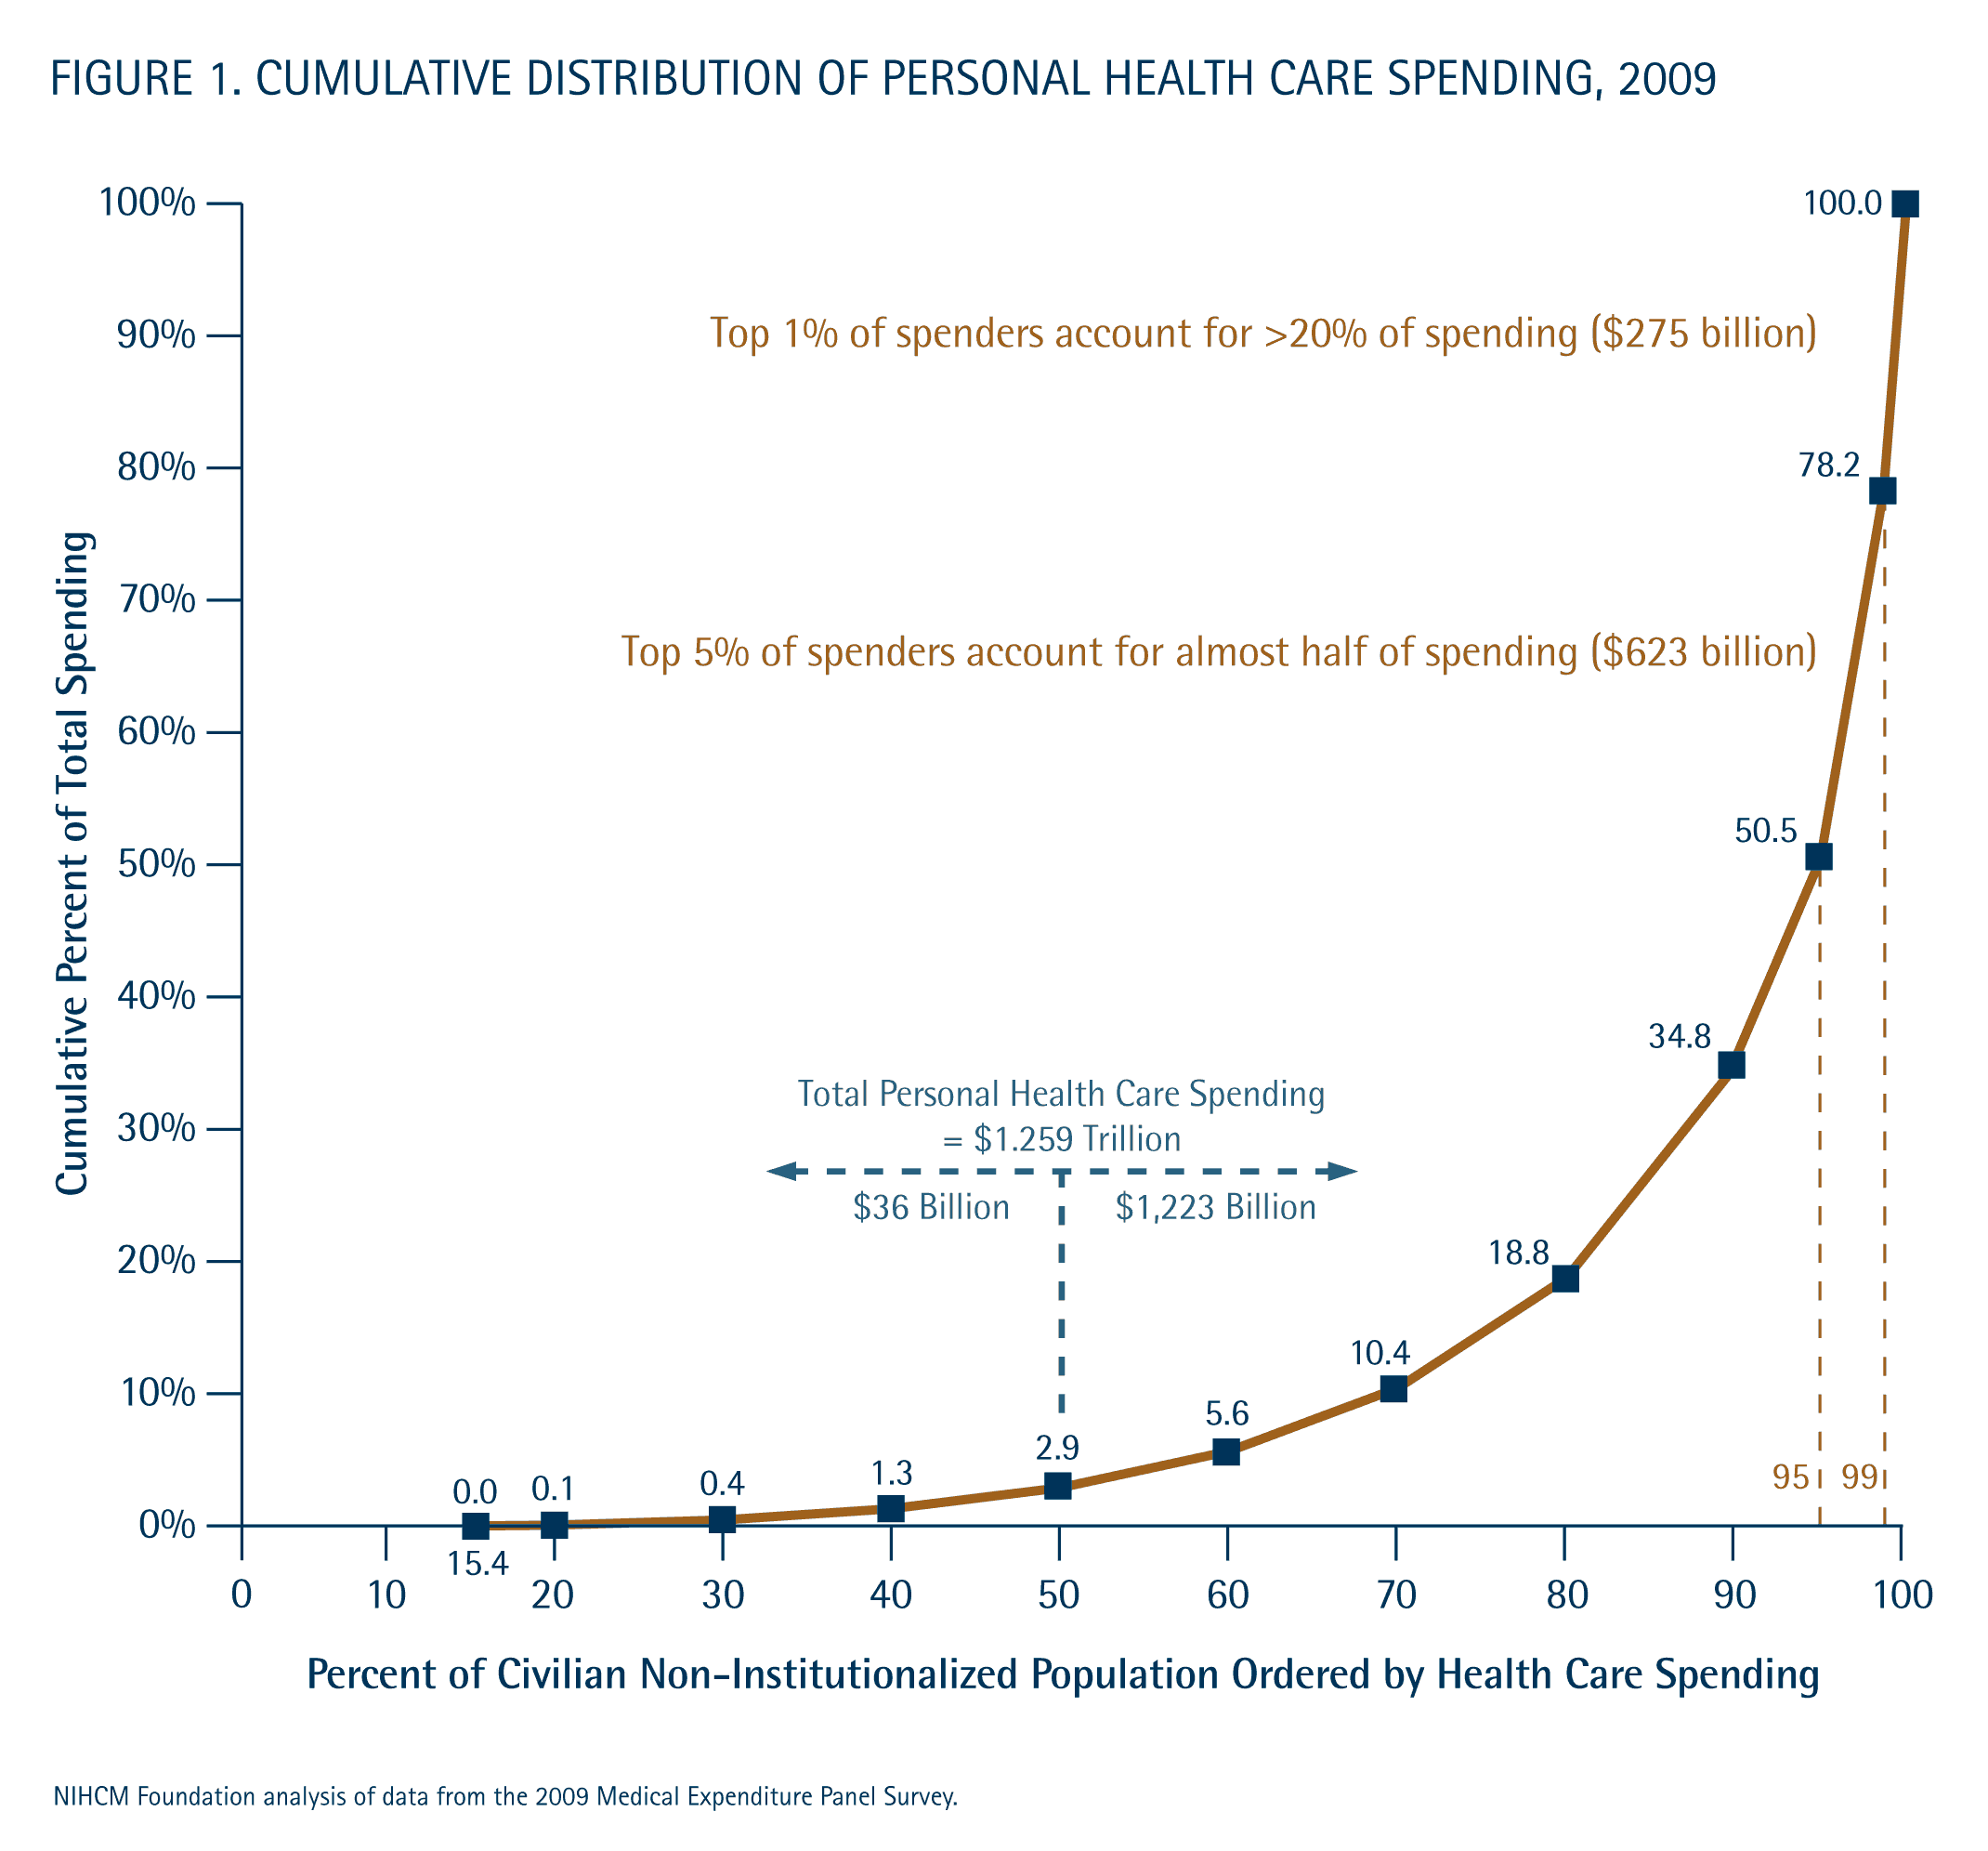
Rather, high deductible plans will, at best, lead to lower expenditures for initial doctor visits to determine if there is a problem, as the consumer will face 100% of those costs (when still within the deductible for the year). But as noted in the blog cited above, such expenditures are not where our medical costs primarily lie. The bottom 50% of the population only accounts for 3% of all medical expenditures, so even cutting these in half, say, would have an insignificant impact on overall costs. Indeed it might well lead to higher costs in the end, as visits to doctors are postponed and what would have been minor problems develop into something major.
14) Race to the bottom: Most working age Americans obtain their health insurance coverage through either their employer or the employer of their spouse (or parent, if a child). Most employers, and especially employers with 50 or more employees, offer health insurance coverage to their employees as part of their wage compensation package. Due to substantial tax advantages (as health insurance payments are not subject to income tax, while regular wages are), it is a good deal less expensive for the employer to offer health insurance coverage instead of not doing so and then paying the worker higher wages sufficient to allow them then to purchase on their own equivalent insurance. Those higher wages would be subject to income tax.
This system can provide health insurance at reasonable cost for firms with a high number of employees (say a few hundred employees or more). Such a large number of workers will provide a relatively unbiased sample of workers for the risk pool. If all of the workers and their families (both young and old, sick and not so sick) are enrolled, then a death spiral will not take hold. There would be no problem of free riders. While there are coverage issues for those not employed and for those working in small firms (too small to provide a reasonably diversified risk pool), the system worked well enough in the 1950s and 1960s for those employed at larger firms.
However, issues developed as more and more spouses entered into the work force. If both spouses worked for employers offering health insurance coverage, then the spouses could choose from which firm they would obtain their health insurance. Family plans are normally cheaper than two individual plans. The spouses would of course normally choose that plan which was most advantageous to them. That would be the plan of the employer offering the best benefits.
The result was that those employers offering the plans with the best benefits, which would also be the more expensive plans, would see families choose them rather than a less generous plan offered by the employer of the other spouse. The costs of the firms offering the more generous plans would then rise, as spouses switched to the better plans. The incentive, then, was for employers to offer less and less generous plans, in the hope that employees would choose to enroll in the health plan of the employer of the other spouse. This was a race to the bottom. The consequence is that employer sponsored health insurance plans have become less and less adequate in recent decades, compared to what they covered before.
The Obamacare reforms will address this partially by setting minimum standards for what a health insurance plan must cover, for it to be considered an acceptable health insurance plan. This will set a floor. However, the standards are not high, and there will remain pressures on firms to go down to that floor.
C. The Health Care Market
1) Bilateral Oligopoly: There are tens of thousands of health care providers in the US, and dozens of significant insurers. However, medical care markets are overwhelmingly local, so what matters is not the number of providers at the national level but rather at the local level. And medical care providers are of course divided into specialties. There may also only be a few hospitals which one can effectively reach, and possibly only one or two. As a result, when treatment in needed for some medical condition, one may effectively have only limited choices.
Similarly, there may be only a few insurers who offer insurance policies in any locality. This is in part due to regulatory reasons, as insurance companies are regulated in the US at the state level. As noted above, regulation of insurance is important to ensure that the companies maintain adequate capital to allow them to pay claims with a high degree of statistical confidence. But even without regulation at the state level, insurance companies will pick and choose which localities to focus their activities in, depending on their knowledge of that local market and the activities of their competitors.
The primary model of health insurance coverage now in the US is for the insurance company to establish a network of “preferred providers” of health care services in each local market, with strong financial incentives for their insurance customers to choose services from members of that network. The insurance company will negotiate payment rates with each member of that preferred provider network for the services they provide, with these payment rates well below the list prices (or “chargemaster” rates, when referring to hospitals) of those providers. Indeed, as noted in an earlier blog in this series on health care, the rate negotiated with the preferred provider can be sometimes be ten times (or even more) lower than the rate that same provider would charge for someone with a different insurer or with no insurer. There are therefore strong incentives to seek out services from members of the preferred provider network of your insurer.
(Health Maintenance Organizations, or HMOs, are also a common model of health care coverage in the US. There is an even more restrictive network of health care providers in an HMO, and the HMO will generally not cover any of the costs incurred when an out-of-network provider is used. In contrast, in a preferred provider network the health insurance will still cover some portion of the costs incurred when on out-of-network provider is used, but what is covered is much less than for an in-network provider. For the discussion below the distinction is not important, so for brevity it will be couched in terms of preferred provider networks.)
The rates paid for health care treatments are therefore largely determined in the negotiations between health insurers and the local health care providers in their preferred provider network. If there is only one insurer active in some region, that insurer will then have a good deal of leverage over providers to force them to accept low compensation rates. If the health care provider does not accept those rates, they will see few patients as the patients will instead seek out those providers who joined the preferred provider network at the compensation rate agreed to with the insurance company.
At the other extreme, if there is effectively only one health care provider in some locality for some medical specialty or service (say one large hospital), but a number of insurers, then those medical providers will have a great deal of leverage over the insurers to force them to accept the compensation rates they demand. The insurance company cannot offer health care coverage if the local hospitals or medical specialists refuse to work with them. The insurance company must then agree to compensate those health care providers at the rates they demand.
The result has been an arms race: Both health insurers on one side, and health care providers on the other side, will seek to merge and consolidate with others offering similar services in each local market across the US, in order to strengthen their bargaining position in these key negotiations. And that is what one has seen over the last two decades. Health insurers have merged at the national level or have bought up what were previously local or regional insurers, while doctor groups and especially hospitals have merged into chains.
This has led to what are now highly concentrated local markets. The American Medical Association (representing doctors) has been publishing a report each year for the last 12 years on concentration in health insurers in US states as well as in each of the metropolitan statistical areas of the US (metropolitan areas as defined by the US Bureau of the Census). The 2013 edition of the report (released in November 2013, and based on data for 2011) reported that health insurance markets would be deemed “highly concentrated” (based on the 2010 guidelines issued by the US Department of Justice and Federal Trade Commission) in 71% of the 388 metropolitan statistical areas of the US. They also noted that just two insurers accounted for over 50% (together) of the health insurance market in 45 of the 50 US states, and that just one insurer accounted for over 50% of the market in 15 states. The 2012 edition of the report noted that at least one insurer accounted for over 30% alone of the health insurance market in 89% of US metropolitan areas, and that just one insurer accounted for over 50% of the market in 38% of the US metropolitan areas. And concentration has increased further since these reports were prepared.
Health insurers have not surprisingly strongly criticized the AMA reports, and have responded with a commissioned report of their own, criticizing health care providers for high and increasing concentration among hospitals. This report concluded that hospital ownership is “highly concentrated” (by the guidelines of the US Department of Justice and Federal Trade Commission) in 80% of the US metropolitan statistical areas, and is “moderately concentrated” in a further 13% metro areas. And there was only one hospital in 11% of the metro areas.
So who is right in this debate? Actually, both are. US health insurance markets are highly concentrated by local area, as are the local markets for hospital services. And each side is racing to consolidate further. Monopolies are still rare in the local markets, but with only a few players on each side, the markets have developed into what economists term “bilateral oligopolies”, where a small number of suppliers (health care providers) must sell their services to a small number of buyers (health care insurers, acting on behalf of their insured clients).
Without further information, one cannot predict whether health insurers or health care providers will be more profitable in a situation of bilateral oligopoly. It will depend on their relative strength in each of the local markets, and this will vary from one market to the next depending on the local conditions. However, the party that will face high prices regardless will be the ultimate consumers. Suppose one is in a market where there are only a few local health care providers but many insurers. The few health care providers will have a great deal of negotiating leverage with the insurers, and can demand high prices for their services. The insurers, all of whom face these high prices, will then have to pass along these high prices to their insured customers in high premium rates.
Alternatively, suppose one is in a market where there are many health care providers (note this would be for each medical specialty as well as for hospital services), but only a few insurers (and maybe even effectively only one). The health insurers would then have a good deal of leverage to drive down the doctor and hospital rates. However, since there will then not be much (if any) competition among the health insurers (as there will be only a few and maybe effectively only one), there will be little or no competitive pressure to pass along these low prices to their insured customers. The insured customers will again face high prices.
There have therefore been strong incentives for the US health care market to evolve over recent decades into a system of local bilateral oligopolies, with health care providers on one side and health insurers on the other. There has been strong pressure on each to consolidate, and both have done so in an “arms race” like fashion. The result is now highly concentrated local markets, where your profitability depends on your ability to negotiate favorable prices. But whether it is the health insurers or the health care providers who win in these negotiations (and this will vary by locality), the consumer loses and ends up paying high prices. This is the major reason for the extremely high US health care costs, where the high prices in the US (compared to other countries) was discussed in earlier posts in this series on health care (see here and here).
2) Competing on Risk Pool Selection, and Other Sources of High Insurance Costs: In addition to high health care costs as a consequence of the largely unregulated bilateral oligopolies in most local markets in the US, health costs are high also due to the high administrative costs of private health insurers. Administrative costs are high since health insurers compete primarily on their ability to assemble networks of preferred providers of health care services in each locality (with prices negotiated with each provider for each possible service), as discussed immediately above, but also based on their ability to assemble a pool of insurees which excludes those who are of higher risk. The open individual health insurance exchanges will limit this under the Obamacare reforms (or at least shift it to more subtle games in how health insurance plans are structured, as discussed above), but at least until now, the focus on risk pool selection has led to high administrative expenses, since individual applicants had to be vetted.
Health insurance costs are high also because of the high salaries and other compensation paid to the CEOs and other senior management of the insurance companies, as documented in a previous post in this series on health care, as well as their high profitability. The result is administrative cost margins (which includes the net profits of the insurers in the data as assembled) of the private health insurers. As was discussed in the blog post just cited, in 2011 the administrative cost margin (including profits) of private health insurance came to 14.0% of the cost of benefits paid. The admin costs of private insurance companies were even higher for the programs they managed on behalf of government (such as the Medicare Advantage program of Medicare). Those costs came to 18.6% of benefits paid.
Since the government does not incur the high costs that private health insurers do as a consequence of seeking to bias the risk pool to those of lower risk and other such actions, nor pay out profits or high salaries to CEOs and other senior managers, the administrative cost margin for direct government administered health insurance programs are far below that of private insurers. As discussed in the blog post cited above, administrative costs for the Medicare programs the government administers directly was only 2.1% of benefits in 2011, far below the costs private insurers incur.
Total private administrative costs (including profits) of private health insurers came to $157.6 billion in 2011, based on the recently released new estimates of the National Health Expenditures data set of the Center for Medicare and Medicaid Services (CMS). Of this, $109.9 billion was spent on the administrative costs (including profits) of the private health insurers for their privately provided health insurance plans, and $47.7 billion was spent on the administrative costs (including profits) of the private health insurers for the government health insurance plans (primarily Medicare and Medicaid, but also others) that the private health insurers administer on behalf of the government.
If the costs of administering health insurance plans were at the low cost Medicare incurs (of 2.1%) rather than the 14.0% and 18.6% that the private insurers incur, the nation would have saved $135.7 billion in 2011. This is proportionately a huge savings in administrative costs, of 86%. Still, a savings of $135.7 billion should also be compared to the roughly $900 billion in savings one would have needed in 2011 for US health care costs in that year (out of total health care costs of $2.7 trillion in 2011) to fall, as a share of GDP, to what the second most expensive OECD country spends on health care (as discussed in an earlier blog post; note that total health care costs of $3.0 trillion are expected in 2014, so a one-third reduction would now be $1.0 trillion). The $135.7 billion in savings in 2011 would have been significant, but still only 15% of the overall savings needed.
D. Conclusion
US health care costs are high and excessive, compared to what any other country in the world spends on health care. These high costs are a consequence of the structure of the health care market in the US, with its focus on private health insurance plans. As discussed above, there are a number of reasons (including asymmetric information, adverse selection, free riders, and biased selection, as well as non-competitive local markets of bilateral oligopolies), for why private health insurance markets will act quite differently than what economists would call a “normal” market. They will not be efficient and low-cost. Rather, a reliance on a private health insurance focussed system has led to inefficiency and high costs, but also high profits for the insurers.
There therefore needs to be a fundamental change in the structure of these health care markets, and the incentives for how they operate, if one is to reduce US health care costs to what other countries in the world have been able to achieve. Future blog posts in this series on health reform will discuss what such a system might be.


You must be logged in to post a comment.