The Long-Term Damage From Keeping the Bush Tax Cuts

CBO Revenue Projections - Extended Baseline vs Alternative Fiscal Scenario, 2012to 2037

The US Senate has voted in favor of a package of measures to avert temporarily the so-called “fiscal cliff” (but in doing so, has set up a new cliff that will hit in two months).  As I write this, it is not yet clear whether the House of Representatives will vote to pass this compromise, or will try to amend it, or will attempt something else, but right now a vote appears imminent.

But there is one aspect of the deal which has not received much attention in at least the public discussion of what is being voted on:  While it is recognized that extending the Bush Tax Cuts will slash government revenues over the ten year period being discussed (2013 to 2022), little attention has been paid to the long term impact if the Bush Tax Cuts were made permanent.

The Bush Tax Cuts were originally passed under legislation where they would expire on December 31, 2010.  With the economy then still extremely weak, Obama signed legislation in December 2010 to extend the cuts for a further two years, to December 31, 2012.  Other recent tax measures (including in particular the effective rates for the Alternative Minimum Tax) also were set with an expiration date of December 31, 2012.  The issue being debated in the Congress is whether these tax cuts should be extended again, in whole or in part.  Both Obama and the Republicans have been in favor of extending them for most households.  The debate has centered on whether taxes should be allowed to revert to what they were during the Clinton years for households with incomes over $250,000 a year, over $450,000 a year, or over $1,000,000 a year, or some other number within that range.  This corresponds to extending the Bush Tax Cuts permanently for approximately 97% of the population ($250,000), 99.3% of the population ($450,000), or 99.7% of the population ($1,000,000).

The bill passed by the Senate would extend the Bush Tax Cuts permanently for the 99.3% of households earning up to $450,000 a year.  That is, almost everyone would continue to pay the lower tax cuts first passed during the Bush Administration.  Even the remaining 0.7% of the population would see their taxes fall similarly on their first $450,000 of income.  Beyond that, their marginal tax rates would revert to those that applied during the Clinton years.

Since the richest 0.7% earn so much more than the rest of us, there would still be a substantial increase in tax revenues paid.  The estimate is that the tax measures in the bill passed by the Senate would raise tax revenues by about $600 billion over the ten years 2013 to 2022 (i.e. by $60 billion per year).  There would have been an estimated extra $4.5 trillion in revenues over the ten years if the Bush Tax Cuts and the other tax measures had been all allowed to expire.  The $600 billion is only 13% of the $4.5 trillion.  That is, 87% of the Bush Tax Cuts (and related tax cuts) are made permanent.

The problem of what to do about the fiscal deficit over the next ten years will therefore largely remain.  As Jeff Sachs has noted in a recent column, without the revenues that will be lost by making the bulk of the Bush Tax Cuts permanent, it will be hard to pay for the basic government programs that most consider important.  But what few have noted is that extending the bulk of the Bush Tax Cuts not only hurts the fiscal balance for the next ten years, but makes the situation far worse beyond that.

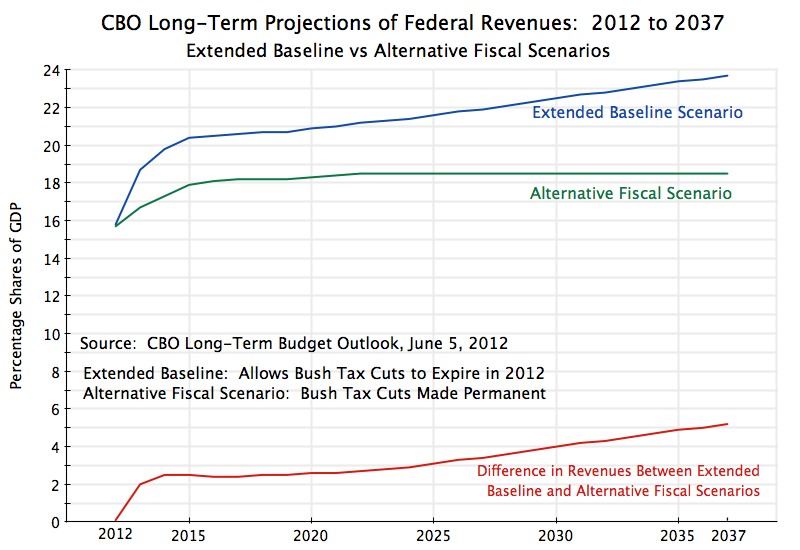
The graph above shows projected federal government revenues up to the year 2037 under two scenarios:  where the Bush Tax Cuts (and AMT and other related tax measures) are allowed to expire as scheduled (the Extended Baseline Scenario), and where these tax cuts are instead made permanent (the Alternative Fiscal Scenario).  The projections are from the Congressional Budget Office in their Long-Term Budget Outlook, of June 2012.  We do not yet have what the projections would be to 2037 under the Senate bill, where taxes are allowed to revert to previous levels only for those earning over $450,000.  However, since this would recover only 13% of the revenues that would be lost if the Bush Tax Cuts were extended for everyone, the curve would lie between the two shown above, but relatively close to the curve labeled the Alternative Fiscal Scenario.

If the tax cuts are made permanent for all, the CBO projects that federal revenues would recover over the next three years from their current very low levels (low due to the economic downturn), but then flatten out and not rise above 18.5% of GDP even in the very long term.  In contrast, if the tax cuts were allowed to expire for all, federal revenues would first recover, but then continue to rise slowly to 21% of GDP by 2021, to 22 1/2% of GDP by 2030, to 23 1/2% of GDP by 2036, and to continue on that rising path beyond that.

The increase in taxes as a share of GDP over time, were the Bush tax rates allowed to expire and revert to their previous levels, is interesting and important.  The tax share is projected by the CBO to increase because GDP is projected to grow over time, and under the previous tax regime the tax system was progressive, with higher incomes leading to higher tax rates and hence higher tax collections.  In contrast, under the tax regime brought on by the Bush Tax Cuts, the system is no longer progressive:  When GDP grows over time, those receiving the higher incomes will only pay taxes at rates similar to those who are poorer, so taxes as a share of GDP remains flat.

This loss in progressivity of the tax system may well be the most damaging aspect of the Bush Tax Cuts.  Relative to the previous system with progressivity, the tax cuts have led not only to a loss in revenues, but also to a system where on average higher incomes do not result in a higher rate of taxes on that higher income.  As Warren Buffett has noted, a person as rich as he is will pay, under the current tax system, a lower rate of taxes on average than his secretary.  This will not change significantly under the bill passed by the Senate.  And the losses in revenues as a share of GDP become steadily larger over time as the economy grows.

The losses in revenues are huge.  They start at about 2 1/2% of GDP from 2014 to 2020, but then rise to 4% of GDP by 2030 and to 5% of GDP by 2036.  Keep in mind that future governments could decide that such extra revenues are not needed.  If so, they could then  enact tax cuts of a size and structure suitable for the time.  But it is far easier to legislate tax cuts in the American political environment than it is to legislate tax increases when extra revenues are needed.

With the difficult long term fiscal outlook that most foresee for the US, an ability to raise adequate revenues will be critical to the country’s long-term financial stability.  But I should add that while this is a critical long-term problem, this does not mean that the Bush Tax Cuts should all end immediately, as they would have under the fiscal cliff.  Unemployment, while better than three years ago, remains high.  Rather, the optimal path would be to phase them out over the next few years.  A reasonable policy would be to link them to the unemployment rate.  To start, taxes would revert now to those of the Clinton period (when growth was solid, and the fiscal accounts moved to surplus) for those with income over $250,000.  Taxes would then revert to Clinton period rates for those with income of over $100,000, say, when the unemployment rate had fallen from the current 7.7% to a rate of perhaps 7%, and then taxes would revert for everyone once unemployment had fallen to below 6%.

But under the Senate passed bill, this will not happen.

Murder Rates, the NRA, and Households With Loaded Firearms


Murder Rate vs Firearms in HH, by State, 2002

Following the shooting at Sandy Hook Elementary School in Connecticut on December 14, in which 28 died including 20 school children aged 6 or 7, there has been a renewed call for more humane gun laws.  The early sense was that with such a tragedy, even the National Rifle Association (NRA) would be willing to work with others on measures to reduce the likelihood of this happening again, including measures to regulate access to military-style assault weapons and high capacity gun clips, which have no use other than mass slaughter.

Instead, in a press conference on December 21, the NRA came out forcefully against any measures that would limit access to such weapons or indeed any weapons.  They instead blamed violent video games and movies for such shootings, and called for armed guards to be posted in every school in the country.

The NRA remains unwilling to acknowledge that easy access to guns is associated with higher murder rates.  But the graph above shows that there is indeed a positive association.  It shows the relationship between the share of households in each state with a loaded firearm in the home and the murder rate in that state.  (The loaded firearm data comes from the 2002 BRFSS survey, discussed extensively below, while the murder rate data comes from the Uniform Crime Reporting Statistics of the US Department of Justice.  Note also that about two-thirds of murders in the US are done with firearms, so the graph above includes murders through other means as well.)  Despite the fact that the murder rate will be a result of many complex and different factors, the clear positive correlation with loaded firearms in the households is significant.  (Technically, the slope of the simple linear regression line is positive, with a t-statistic of 3.75.  At such a t-statistic, there is more than a 99.9% probability that the relationship is statistically true.)

I would hasten to add that while the relationship is statistically highly significant, such a simple analysis cannot tell us what the causation is.  That is, while easy availability of a loaded firearm in the household may be leading to more murders, it is also possible that states with a high murder rate will see a larger share of households keeping a loaded firearm in their home.  The extremely simple analysis here cannot discriminate between these two possibilities.

Clearly more careful work is needed on such questions, and I am sure there have been efforts at this elsewhere.  However, for an issue as important as this, where tragedies such as the Sandy Hook Elementary School shooting recur with disturbing regularity, the availability of such analysis is tragically limited.  And a major part of the reason is the lack of good data.

The lack of good data is not an accident.  You see on the graph above that the relationship shown is for 2002 – ten years ago.  The reason is that such state level data on firearm ownership is not readily available.  The figures for the graph above came from the Behavioral Risk Factor Surveillance System (BRFSS) survey for 2002 (the firearm results in the 2002 survey are discussed in this article).  The BRFSS is an annual survey, organized by the Centers for Disease Control and Prevention (CDC) in Atlanta, and is focussed on health.  It addresses issues of health status, health care access, personal behaviors that affect health status (such as exercise and diet), and the use of screenings (e.g. for cancer) and other health services.  The survey is a huge one (240,735 randomly selected adults answered the 2002 survey), and needs to be so large to be able to get valid state-level results.

The 2002 BRFSS survey had three questions on firearms ownership:  whether there was a firearm in the home, whether it was loaded, and whether it was unlocked as well as loaded.  The 2001 survey had only one question on firearms (whether there was a firearm in the home), and the 2004 survey had the same three questions as the 2002 survey.  No other BRFSS survey, before or since, has had questions on firearms access.  The BRFSS questionnaires are available here.

Why have the surveys on firearm ownership been so limited, despite the importance of the issue to the health of Americans?  The CDC has long sponsored research on the impact on health of factors such as smoking, seat belt use, and until the mid-1990s on the presence of firearms.  There were a number of interesting studies, including a widely read one published in 1993 in the New England Journal of Medicine that found that presence of a firearm in a household did not lead to greater protection for the residents, but actually increased the likelihood of an homicide by a factor of 2.7.

However, rather than responding to such scientific study by closer examination of the issue by experts, the NRA responded by having its supporters in Congress cut the CDC budget by the amount being spent on such research, and by inserting into its appropriation bills (still to this day) the requirement that “None of the funds made available for injury prevention and control at the Centers for Disease Control and Prevention may be used to advocate or promote gun control.”  (See the references here, here, and here.)  This would be analogous to the tobacco industry succeeding in blocking government support for research work on the health impacts of smoking.

The NRA and its allies in Congress have also deliberately constrained the ability of the Bureau of Alcohol, Tobacco, Firearms and Explosives to control illegal access to firearms through limiting the ATF budget, by formal constraints written by Congress into ATF legislation, and by blocking the approval in the Senate of any nominee for ATF Director.  The requirement of Senate approval of nominees to the post was only added recently, under the legislation that moved the ATF to the US Department of Justice from its previous position in the US Treasury.  This was part of the package of legislation that followed the 9/11 tragedy (which, among many other changes, created the new US Department of Homeland Security).  But since then, Senators have blocked the approval of any nomination of an ATF Director, blocking the nominees of both Bush and Obama.  As a result, the ATF has only had an Acting Director since 2006.  The legislated constraints on the ATF also include blocking it from releasing anything other than aggregate data to the public.  The ATF is not even allowed to computerize its own gun records.  Instead, paper files in cardboard boxes have to be used for the gun traces that the ATF is requested to do routinely by local law enforcement whenever a gun is recovered from a crime scene.  It is impossible to say how many criminals have gone free as a result.

And these legislative initiatives of the NRA to block research, to block assembling data to allow such research, and to hinder the enforcement of existing laws to solve crimes where guns were involved, have continued.  An article today in the Washington Post reported on the success of the NRA in inserting language into the Affordable Care Act (ObamaCare) which restricts doctors from asking patients on the ownership, possession, storage, or use of firearms or ammunition, and prohibits the government or anyone else from assembling or maintaining data on this (see pages 766 and 767 of this file of the text of the Affordable Care Act for the exact language).

With it impossible to assemble relevant data and with research hindered, the NRA can therefore say with a straight face that conclusive evidence does not exist that shows that controls on access to weapons lead to fewer homicides.  And as in the December 21 NRA press conference referred to above, the NRA can claim gun control efforts cannot work, while simultaneously asserting that a cause of the violence is violent video games and movies.

At this press conference, the NRA argued that the way to address gun violence such as the tragedy at Sandy Hook Elementary is to post armed guards in all of our schools.  With over 130,000 public and private schools (elementary through high school), that would be a lot of guards and loaded guns.  Such guards would need to have their weapons always close, with their fingers near the trigger, ready to fire on a moment’s notice on anyone they feel suspicious, before a would be shooter would have a chance to shoot the guard first.

And if this is what we need to do for our schools, then presumably the NRA also believes we need guards with loaded weapons at all our movie theaters (Aurora, Colorado, 12 dead), at our shopping malls (Portland, Oregon, 3 dead; Omaha, Nebraska, 9 dead), in every building on all our college campuses (VPI, 33 dead; University of Texas, 17 dead), at any meetings we have with our Congressional representatives (shooting of Congresswoman Gifford, 6 dead), at our community centers (Binghamton, New York, 14 dead), at cafeterias (Killeen, Texas, 23 dead), at fast food restaurants (McDonalds in California, 22 dead), and at other scenes of mass shootings in recent years, including our churches, synagogues, temples, and mosques; at hotels, cafes and restaurants, supermarkets, department stores, post offices, hair salons, Christian prayer rallies, and commuter trains; and at any work location where there may be a disgruntled worker.

The only thing we can be certain about with such a plan is that shooting deaths would rise.

The Example of Europe: Austerity Programs Are Indeed Contractionary


Europe GDP Growth, 2007Q4 to 2012Q3 - 1A.  Introduction

As the US comes closer to the so-called “fiscal cliff” (actually, more of a “fiscal slope”, as many have noted, as the impact will build over time rather than hit abruptly), it is worth reviewing the experience of Europe with the type of austerity programs that many are now pushing for the US.  The fiscal cliff we are now facing in the US is a manufactured crisis, created at the insistence of Republicans in August 2011 when they finally approved a higher statutory federal government debt limit.  It is a set of measures that will automatically enter into force on January 1, 2013, unless an agreement had been reached before then on actions to drastically cut back the federal deficit.

Unfortunately the debate underway in Washington is not on whether it is wise now (with the still weak economy) to enter into an austerity program of some sort.  Rather, it is solely on how severe that austerity program should be.  Any agreement will lead to a reduction in government spending and to increases in taxes, relative to what they would have been without the measures being negotiated.

The Republican argument is that adoption of such an austerity program is necessary for the US to be able to continue to grow.  Similar arguments were made in Europe.  Much of the continent has now adopted austerity programs, either willingly (such as in the UK) or due to pressure from other EU members and in particular pressure from the German government (such as in the cases of Greece, Spain, and Italy).  Our aim here is not to review in each case the reasons why the different countries may have chosen to adopt these austerity programs, which as noted was sometimes by policy choice and sometimes as a result of outside pressure.  Rather, the aim is to see what the impacts on growth have been since the programs were adopted (for whatever reason).

It is worth recalling what was said when these programs were first being pushed by prominent European authorities.  While critics forecast that such austerity programs would kill the incipient recoveries from the 2008/09 collapse (that started in the US and then spread globally), the European authorities in favor of these austerity programs argued that there was no need to worry.  They argued that such austerity programs would in fact be expansionary rather than contractionary.

The most prominent example is perhaps in the arguments made by the then President of the European Central Bank, Jean-Claude Trichet.  For example, in a June 2010 interview with La Repubblica (the largest circulation newspaper in Italy), Trichet said:

Trichet:  … As regards the economy, the idea that austerity measures could trigger stagnation is incorrect.

La Republicca:  Incorrect?

Trichet:  Yes. In fact, in these circumstances, everything that helps to increase the confidence of households, firms and investors in the sustainability of public finances is good for the consolidation of growth and job creation.  I firmly believe that in the current circumstances confidence-inspiring policies will foster and not hamper economic recovery, because confidence is the key factor today.

Trichet did not mis-speak.  He made a similar statement a month later in an interview with the newspaper Libération of France:

Libération:  Do the austerity plans announced amid monumental disarray by the Member States pose the risk of killing off the first green shoots of growth?

Trichet:  It is an error to think that fiscal austerity is a threat to growth and job creation. … Economies embarking on austerity policies that lend credibility to their fiscal policy strengthen confidence, growth and job creation.

But that has not been the case.

B.  The Larger European Economies, and Europe as a Whole

The figure above shows the paths of real GDP for the US, for several of the larger European economies, and for the Eurozone area as a whole, relative to the fourth quarter of 2007 (the peak before the start of the downturn in the US, and just before the start of the downturn in Europe, which for most was in the first quarter of 2008).  Some points to note:

  • The early path of the downturns were similar between the US and Europe, with a collapse in 2008 and into the first half of 2009, and then a start of a recovery with the stimulus packages adopted in the US as well as in much of Europe in 2009.
  • But then growth faltered in several of the European economies:  in mid-2010 in the UK, in early 2011 in the Netherlands, and more broadly in the 17 countries making up the Eurozone (who use the euro as their currency) in mid-2011.
  • The turnaround in the UK is particularly interesting for the US, as the UK (like the US) has its own currency and central bank, and can follow its own fiscal policy.  The abrupt end to the UK recovery in mid-2010 followed directly from new measures enacted by the then newly elected Conservative-led government (elected in May 2010, with initial emergency measures implemented from June, and a broader program implemented from October).  This was discussed in a previous blog post on this site.  Many of the Conservative government measures are similar to those being pushed by the Republicans in the US, with a sharp-cut back in government expenditures and in particular cuts in expenditures that provide support to the poor, accompanied by cuts in corporate taxes and more recently cuts in the top tax rates on the rich.
  • But while the Conservative Party argument for the UK austerity program was that this would lead to growth and to a reduction in government debt ratios, it is widely acknowledged now that the downturn that resulted from the austerity measures instead means that the program failed in terms of its originally stated objectives.  The austerity measures did not lead to an acceleration of growth, but rather to stagnation.  (And note that while there was an uptick in GDP by one percentage point in the third quarter of 2012, this has been attributed to the stimulus in spending resulting from the staging of the 2012 Olympics in London.  Indeed, the Bank of England in November, in its official forecast for the economy, noted GDP could fall back again in the fourth quarter of 2012 and downgraded its expected growth in 2013 to only 1%.)
  • Germany appears to be an exception, with a path followed for GDP above that of the US, although with a narrowing since mid-2011.  But while Germany has argued most strenuously and forcefully on the need for other European countries to follow austerity policies, its own internal government spending policies have been expansionary.  This is surprising given its rhetoric, and will be reviewed in a separate post on this blog which will be prepared after this one.  And it is also important to note that even with this performance, German GDP was only 2% higher in the third quarter of 2012 than it was in the first quarter of 2008, for a compound growth rate of only 0.4% per annum over four and a half years.
  • Each country has its own story, and it is not possible to review them all here.  But it is clear that for the Eurozone area as a whole, as well as for the UK but with the exception of Germany (which kept to expansionary government spending), the austerity programs launched in 2010 and 2011 have led to stagnation at best and falling output for most.

C.  Southern Europe and Ireland

There are two other groups of European economies where the response to austerity programs is of interest.  The first is the group of mostly Southern European economies were strict austerity policies were imposed as conditions of support programs from the IMF and the rest of Europe.  Funds were lent in these programs to those governments to enable them to continue to repay their creditors (who were in large part banks from Northern Europe).  This is the group affectionately known as the PIIGS, for Portugal, Italy, Ireland, Greece, and Spain.

The austerity measures led to collapses in output.  (A seasonally adjusted series is not available for Greece, but its path is clear.):

Europe GDP Growth, 2007Q4 to 2012Q3 - 2

D.  The Baltics

The other group of interest is the three small Baltic countries:  Estonia, Latvia, and Lithuania.  They were each severely impacted by the 2008/09 financial collapse, and each responded with stern austerity programs.  With strong growth over the last three years in each of them, these countries are sometimes held as examples of how austerity programs can lead to growth.  But this ignores the depth of the downturns that resulted from their austerity measures.  From the fourth quarter of 2007 to their troughs in 2009, GDP fell by 15% in Lithuania, by almost 20% in Estonia, and by an astounding 25% in Latvia.  There has been growth since then, but their current output remains far below where it was in 2007:

Europe GDP Growth, 2007Q4 to 2012Q3 - 3

Some have argued that the countries had no choice.  Estonia is a member of the Eurozone, and could not as a result depreciate an independent currency without leaving the Eurozone.  As in the other Eurozone members, monetary policy for Estonia is determined centrally by the European Central Bank, and fiscal policy is constrained by the extent to which the country will be able to borrow in the financial markets to finance any deficits.  But as noted above, the aim here is not to ascertain whether or not the countries had any policy choice on whether to follow some austerity program (or how severe that austerity program should have been), but rather what the impacts on growth have been of the austerity programs followed.  And the impacts have been negative.

Lithuania and Latvia had more scope in terms of policies they could have followed, since their currencies, while tied (by government decision) to some rate vis-a-vis the euro, are still independent currencies.  The governments could have chosen to devalue these currencies, which would have spurred their exports.  However, they decided not to, and instead decided to follow programs of severe fiscal austerity.  Output collapsed.

E.  Unemployment

The fall in output resulting from the austerity measures is bad enough by itself.  The loss in output is a loss in real resources, which could have been used for productive purposes.  But the tragedy is in fact much worse, as the pain from falling output is not spread evenly over the population, but rather is concentrated among a few.  In particular, those who lose their jobs and become unemployed see a drop not only in their current living standards, but for many also a permanent loss in their real standard of living, and for all a psychological burden as well.

It is therefore tragic to see how unemployment rates have risen, to almost 12% for the Eurozone as a whole, and to 26% in Spain and Greece following their particularly severe austerity programs:

European Unemployment Rates, Dec 2007 to Oct 2012F.  Conclusion

The austerity programs implemented in Europe killed the recoveries which were underway in 2009/2010, and led to double-dip recessions.  Unemployment had started to decline in the Eurozone area as a whole, but then rose following the new austerity programs, reaching a rate of almost 12% recently.  The US economy has so far fared better, with positive growth and a decline in the unemployment rate from a peak of 10.0% to a rate of 7.7% in November 2012.

But there is now the strong danger that if the negotiations under the threat of the fiscal cliff leads to new austerity measures, with expenditure cuts and tax increases starting in 2013 in order to reduce rapidly the federal fiscal deficit, that the consequences in the US will be similar to that which has been seen in Europe.