Impact of the New Tax Provisions: The Poor and Middle Classes Account for Most of the New Revenues

Tax Policy Center - Net Impact of Jan 1, 2013, Tax Law

The discussion on the new tax law, passed by the Senate late on December 31 and by the House late on January 1, focussed on whether income tax rates should have been allowed to revert to what they were during the Clinton years for the well off (incomes over $250,000), the rich (incomes over $450,000), or the extremely rich (incomes over $1,000,000).  The final law, which Obama said he will sign, sets the break at $450,000.

But there is much more in the new law as well.  Many of its provisions will affect the poor and middle classes, so the federal taxes they will pay will also go up in 2013.  Especially important will be the end to the 2% point reduction in the payroll tax rate, which has been in effect since the start of 2011.  These impacts have been less discussed, but in the aggregate they will account for substantially more of the revenues that will be generated than the impact of the reversion to previous income tax rates on incomes over $450,000.

The non-partisan Tax Policy Center has estimated what the impacts will be by household income level of the new law.  The analysis uses their microsimulation model.  The model is based on data from a large sample of actual tax returns, to determine what the different income sources are by category of household.  Hence it can determine with some accuracy the impact of changes in the tax code.

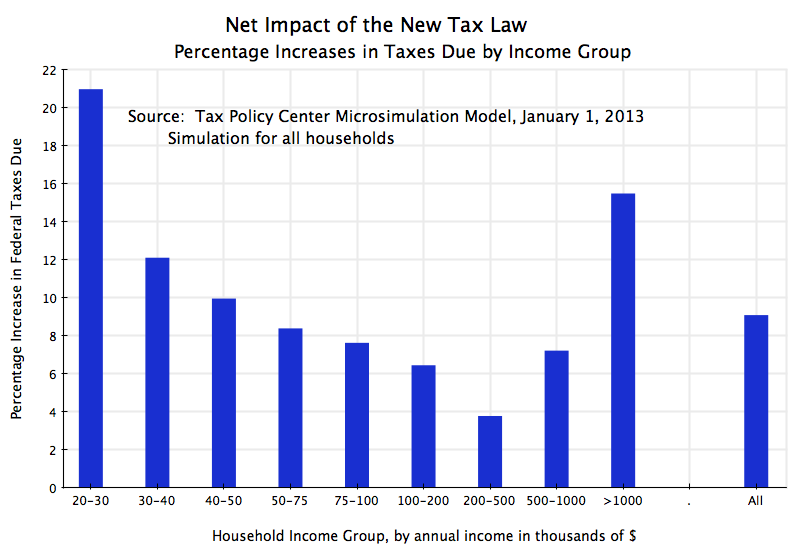
The graph above shows how much average taxes would rise in 2013 in percentage terms under the new law, for households classified by income category.  The Tax Policy Center also included two lower income groups (income of less than $10,000 per year, and income of $10,000 to $20,000 per year), but I have left these off of the graph.  Such very low levels of taxable income will be dominated by special groups, such as students with summer jobs, and may not be representative of actual households.  The official government poverty line for a family of four in 2012 was $23,050.  The taxes due are also quite small on average as one is averaging in many with a zero tax liability.  As a result, the percentage changes can be huge.  For those interested, the percentage increases that will result from the new tax law was 73% and 151% for the two groups, respectively.  But it is not clear that these figures are meaningful.

But the pattern seen among the other groups is significant, and interesting.  Those in the lowest income categories will see the largest percentage increases in their taxes due (by 21% for those earning between $20,000 and $30,000), with this then steadily declining to just a 3.8% increase for those earning between $200,000 and $500,000.  This then rises to an increase of 7.2% for those earning between $500,000 and $1,000,000, and to an increase of 15.5% for those earning over $1,000,000.

This is not terribly progressive.  Under a progressive scale, the percentage change would have been smallest for the poorest, and then rise steadily as one goes up the income scale to the richest.  But here one has the steepest increases for the poorest, with this declining steadily until one reaches an annual income of $500,000.  Only then does it start to rise.  And the percentage increase for those earning between $500,000 and $1,000,000 is less than the increase for those earning anything up to $100,000.  The percentage increase for those earning over $1,000,000 is less than the increase for those earning less than $30,000.

The reason for this is largely the impact of ending the 2% point reduction in the payroll tax. This had been introduced with effect from January 1, 2011, on the initiative of President Obama, as a mechanism to help especially the poor, as well as an economic incentive to businesses to hire more workers rather than use more machines (by reducing the relative cost of labor).  It would also have an especially strong stimulative effect, as the tax cut would be focused on relatively lower income workers who would likely spend most of the extra income, thus generating demand.  And while the 2% point reduction in the payroll tax was always viewed as temporary, some would question whether it is best to end it now, as opposed to next year or the year after.

The payroll tax is used to finance Social Security.  While the 2% point reduction was in effect, the US Treasury transferred an equal amount to the Social Security Trust Fund.  The amounts transferred were $103 billion in 2011 and an estimated $112 billion in 2012.  Projecting this forward, the amount needed would have been about $120 billion in 2013.  The figures underlying the graph above from the Tax Policy Center estimate that the aggregate increase in tax revenues in 2013 across all income groups (relative to what they would have been had 2012 law been extended into 2013) would have been about $200 billion ($199 billion to be more precise).  That is, the end of the 2% point reduction in the payroll tax accounts for 60% ($120 billion of the $200 billion) of the increase in revenues.  All the other changes, including the increase in the tax rates for those earning over $450,000, the phasing out of deductions and exemptions for households with incomes over $250,000, the increase in the capital gains tax rate to 20% from 15% for those earning over $450,000, and the other changes, only account for 40%.

Consistent with this, the Tax Policy Center figures indicate that 57% of the extra revenues generated will come from households of income $500,000 or less (they do not have a break point at $450,000).  Indeed, 33% comes from households of income of $100,000 or less.  Only 43% will come from households of income above $500,000.

The debate on this new tax law has centered on how much the rich should pay in taxes.  But the final law, as passed, is far from focussed only on taxes the rich.  The steepest increases will be borne by the poor, and the poor and middle classes will account for most of the revenues that will be raised.

The Long-Term Damage From Keeping the Bush Tax Cuts

CBO Revenue Projections - Extended Baseline vs Alternative Fiscal Scenario, 2012to 2037

The US Senate has voted in favor of a package of measures to avert temporarily the so-called “fiscal cliff” (but in doing so, has set up a new cliff that will hit in two months).  As I write this, it is not yet clear whether the House of Representatives will vote to pass this compromise, or will try to amend it, or will attempt something else, but right now a vote appears imminent.

But there is one aspect of the deal which has not received much attention in at least the public discussion of what is being voted on:  While it is recognized that extending the Bush Tax Cuts will slash government revenues over the ten year period being discussed (2013 to 2022), little attention has been paid to the long term impact if the Bush Tax Cuts were made permanent.

The Bush Tax Cuts were originally passed under legislation where they would expire on December 31, 2010.  With the economy then still extremely weak, Obama signed legislation in December 2010 to extend the cuts for a further two years, to December 31, 2012.  Other recent tax measures (including in particular the effective rates for the Alternative Minimum Tax) also were set with an expiration date of December 31, 2012.  The issue being debated in the Congress is whether these tax cuts should be extended again, in whole or in part.  Both Obama and the Republicans have been in favor of extending them for most households.  The debate has centered on whether taxes should be allowed to revert to what they were during the Clinton years for households with incomes over $250,000 a year, over $450,000 a year, or over $1,000,000 a year, or some other number within that range.  This corresponds to extending the Bush Tax Cuts permanently for approximately 97% of the population ($250,000), 99.3% of the population ($450,000), or 99.7% of the population ($1,000,000).

The bill passed by the Senate would extend the Bush Tax Cuts permanently for the 99.3% of households earning up to $450,000 a year.  That is, almost everyone would continue to pay the lower tax cuts first passed during the Bush Administration.  Even the remaining 0.7% of the population would see their taxes fall similarly on their first $450,000 of income.  Beyond that, their marginal tax rates would revert to those that applied during the Clinton years.

Since the richest 0.7% earn so much more than the rest of us, there would still be a substantial increase in tax revenues paid.  The estimate is that the tax measures in the bill passed by the Senate would raise tax revenues by about $600 billion over the ten years 2013 to 2022 (i.e. by $60 billion per year).  There would have been an estimated extra $4.5 trillion in revenues over the ten years if the Bush Tax Cuts and the other tax measures had been all allowed to expire.  The $600 billion is only 13% of the $4.5 trillion.  That is, 87% of the Bush Tax Cuts (and related tax cuts) are made permanent.

The problem of what to do about the fiscal deficit over the next ten years will therefore largely remain.  As Jeff Sachs has noted in a recent column, without the revenues that will be lost by making the bulk of the Bush Tax Cuts permanent, it will be hard to pay for the basic government programs that most consider important.  But what few have noted is that extending the bulk of the Bush Tax Cuts not only hurts the fiscal balance for the next ten years, but makes the situation far worse beyond that.

The graph above shows projected federal government revenues up to the year 2037 under two scenarios:  where the Bush Tax Cuts (and AMT and other related tax measures) are allowed to expire as scheduled (the Extended Baseline Scenario), and where these tax cuts are instead made permanent (the Alternative Fiscal Scenario).  The projections are from the Congressional Budget Office in their Long-Term Budget Outlook, of June 2012.  We do not yet have what the projections would be to 2037 under the Senate bill, where taxes are allowed to revert to previous levels only for those earning over $450,000.  However, since this would recover only 13% of the revenues that would be lost if the Bush Tax Cuts were extended for everyone, the curve would lie between the two shown above, but relatively close to the curve labeled the Alternative Fiscal Scenario.

If the tax cuts are made permanent for all, the CBO projects that federal revenues would recover over the next three years from their current very low levels (low due to the economic downturn), but then flatten out and not rise above 18.5% of GDP even in the very long term.  In contrast, if the tax cuts were allowed to expire for all, federal revenues would first recover, but then continue to rise slowly to 21% of GDP by 2021, to 22 1/2% of GDP by 2030, to 23 1/2% of GDP by 2036, and to continue on that rising path beyond that.

The increase in taxes as a share of GDP over time, were the Bush tax rates allowed to expire and revert to their previous levels, is interesting and important.  The tax share is projected by the CBO to increase because GDP is projected to grow over time, and under the previous tax regime the tax system was progressive, with higher incomes leading to higher tax rates and hence higher tax collections.  In contrast, under the tax regime brought on by the Bush Tax Cuts, the system is no longer progressive:  When GDP grows over time, those receiving the higher incomes will only pay taxes at rates similar to those who are poorer, so taxes as a share of GDP remains flat.

This loss in progressivity of the tax system may well be the most damaging aspect of the Bush Tax Cuts.  Relative to the previous system with progressivity, the tax cuts have led not only to a loss in revenues, but also to a system where on average higher incomes do not result in a higher rate of taxes on that higher income.  As Warren Buffett has noted, a person as rich as he is will pay, under the current tax system, a lower rate of taxes on average than his secretary.  This will not change significantly under the bill passed by the Senate.  And the losses in revenues as a share of GDP become steadily larger over time as the economy grows.

The losses in revenues are huge.  They start at about 2 1/2% of GDP from 2014 to 2020, but then rise to 4% of GDP by 2030 and to 5% of GDP by 2036.  Keep in mind that future governments could decide that such extra revenues are not needed.  If so, they could then  enact tax cuts of a size and structure suitable for the time.  But it is far easier to legislate tax cuts in the American political environment than it is to legislate tax increases when extra revenues are needed.

With the difficult long term fiscal outlook that most foresee for the US, an ability to raise adequate revenues will be critical to the country’s long-term financial stability.  But I should add that while this is a critical long-term problem, this does not mean that the Bush Tax Cuts should all end immediately, as they would have under the fiscal cliff.  Unemployment, while better than three years ago, remains high.  Rather, the optimal path would be to phase them out over the next few years.  A reasonable policy would be to link them to the unemployment rate.  To start, taxes would revert now to those of the Clinton period (when growth was solid, and the fiscal accounts moved to surplus) for those with income over $250,000.  Taxes would then revert to Clinton period rates for those with income of over $100,000, say, when the unemployment rate had fallen from the current 7.7% to a rate of perhaps 7%, and then taxes would revert for everyone once unemployment had fallen to below 6%.

But under the Senate passed bill, this will not happen.

Murder Rates, the NRA, and Households With Loaded Firearms


Murder Rate vs Firearms in HH, by State, 2002

Following the shooting at Sandy Hook Elementary School in Connecticut on December 14, in which 28 died including 20 school children aged 6 or 7, there has been a renewed call for more humane gun laws.  The early sense was that with such a tragedy, even the National Rifle Association (NRA) would be willing to work with others on measures to reduce the likelihood of this happening again, including measures to regulate access to military-style assault weapons and high capacity gun clips, which have no use other than mass slaughter.

Instead, in a press conference on December 21, the NRA came out forcefully against any measures that would limit access to such weapons or indeed any weapons.  They instead blamed violent video games and movies for such shootings, and called for armed guards to be posted in every school in the country.

The NRA remains unwilling to acknowledge that easy access to guns is associated with higher murder rates.  But the graph above shows that there is indeed a positive association.  It shows the relationship between the share of households in each state with a loaded firearm in the home and the murder rate in that state.  (The loaded firearm data comes from the 2002 BRFSS survey, discussed extensively below, while the murder rate data comes from the Uniform Crime Reporting Statistics of the US Department of Justice.  Note also that about two-thirds of murders in the US are done with firearms, so the graph above includes murders through other means as well.)  Despite the fact that the murder rate will be a result of many complex and different factors, the clear positive correlation with loaded firearms in the households is significant.  (Technically, the slope of the simple linear regression line is positive, with a t-statistic of 3.75.  At such a t-statistic, there is more than a 99.9% probability that the relationship is statistically true.)

I would hasten to add that while the relationship is statistically highly significant, such a simple analysis cannot tell us what the causation is.  That is, while easy availability of a loaded firearm in the household may be leading to more murders, it is also possible that states with a high murder rate will see a larger share of households keeping a loaded firearm in their home.  The extremely simple analysis here cannot discriminate between these two possibilities.

Clearly more careful work is needed on such questions, and I am sure there have been efforts at this elsewhere.  However, for an issue as important as this, where tragedies such as the Sandy Hook Elementary School shooting recur with disturbing regularity, the availability of such analysis is tragically limited.  And a major part of the reason is the lack of good data.

The lack of good data is not an accident.  You see on the graph above that the relationship shown is for 2002 – ten years ago.  The reason is that such state level data on firearm ownership is not readily available.  The figures for the graph above came from the Behavioral Risk Factor Surveillance System (BRFSS) survey for 2002 (the firearm results in the 2002 survey are discussed in this article).  The BRFSS is an annual survey, organized by the Centers for Disease Control and Prevention (CDC) in Atlanta, and is focussed on health.  It addresses issues of health status, health care access, personal behaviors that affect health status (such as exercise and diet), and the use of screenings (e.g. for cancer) and other health services.  The survey is a huge one (240,735 randomly selected adults answered the 2002 survey), and needs to be so large to be able to get valid state-level results.

The 2002 BRFSS survey had three questions on firearms ownership:  whether there was a firearm in the home, whether it was loaded, and whether it was unlocked as well as loaded.  The 2001 survey had only one question on firearms (whether there was a firearm in the home), and the 2004 survey had the same three questions as the 2002 survey.  No other BRFSS survey, before or since, has had questions on firearms access.  The BRFSS questionnaires are available here.

Why have the surveys on firearm ownership been so limited, despite the importance of the issue to the health of Americans?  The CDC has long sponsored research on the impact on health of factors such as smoking, seat belt use, and until the mid-1990s on the presence of firearms.  There were a number of interesting studies, including a widely read one published in 1993 in the New England Journal of Medicine that found that presence of a firearm in a household did not lead to greater protection for the residents, but actually increased the likelihood of an homicide by a factor of 2.7.

However, rather than responding to such scientific study by closer examination of the issue by experts, the NRA responded by having its supporters in Congress cut the CDC budget by the amount being spent on such research, and by inserting into its appropriation bills (still to this day) the requirement that “None of the funds made available for injury prevention and control at the Centers for Disease Control and Prevention may be used to advocate or promote gun control.”  (See the references here, here, and here.)  This would be analogous to the tobacco industry succeeding in blocking government support for research work on the health impacts of smoking.

The NRA and its allies in Congress have also deliberately constrained the ability of the Bureau of Alcohol, Tobacco, Firearms and Explosives to control illegal access to firearms through limiting the ATF budget, by formal constraints written by Congress into ATF legislation, and by blocking the approval in the Senate of any nominee for ATF Director.  The requirement of Senate approval of nominees to the post was only added recently, under the legislation that moved the ATF to the US Department of Justice from its previous position in the US Treasury.  This was part of the package of legislation that followed the 9/11 tragedy (which, among many other changes, created the new US Department of Homeland Security).  But since then, Senators have blocked the approval of any nomination of an ATF Director, blocking the nominees of both Bush and Obama.  As a result, the ATF has only had an Acting Director since 2006.  The legislated constraints on the ATF also include blocking it from releasing anything other than aggregate data to the public.  The ATF is not even allowed to computerize its own gun records.  Instead, paper files in cardboard boxes have to be used for the gun traces that the ATF is requested to do routinely by local law enforcement whenever a gun is recovered from a crime scene.  It is impossible to say how many criminals have gone free as a result.

And these legislative initiatives of the NRA to block research, to block assembling data to allow such research, and to hinder the enforcement of existing laws to solve crimes where guns were involved, have continued.  An article today in the Washington Post reported on the success of the NRA in inserting language into the Affordable Care Act (ObamaCare) which restricts doctors from asking patients on the ownership, possession, storage, or use of firearms or ammunition, and prohibits the government or anyone else from assembling or maintaining data on this (see pages 766 and 767 of this file of the text of the Affordable Care Act for the exact language).

With it impossible to assemble relevant data and with research hindered, the NRA can therefore say with a straight face that conclusive evidence does not exist that shows that controls on access to weapons lead to fewer homicides.  And as in the December 21 NRA press conference referred to above, the NRA can claim gun control efforts cannot work, while simultaneously asserting that a cause of the violence is violent video games and movies.

At this press conference, the NRA argued that the way to address gun violence such as the tragedy at Sandy Hook Elementary is to post armed guards in all of our schools.  With over 130,000 public and private schools (elementary through high school), that would be a lot of guards and loaded guns.  Such guards would need to have their weapons always close, with their fingers near the trigger, ready to fire on a moment’s notice on anyone they feel suspicious, before a would be shooter would have a chance to shoot the guard first.

And if this is what we need to do for our schools, then presumably the NRA also believes we need guards with loaded weapons at all our movie theaters (Aurora, Colorado, 12 dead), at our shopping malls (Portland, Oregon, 3 dead; Omaha, Nebraska, 9 dead), in every building on all our college campuses (VPI, 33 dead; University of Texas, 17 dead), at any meetings we have with our Congressional representatives (shooting of Congresswoman Gifford, 6 dead), at our community centers (Binghamton, New York, 14 dead), at cafeterias (Killeen, Texas, 23 dead), at fast food restaurants (McDonalds in California, 22 dead), and at other scenes of mass shootings in recent years, including our churches, synagogues, temples, and mosques; at hotels, cafes and restaurants, supermarkets, department stores, post offices, hair salons, Christian prayer rallies, and commuter trains; and at any work location where there may be a disgruntled worker.

The only thing we can be certain about with such a plan is that shooting deaths would rise.