
|
|||||||||||||||||||||||||||||||||||||||||||||||||||||||||||||||||||||||||||||||
Obama has been called a socialist by his conservative critics. He has been deemed anti-business and anti-private profit. Were this the case, business would be suffering and equity prices would be depressed. Yet corporate profits are now at record highs. This was shown and discussed in an earlier post on this blog. More recent figures are following the same upward trend, and are available in the National Income and Product Accounts produced by the BEA of the US Department of Commerce.
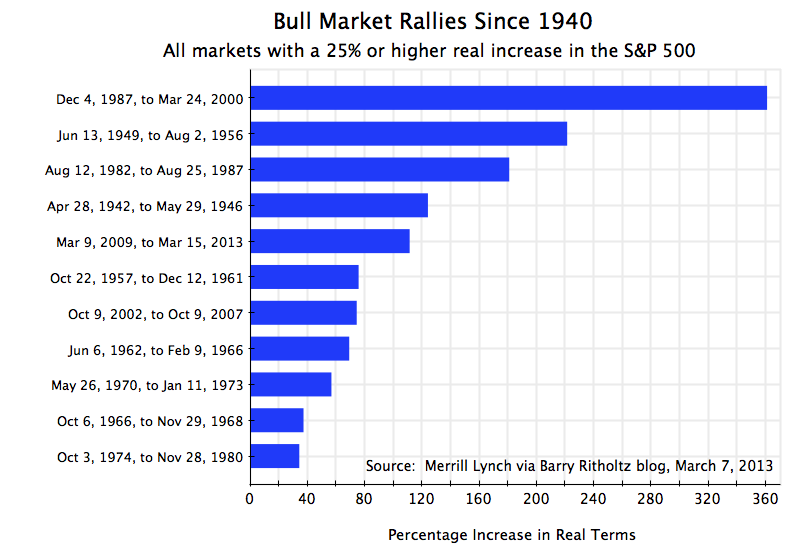
With profits at record highs, it will be a surprise only to those conservative critics that the stock market has been booming under Obama. But what few might realize is the extent of the rally under Obama. The current stock market rally is already the fifth largest of any stock market rally since 1940. It is also still underway, while the others of course are not, so it may well move up in rank.
The chart and table above show the numbers. The underlying figures were compiled by Merrill Lynch, and are available at the financial blog of Barry Ritholtz (the Merrill Lynch study itself appears to be available only privately to its clients, like much of the research of such brokerages). For the numbers above I determined also the figures controlling for inflation (the originals were only in nominal terms), using the monthly CPI for the inflation index (from the BLS via FRED), and then ranked the rallies by the total returns in real terms. I also updated the figures on the current rally to the numbers at market close on March 15. The rallies shown are all those since 1940 (a total of 11) in which there was at least a 25% gain in nominal terms, which ended with a fall (a “correction”, as investors like to say) of at least 20%.
As noted, the Obama rally currently ranks number five on this list. It began on March 9, 2009 (only six weeks from Obama’s inauguration on January 20), and as of Friday, March 15, 2013, the S&P 500 was 112% higher (in real terms) than where it was at the start. Also noteworthy is the real rate of growth of 21% (at an annualized rate) over this four year period. Of the 11 stock market rallies since 1940, this was the third fastest rate of growth, and only slightly below the rate of growth of the two faster rallies.
Depending on how long the current rally continues, the Obama bull market could well move up in rank. While the market fell a bit on Friday as well as on Monday and was basically flat today (Tuesday), prior to that it had risen for 10 straight days. This was the longest such daily streak since 1996. While no one can predict what will happen to this rally, the increase achieved is already one for the records.
The assertions of the conservative critics that Obama is anti-business and has taken actions that suppress profits are therefore simply inconsistent with what the markets are telling us. If this criticism of Obama had any basis, one would not be seeing such a rally in the markets. Conservatives argue that the markets cannot be fooled, but here they are themselves ignoring what the markets are saying.
Of greater concern is not what has happened to profits, and share prices that reflected those profits, but rather what has happened to workers and their wages. Unemployment is still high, at 7.7%. While down from the peak of 10.0% reached in 2009 following the economic and financial collapse at the end of the Bush administration, a 7.7% unemployment rate is still well above the 5 to 6% rate one would see when the economy is at or close to full employment (there is always some unemployment, due to various frictions and mis-matches). The recovery has been weak, and as has been discussed before in this blog, the weak recovery can be explained by the continued fiscal drag from cuts in government expenditures.
With the still high unemployment, it should not be surprising that workers have not had the power to bargain for substantial wage increases. As was shown in the chart at the top of the recent post in this blog on the minimum wage, real compensation of workers has been flat to falling in recent years. Yet as also seen in that chart, labor productivity has continued to rise. With rising productivity but flat to falling wages, profits will rise. Hence the economy has been good for profits and for a rising stock market.
The basic issue is that despite the assertions of the conservative critics that Obama has been fundamentally altering our economic structure, the truth is that Obama has not. This is still an economy where wages have been depressed, rising well less than productivity growth since the 1980s. Real average labor compensation (which includes both wages as well as compensation via benefits such as health insurance and pension plans) rose only by 35% between 1980 and 2012 (see the chart at the blog post cited above), for a growth rate of slightly below 1.0% a year. But labor productivity grew by 86% over this period. With productivity up, but wages almost flat, profits are far up. And with profits mostly going to the already rich, the distribution of income has deteriorated sharply since Reagan was president.
Obama’s policies have not been bad for profits nor for the stock market. The stock market rally is already one of the biggest since 1940, and is not yet over. There is no evidence for the assertion that Obama has fundamentally changed the economic structure, to the detriment of business. The problem, rather, is that Obama has not changed that structure. As a result, and as has been the case since around 1980, labor has not been able to share fully in the gains from the growth in labor productivity.

You must be logged in to post a comment.