
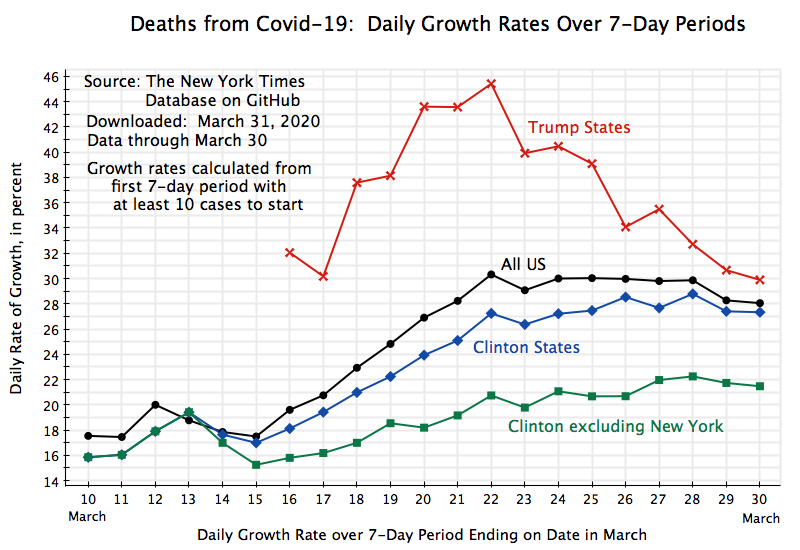
Deaths from Covid-19 have been growing at an extremely rapid rate. The chart above shows what those rates have been in the month of March, averaged over seven day periods to smooth out day-to-day fluctuations. The figures are for the daily rate of growth over the seven day period ending on the date indicated. The curves start in the first period when there were at least 10 cases, which was on March 3 for the US as a whole. Hence the first growth rate shown is for the one week period of March 3 to 10. As I will discuss below, the chart has not only the growth rates for the US as a whole but also for the set of states that Trump won in 2016 and for the set that Clinton won. They show an obvious pattern.
The data come from the set assembled by The New York Times, based on a compilation of state and local reports. The Times updates these figures daily, and has made them available through the GitHub site. And it provides a summary report on these figures, with a map, at least daily.
I emphasize that the figures are of daily growth rates, even though they are calculated over one week periods. And they are huge. For the US as a whole, that rate was just over 28% a day for the seven day period ending March 30. It is difficult to get one’s head around such a rapid rate of growth, but a few figures can be illustrative. In the New York Times database, 3,066 Americans had died of Covid-19 as of March 30. If the 28% rate of growth were maintained, then the entire population of the US (330 million) would be dead by May 16. For many reasons, that will not happen. The entire population would have been infected well before (if there was nothing to limit the spread) and it is fatal for perhaps 1% of those infected. And the 99% infected who do not die develop an immunity, where once they recover they cannot spread the virus to others. For this reason as well, 100% of those not previously exposed will not catch the virus. Rather, it will be some lower share, as the spread becomes less and less likely as an increasing share of the population develops an immunity. This is also the reason why mass vaccination programs are effective in stopping the spread of a virus (including to those not able to receive a vaccination, such as very young children or those with compromised immune systems).
So that 28% daily rate of growth has to come down, preferably by policy rather than by running out of people to infect. And there has been a small reduction in the last two days (the seven day periods ending March 29 and March 30), with the rate falling modestly to 28% from a 30% rate that had ruled since the seven day period ending March 22. But it has much farther to go to get to zero.
The recent modest dip might be an initial sign that the social distancing measures that began to be put in place around parts of the nation by March 16 are having a positive effect (and where many individuals, including myself, started social distancing some time before). It is believed that it takes about 4 to 7 days after being infected before one shows any symptoms, and then, in those cases where the symptoms are severe and require hospitalization (about 20% of the total), another several days to two weeks before it becomes critical for those where it will prove fatal. Hence one might be starting to see the impacts of the policies about now.
But the social distancing measures implemented varied widely across the US. They were strict and early in some locales, and advisory only and relatively late in other locales. Sadly, Trump injected a political element into this. Trump belittled the seriousness of Covid-19 until well into March, even calling Covid-19 a “hoax” conjured up by the Democrats while insisting the virus soon would go away. And even since mid-March Trump has been inconsistent, saying on some days that it needs to be taken seriously and on others that it was not a big deal. Fox News and radio hosts of the extreme right such as Rush Limbaugh also belittled the seriousness of the virus.
It is therefore understandable that Trump supporters and those who follow such outlets for what they consider the news, have not shown as much of a willingness to implement the social distancing measures that are at this point the only way to reduce the spread of the virus. And it shows in the death figures. The red curve in the chart at the top of this post shows the daily growth rates of fatalities from this virus in those states that voted for Trump in the 2016 election. While the spread of the virus in these states, many of which are relatively rural, started later than in the states that voted for Clinton, their fatalities from the virus have since grown at a substantially faster pace.
The pace of growth in the states that voted for Clinton has also been heavily influenced by the rapid spread of the virus in New York. As of March 30, more than half (57%) of the fatalities in the Clinton states was due to the fatalities in New York alone. And New York is a special case. With its dense population in New York City, where a high proportion use a crowded subway system or buses to commute to work, with the work then often in tall office buildings requiring long rides in what are often crowded elevators, it should not be surprising that a virus that goes person to person could spread rapidly.
Excluding New York, the rate of increase in the other states that voted for Clinton (the curve in green in the chart above) is more modest. The rates are also then even more substantially lower than those in the Trump-voting states.
But any of these growth rates are still incredibly high, and must be brought down to zero quickly. That will require clear, sustained, and scientifically sound policy, from the top. But Trump has not been providing this.

You must be logged in to post a comment.