
 A. Urban Concentration and Covid-19 Cumulative Deaths as of May 3
The virus that causes Covid-19, like other such viruses, spreads person to person. Thus one should expect that there will be a more rapid pace of spread in urban areas, where people are in closer day-to-day contact. This is not an indication of what the ultimate spread might be, as catching an infectious disease is a one-time event and contacts with others still add up over time. It is just that instead of encountering a certain number of people in one day, it might instead take several days or even weeks. But greater person-to-person contact increases the likelihood that one will catch the disease earlier.
Thus one should expect that at this point in the middle of the spread of Covid-19, those states that are more highly urbanized will have seen a greater number of deaths from the disease (per unit of population) than states that are more rural. And that is indeed what one finds, although with some interesting exceptions.
The chart above shows the number of deaths in each US state per million of population, plotted against the percentage share of the urban population in the state. The share of the state’s population that is defined as residing in an “urban” area comes from the US Census Bureau, which applies a very specific (and uniform) definition of what it labels as urban. The calculations are based on what the Census Bureau defines as “urbanized areas”. Under this definition, the urban population is the total population in the state living in an area with a dense urban core, including in the surrounding (suburban) areas meeting certain population density requirements, and with a total population within that area of 50,000 or more. (Note that the Census Bureau also has a broader concept of what it considers “urban” that includes communities down to a population of 2,500. Statements on urban populations in states are often based on this broader definition.)
While this is the best one can do in defining what it means to be living in an urban area, note that it is still highly imperfect for the purposes here. Urban areas differ greatly. The day-to-day contact one would experience in New York is quite different from what would normally find in a city of 50,000. Even comparing similarly large cities, it will be quite different between New York and, say, Los Angeles. Still, it is of interest to see whether states with a higher share of their population living in urbanized areas, as defined by the Census Bureau, have at this point in the spread of Covid-19 experienced a higher fatality rate from the disease.
The chart indicates that in general they have. The data on the number of deaths from Covid-19 comes from the data set maintained by the New York Times, with the figures as of May 3, 2020 (and downloaded in the afternoon of May 4). The Census Bureau figures on state total populations and on those living within urbanized areas (of 50,000 or more) are all from the 2010 census. While these are now ten years old and will be updated once the 2020 census is completed, for the purposes of this exercise they more than suffice. The relative populations across states will not have changed all that much.
At this point in the pandemic, states with urban population shares of up to almost 60% have uniformly relatively low (as compared to other states) death rates from Covid-19 per million of population, with all at about 100 or less (Mississippi is at 102). Half the states (25 of the 51 including Washington, DC, as a 51st) fall into this category, with their names on the chart crowded and overlapping. For those interested, the figures for individual states can be found in a table at the bottom of this post.
The states with urban population shares of just below 60% (Indiana) up to 80% then show more variety. The fatality rates are very low for some (e.g. Hawaii, at 12.5 per million with an urban share of 71.5%) and substantially higher for others (e.g. Louisiana, at 434 per million and an urban share of 61%).
But the most substantial variation is seen in those states with an urban share of 80% or more. The fatality rate at this point in the pandemic is just 18 per million in Utah despite an urban share of 81%, while it is close to 1,000 per million in the state of New York with an urban share of 83%. Several other states in this group also have relatively low fatality rates, including California, Arizona, Nevada, and Florida. Thus while there is a clear association seen between a higher share of a state’s population living in an urbanized area and the deaths per million from Covid-19, that relationship is not fate. There are important exceptions.
The broad range in cumulative death rates among the states with the higher urban population shares is a consequence of several factors. While it is not surprising that a higher urban share appears to make a location more vulnerable to a rapid spread of the virus, it is also clear that it is not inevitable. There are a number of exceptions. California, while vulnerable, imposed state-wide lockdown orders relatively early, for example. The Utah public health system has also functioned particularly well. And the state totals may be consistent with some very limited evidence (but disputed, and far from certain) that the virus that causes Covid-19 might spread less in warmer and moderately humid environments. This might in part explain the low rates seen, despite high urbanized shares, in Arizona, California, Florida, and Nevada, as well as in Texas and Hawaii.
At the other end, the areas around New York City (in the states of New York, New Jersey, and Connecticut) saw an early and rapid spread of the virus before many were aware of it. Based on analysis of the genome, researchers have found that the virus found there had in most cases arrived from Europe rather than directly from China. Furthermore, they found that it was introduced to the New York area from multiple independent sources (i.e. not from just one traveler) and that it may well have arrived already in January. There has also been a recent report that the virus had already been introduced into Europe as early as late December. A recent analysis of a sample of bodily fluids taken from a French man living in the Paris region, who went to a local hospital on December 27 with a case of suspected pneumonia, indicated that he in fact had the virus that causes Covid-19. He had not traveled abroad.
Thus bad luck can also play a role. A region with a high degree of urban concentration (such as New York), with frequent travelers to and from a region where the disease had spread but where this was not known at the time (Europe), would be particularly susceptible to a highly infectious viral disease such as Covid-19.
Florida may be a surprising case. It is a state with a relatively high share (87%) of its population residing in urbanized areas (as defined by the Census Bureau measure). But its cumulative death rate (as of May 3) is also relatively low. Florida has been criticized for not shutting down the spring break holidays of mid-March when numerous college students from around the country fly to Florida for parties and more. But while the impact on cases leading to deaths in Florida itself appears to have been limited, outbreaks of the virus in other parts of the US have been traced to the spring break vacationers in Florida then returning to their homes across the US.
B. Urban Concentration and the Recent Daily Path of Covid-19 Deaths
The picture outlined above is a static one, as it focused on the rate of fatalities from the disease at a particular point in time (May 3). It is also of interest to review what the path has been in daily deaths from the disease, particularly over the past several weeks. The social distancing measures that the states imposed in mid to late-March (with a good deal of variation in both when they were imposed and how strong the measures were) would be expected to have an impact on reducing the pace of the spread, with a lag of a few weeks. They would then hopefully reduce the number of deaths from the disease a further week or so later.
In this, it is clear that the social distancing measures did succeed in flattening and then bringing down the curve, but with an important difference between the more highly urbanized states and the less urbanized ones:

The fatality rate for the US as a whole has come down since reaching a peak of about 2,000 deaths per day in mid-April (using 7-day moving averages to smooth out day-to-day fluctuations, where the dates shown are for the end of each 7-day period). The number of deaths then fell to just below 1,800 by May 4, a reduction of 10%. Based in part on this, the Trump administration is now encouraging states to lift their social distancing measures so that economic activity would, they hope, then recover.
But while the number of fatalities from this disease have begun to fall in the US as a whole, this has been entirely in the more urbanized states. Between the 7-day periods ending on April 17 and on May 4, the number of fatalities in the highly urbanized states fell by 25%. During that same period, they rose by 15% in the less urbanized states.
While the daily number of deaths remains at this point higher in the more urbanized states than in the less urbanized ones, this might soon change:
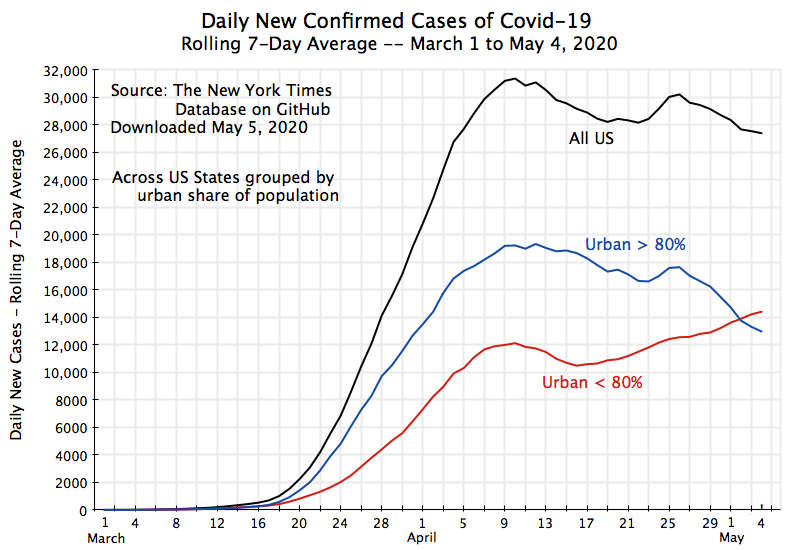
The daily number of new confirmed cases of Covid-19 is now higher in the less urbanized states. While the measurement of confirmed cases has been suspect (it depends on how broadly one is testing), it is better now than it was in March and even early April, when testing supplies were still limited and constrained the availability of testing. And the chart suggests that with the number of new confirmed cases now higher in the less urbanized states than in the more urbanized ones, and still heading upwards, the number of deaths from the disease in the less urbanized states may soon be higher in absolute number.
C. What is the Plan?
The Trump administration, and especially Trump himself, are now encouraging states to lift their social distancing measures. The stated aim is for the economy then to recover. However, with all the disruption that has resulted from the failure of the Trump administration to take this pandemic seriously early on, it is far from clear that this will suffice. The economy has been severely affected, where an astounding 30 million Americans (18% of the labor force) have already applied for unemployment insurance as of the week of April 25. Such a sharp and rapid collapse is unprecedented. It did not happen even in the Great Depression.
The Trump administration has argued that with the daily number of deaths from Covid-19 now falling in the US, the time has come to reopen businesses. And a number of governors, primarily Republicans in the more rural states, have started to do this, arguing that with their more rural spaces there is no longer a need for such social distancing. But as seen in the charts above, while the accumulated number of deaths per million from Covid-19 has often (but not always) been less in the less urbanized states, the absolute number of deaths in these states has continued to grow over the last several weeks even while they have gone down significantly in the more urbanized states. And the number of deaths each day may indeed soon be higher in the less urbanized states than in the more urbanized ones.
But what is the plan to address this? From all I can see, there is no plan. The Trump administration has not set out any coherent plan to safely reopen the economy. Rather, it has simply called for the lifting of social distancing measures while hoping for the best.
Could there be a plan? Certainly. As public health experts have called for from the start, and as the developed market economies of East Asia and the Pacific have demonstrated is possible, management of a pandemic requires wide testing of those who appear they may have the disease, isolation if the test proves that they do, tracing the contacts of all those found to have the disease, and then testing and quarantining for about two weeks those contacts who might have been exposed to the virus.
This can be most easily done early in the course of a pandemic, when the number of cases is relatively small. However, in January (and still through February) Trump insisted that all was fine and under control, and little was done. Now, with over 27,000 new confirmed cases each day (as of the week ending May 4), this will be far more difficult. The social distancing measures were implemented to stabilize the situation and then bring this number down to more manageable levels. But while they succeeded in bringing the total number down from its peak (the daily number of new cases had been over 31,000), it is still far too high.
In addition to bringing down the daily number of new cases to more manageable levels, the social distancing measures were also put in place to give the government time to develop the capacity then to carry out the standard public health measures of testing, isolating, contact tracing, and quarantining. But while some states appear to be building up that capacity to the extent they can, the evidence for others is scant, and for few, if any, does the capacity appear to be anywhere close to adequate.
And what is certainly missing is any leadership at the top – from Trump and his administration. States have rather been left largely on their own, with some assistance perhaps at the working levels but without a clear nationally-led program to build the necessary capacity.
The economy of course certainly needs to be reopened, with the social distancing measures loosened and eventually lifted. The issue is not whether this should be done but instead under what conditions. Rather than lead a national effort to bring down the number of daily new cases through a coherent and consistent program of social distancing measures (which may well differ between urban and rural areas, but not based on political boundaries), and using the time thus gained to ramp up the public health capacity that is required, the Trump administration has floundered, with a response that has been limited, ineffective, and rudderless.
============================================
The data underlying the chart at the top of this post:
|
Urban population % |
Deaths per million |
|
|
Vermont |
17.4% |
84.7 |
|
Wyoming |
24.5% |
12.4 |
|
Maine |
26.2% |
42.9 |
|
Montana |
26.5% |
16.2 |
|
Mississippi |
27.6% |
102.1 |
|
South Dakota |
29.9% |
25.8 |
|
West Virginia |
33.2% |
27.0 |
|
Arkansas |
39.5% |
26.1 |
|
North Dakota |
40.0% |
37.2 |
|
Kentucky |
41.0% |
58.8 |
|
Iowa |
41.7% |
60.4 |
|
Alaska |
44.5% |
9.9 |
|
Oklahoma |
45.8% |
63.4 |
|
New Hampshire |
47.3% |
65.3 |
|
Alabama |
48.7% |
60.7 |
|
Kansas |
50.2% |
49.8 |
|
Idaho |
50.5% |
40.8 |
|
New Mexico |
53.8% |
73.3 |
|
Nebraska |
53.8% |
42.7 |
|
Tennessee |
54.4% |
34.7 |
|
North Carolina |
54.9% |
45.7 |
|
South Carolina |
55.8% |
59.5 |
|
Wisconsin |
55.8% |
59.6 |
|
Missouri |
56.6% |
63.1 |
|
Minnesota |
58.0% |
79.0 |
|
Indiana |
59.2% |
174.6 |
|
Louisiana |
61.3% |
434.3 |
|
Oregon |
62.5% |
28.5 |
|
Ohio |
65.3% |
90.0 |
|
Georgia |
65.4% |
120.6 |
|
Michigan |
66.4% |
409.7 |
|
Delaware |
68.7% |
197.1 |
|
Virginia |
69.8% |
82.5 |
|
Pennsylvania |
70.7% |
223.8 |
|
Hawaii |
71.5% |
12.5 |
|
Washington |
75.0% |
124.9 |
|
Texas |
75.4% |
35.4 |
|
Colorado |
76.9% |
167.0 |
|
Illinois |
80.0% |
205.1 |
|
Arizona |
80.1% |
56.6 |
|
Utah |
81.2% |
18.1 |
|
New York |
82.7% |
990.2 |
|
Maryland |
83.5% |
204.7 |
|
Connecticut |
84.8% |
681.6 |
|
Nevada |
86.5% |
97.0 |
|
Florida |
87.4% |
73.3 |
|
California |
89.7% |
60.0 |
|
Massachusetts |
90.3% |
611.5 |
|
Rhode Island |
90.5% |
304.0 |
|
New Jersey |
92.2% |
895.3 |
|
District of Columbia |
100.0% |
417.1 |

You must be logged in to post a comment.