
A. Introduction
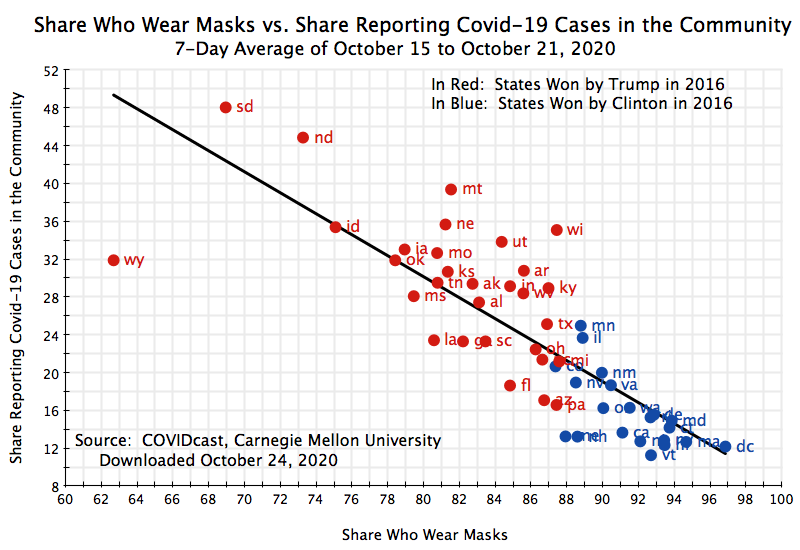
States where a high share of the population normally wear face masks when out in public also have a significantly lower transmission of the virus that causes Covid-19. The chart above shows the relationship between the wearing of face masks and the prevalence of Covid-19 in the community (measured in ways that will be discussed below). It is remarkable how tight that relationship is, as well as how steep. Wearing masks has a large effect. States differ between each other in dozens of different ways that can significantly affect the transmission of Covid-19. Yet the share of the population who report that they wear face masks most or all of the time when they go out in public can explain by itself most of the variation in the prevalence of Covid-19 across the states.
The data also show a remarkably strong consistency between the share of the population in a state that wear masks and whether that state voted for Clinton or Trump in 2016. That there is such a relationship is not surprising. Bur what is surprising is that the relationship is close to perfect. All but one of the states that voted for Clinton in 2016 report a mask-wearing share of 88% or above. The one exception is Colorado, with a share of 87.4%. And every single Trump-voting state has a reported share that is below 88%. Furthermore, several of the states where the vote margin was close (and where current polling indicates Biden would receive the most votes) are on the borderline. Such states include Pennsylvania, Michigan, and Wisconsin, each with a share between 87 and 88%.
This post will explain where this data comes from, the statistical significance of the relationships, and how one can appropriately interpret the results – for the chart above and two more below. And I should note that the idea for a chart similar to that above, using this data set, came from an article by the Washington Post reporter Christopher Ingraham that appeared on October 23 at the Washington Post website. The analysis here extends what Ingraham had.
B. A Higher Share of People Wearing Masks is Associated With A Lower Incidence of Covid-19 in the Community
The chart at the top of this post shows a remarkably tight relationship between the share of the population who say they normally or always wear a mask when out in public, and the prevalence of Covid-19 in those states (or more precisely, the share of the population who are personally aware of someone in the local community with Covid-19 like symptoms – this will be discussed below). With a higher share wearing masks, the prevalence is lower. There are qualifiers that need to be considered on the source of the data and how one should interpret the apparent relationship, but that there is such an association is clear.
The data underlying the analysis comes from a new set assembled as part of the COVIDcast project at Carnegie Mellon University. With the onset of the Covid-19 crisis, this group at Carnegie Mellon designed a simple survey that participants could sign on to via Facebook, to provide data on the spread of Covid-19. While the questionnaire has evolved over time, the most recent version (that they call Wave 4) was launched on September 8, and includes questions on mask usage. What makes the survey particularly interesting is that they receive a huge number of responses daily (averaging over 40,000 per day from September 8 to October 7). This allows for a statistically significant sample at not just the state level (which I focus on here), but also for most counties in the US.
There are, of course, potential biases in such a sample that must be corrected for. Those using Facebook, and in particular those willing to participate in such a survey seen via Facebook, will not necessarily be representative of the population. But the Carnegie-Mellon analysts use various methods, including adjusting for the demographic characteristics of the respondents, to correct for this. It cannot be perfect, but is likely to be reasonable.
One should also recognize that the behavior respondents record and what they actually do (such as on mask usage) may differ. Respondents may exaggerate the consistency with which they in fact use masks. But the Carnegie Mellon researchers have compared their results with that found from other sources, and have concluded they are consistent. Furthermore, if there is a bias, one might expect that bias to be similar across states. Perhaps all the responses (on, say, mask usage) are biased upwards – we may all say that we use masks more frequently than we in fact do. But if that bias is similar (on average) across all of us, then the variation across states would remain. They would just all be shifted upwards. Still, one should remain cognizant that the findings are based on self-reported responses, and may be biased.
The Wave 4 questionnaire had questions on a variety of topics. The specific question on mask usage was whether, in the past five days, the respondent had worn a mask when in public: all of the time, most of the time, some of the time, a little of the time, or none of the time. A mask wearer was classified as one who said that they wore a mask all or most of the time.
For whether the respondent might have Covid-19, the questionnaire asked whether they or someone in their immediate household suffer from Covid-like symptoms – specifically, whether they have a fever of 100℉ or more plus at least one of several additional possible conditions (sore throat, cough, shortness of breath, or difficulty breathing). Thus, while they also ask later whether the person has had a formal test for Covid-19 (they may or may not have), the response reported here is for whether they have Covid-like symptoms. Similarly, the figure for the share reporting possible cases of Covid-19 in the community (as in the chart at the top of this post), is based on whether the respondent was aware of others in their local community – who they know personally – who are suffering from Covid-19 like symptoms (with the conditions as defined for the individual).
The survey was designed this way in part as a purpose was to see whether such self-reported conditions could help local health authorities determine whether Covid-19 might be spreading in their communities, and to know this even before testing might find it. And the results were encouraging. The Carnegie Mellon researchers found that the daily and highly localized monitoring that was possible with the extremely large sample size of their survey generally performed well in tracking what was later found, via confirmed tests, on the spread of Covid-19 in that locality.
The resulting relationship between the respondents reporting that they wore masks when out in public all or most of the time (in the past five days), and the share reporting that they were personally aware of people in their community exhibiting Covid-19 like symptoms, is what is plotted (in terms of state averages) in the chart above. To smooth out possible day to day statistical noise in the data (and also to be consistent with 7-day averages for reported confirmed cases of Covid-19, to be discussed below), the data shown in the chart is for the 7-day average covering October 15 to October 21 (the most recent days available when I downloaded this).
The straight line in black in the chart is the ordinary least squares regression line – the line that best fits the scatter of observations. And from this one can calculate the statistical measure commonly referred to as the R-squared, which can vary between 0 and 1 (or 0% to 100%). The R-squared indicates what share of the variation in the scatter of observations would be predicted by simply knowing where this straight regression line passes. If the scatter points are all close to that line, the R-squared will be high. In the limit, if they all lie precisely at that line, the R-squared will equal 1. At the other extreme, if the scatter is all over and basically random, then the R-squared will be close to 0.
R-squared values are normally low for what are termed cross-section analyses (such as this, i.e. across the different states). There are numerous reasons states differ from each other, and just knowing one factor (in this case the share who wear masks) will normally produce only a loose correlation with the result of interest (in this case the share reporting they are personally aware of people with Covid-19 like symptoms in the community). Economists and other analysts would normally be happy to find a R-squared of 20% or so in such cross-state analyses, and elated if it is 30%.
In the chart here, the R-squared was 66%. This is remarkable. It indicates that if all one knows is the share of those wearing masks, we could predict 66% of the variation in the share reporting that they are aware of Covid-19 like symptoms in the community. Despite the many reasons why states may differ in their incidence of Covid-19, this one factor (the share of those wearing masks) will by itself predict two-thirds of the variation. Furthermore, one state (Wyoming) is an outlier. If one runs the regression over the full sample but with this single case removed, the R-squared rises to an astonishing 76%.
There are further reasons to be surprised that such a strong statistical relationship comes through. One is that the data come from a survey. Poor (possibly misunderstood) responses, or lack of knowledge on whether others in the community are suffering from Covid-19 like symptoms (due, perhaps, to not knowing many in the community, or not being in touch with them) will normally add statistical noise. But it appears that the extremely large sample sizes here have offset that. We still see a clear and strong relationship.
One should also recognize that states in the US are not isolated from each other. There is a substantial amount of travel from one to the other. Thus even if mask-wearing is common in one state, with infection rates then low, there may be a continual “re-seeding” of the infection brought in by travelers from states that are not as conscientious in wearing masks. This would weaken the relationship between local mask-wearing and local infection rates. Yet despite this, we still see a strong and highly significant effect.
One must also always note that what is being examined is a correlation between two variables, and that correlation does not necessarily indicate causation. One must examine whether it may in each individual analysis. In the case here, however, one can readily see a mechanism where a higher share of the population wearing masks will lead to a lower share of the population in the community being infected with the virus that causes Covid-19. But what would be the mechanism where a higher incidence of Covid-19 in the community would affect the share wearing masks? There might well be such a causal relationship, but one would then expect it to act in precisely the opposite way to the relationship found in the data: When a high share of the local community is infected with Covid-19, one would expect a high share of the population then to wear masks. It would be rational to be extra careful. But the relationship seen in the data is the opposite: The data show that a high share of the community being infected is associated with a low share of the population wearing masks. The line slopes downwards. It is reasonable to conclude that the causation goes from the wearing of masks to the share infected, not the reverse.
There is, however, a factor in the statistical analysis which may well be quite important. The data here show a high degree of correlation (negative correlation, as the line slopes downwards) between the wearing of masks and the incidence of Covid-19 in the locality. But the data on the wearing of masks may itself be, and indeed likely will be, highly correlated with other actions that may be taken to limit the spread of Covid-19. Responsible individuals who wear masks likely also are careful to practice social distancing, to wear gloves when shopping, to avoid crowded bars and nightclubs, and to avoid crowded events where many of the attendees do not wear masks (such as Trump rallies). Thus it may not simply be the wearing of masks that explains why a high share of the local population wearing masks in an area is correlated with a more limited spread of Covid-19: It is may well be the whole set of socially responsible behaviors that matter.
This is true and should be recognized. While the direct measure here is the share of the population that mostly or always wear masks, such behavior likely goes together with a full set of socially responsible behaviors that together lead to a lower spread of Covid-19. While we will often refer to the wearing of masks as the factor that is associated with a limited spread of Covid-19, we should recognize that the wearing of masks likely goes together with a broader set of behaviors that together are important.
C. A Higher Share of People Wearing Masks is Associated With A Lower Incidence of Self-Reported Cases of Covid-19, and a Lower Official Count of Confirmed Cases of Covid-19
Two other charts are of interest. The first examines the association between the share reporting they mostly or always wear masks, and whether they (or someone in their household) is exhibiting the symptoms of Covid-19:
One again sees a strong (negative) association between the wearing of masks and cases of those with symptoms consistent with Covid-19 (in this case of the survey respondents themselves). And the R-squared measures of the degree of correlation are even higher: 70% for the full sample, and 78% if the single case of Wyoming is removed. This again suggests that the wearing of masks (along with other responsible behaviors such as social distancing, etc.) is associated with a more limited spread of Covid-19. Furthermore, the impact is not simply statistically significant, but also large. Based just on the values on the regression line, a state with a reported 69% who wear masks (such as South Dakota) compared to a state (or locale) with a reported 97% who wear masks (such as Washington, DC) would be expected to have more than 6.1 times the share of cases. (The actual South Dakota vs. DC ratio is even higher, at over 7, as South Dakota is above the regression line and DC a bit below).
The findings are also consistent with the official counts of new confirmed cases of Covid-19 per 100,000 of population: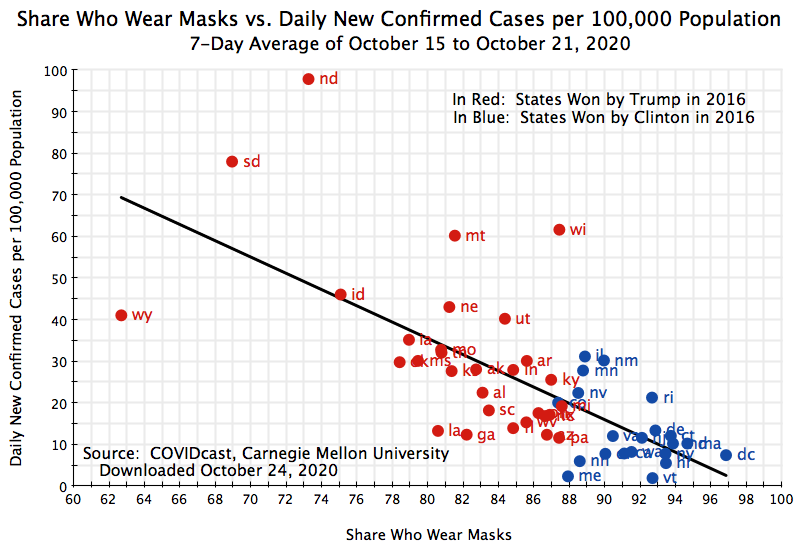
The data on the official counts were downloaded from the COVIDcast site, but they in turn were obtained from compilations at USAFacts. And USAFacts obtained the figures from state public health agencies.
The relationship between those reporting that they wear masks most or all of the time, and the number of confirmed new cases by state (per 100,000 of population, and a seven-day average covering the October 15 to October 21 week), remains significant, negative, and strong. The states where mask-wearing is a higher share of the population routinely wear masks (as reported in the surveys) see a significantly lower incidence of confirmed new cases of Covid-19. The statistical relationship is not as strong as before (the R-squared is 47%), but this is not surprising. The average number of daily new confirmed cases over the 7-day period (October 15 to 21) counts only those with a test result, for a new case, reported over those seven days. The number of people who are sick with Covid-19 will include not just those newly-tested individuals, but also others who have been sick for some time plus individuals with Covid-19 like symptoms who may have the disease but have not (or not yet) been tested. It is not surprising that the correlation of mask-wearing with just a slice of the population who are sick with Covid-19 will be weaker. But the R-squared of 47% is still quite high.
D. Conclusion: The Effectiveness of Wearing Masks
Masks work by reducing the transmission of an infectious disease to and from others. They are not perfect. But neither do they need to be perfect, as one can see from the simple arithmetic of the spread of an infectious disease.
Infectious diseases are viruses, which cannot survive on their own but can only survive by spreading from person to person. Any individual will have a disease such as Covid-19 for a finite period of time (a few weeks, normally, in the case of Covid-19) beyond which they would either have recovered or (in a small percentage of the cases) have died. And they will normally only be able to infect others for about a week (starting one week after they themselves had become infected), although possibly for up to two weeks.
Any such infectious disease will therefore spread when, on average, each individual with the disease spreads the disease on to more than one other person. And given the arithmetic of compounding, that number can grow to be very large very quickly. If each individual on average infects 2 other individuals in each cycle, then after just 10 cycles the one individual with the disease would have led to the infections of over 1,000. It doubles in each cycle. If each cycle is, on average, a week and a half (one week for the virus to multiply in the individual, and then one week during which the person can be infectious, so on average will infect others at the mid-point of the second week), those 10 cycles will require only 15 weeks.
But if the wearing of masks (along with other socially responsible behaviors, such as social distancing) reduces the average number of people that an individual with the disease will infect to less than one, then the disease will die out. And again, with the arithmetic of compounding, this can be quite quick. Suppose one starts out with 100 individuals with the disease in some locality. If, on average, each infected individual spreads the disease to another person only half the time, then 100 individuals will spread it to 50 during the first cycle, to 25 in the next, and so on. One can calculate that if this continues at such a rate, then less than one new person would become infected after just 7 cycles (or 10 1/2 weeks if each cycle is on average a week and a half). And the disease would have been stopped.
Masks work because they can bring down that reproduction rate (what epidemiologists call Rt) from something above 1.0 to something below. The example here is that masks (along with other socially responsible behaviors) reduced the Rt to 0.5. This would be a 75% reduction if the Rt is 2.0 when nothing is done to stop the spread of the disease. That is not perfect, but it does not need to be perfect to stop the spread. And 70 to 80% is a reasonable estimate of how effective masks are. If the US were to reduce the Rt to 0.5 going forward, then the daily number of new cases (currently, as I write this, about 80,000 each day) would fall to less than 100 in just 10 cycles (15 weeks).
This is of course just arithmetic, but the power of compounding is extremely important to recognize when addressing how to bring an infectious disease under control. Masks do not need to be 100% effective – they merely need to bring the Rt down to less than 1.0. And in this they are similar to vaccines. No vaccine is 100% effective. For the virus that causes Covid-19, the FDA has issued guidelines stating that a vaccine that is safe and has a minimum effectiveness of just 50% would be approved. It is hoped that the vaccines currently being tested will have a greater degree of effectiveness, but the expectation is that they might at most be perhaps 80% effective, and probably 70% or less is more likely.
That does not mean such vaccines would not be valuable. As just noted, a vaccine that brought the Rt down to 0.5 would lead to the disease dying out in a relatively short time. But as Dr. Robert Redfield, the head of the CDC, noted in testimony before Congress on September 16, the effectiveness of masks is similar if not greater than what is expected for a vaccine. In that testimony he stated, as he has in other fora in recent months (see here and here, for example), that if Americans wore these simple masks, that in “six, eight, 10, 12 weeks we’d bring this pandemic under control.” And further in that testimony: “I might even go so far as to say this face mask is more guaranteed to protect me against COVID than when I take a COVID vaccine, because the immunogenicity might be 70%, and if I don’t get an immune response the vaccine’s not going to protect me. This face mask will.”
But there is an important proviso. These effectiveness percentages, whether for masks or for vaccines, reflect how likely they will protect an individual who is exposed to the virus. But their effectiveness in reducing Rt will then depend on what share of the population wears a mask or is vaccinated. Usage of masks or vaccinations will never cover 100% of the population, and the reduction in Rt will then be less. If not enough people follow responsible social behaviors – most importantly wearing masks – or choose not to be vaccinated once a vaccine becomes available, the virus will continue to spread.
Political leadership is therefore critical, but Trump has been unwilling. Despite the uniform advice of medical professionals in the field, Trump has been unwilling to call on all Americans, and in particular all of his supporters, to wear masks. He rarely wears masks himself, makes a big show of pulling it off when he has had to wear one (such as when he returned to the White House from Walter Reed Hospital, where he had been treated for Covid-19), and continues to organize large political rallies where few wear masks (but with participants required to sign legal waivers saying that should they become infected as a result, they cannot sue the Trump campaign). And Trump continues to mock Joe Biden and others who are conscientious in wearing masks when in public.
Why? Wearing a mask makes it obvious that an infectious disease is circulating. It makes it obvious that Trump and his administration have failed to bring this terrible disease under control. Trump continues to assert instead, as he has from the start as well as more recently (during, for example, the second, October 22, debate with Joe Biden), that all is under control and that while there have been “spikes” they are all either “gone” or “will soon be gone”. From the start in January, Trump has repeatedly asserted that it was “totally under control”, that “It’s going to be just fine”, that it was just a hoax (indeed, a “new hoax” of the Democrats), and that it would soon (Trump asserted in February) just disappear (“like a miracle”). And Trump’s repeated assertion that “it’s going away” is well-documented in this Washington Post video compilation.
But cases are in fact rising as I write this, and rising rapidly. Confirmed cases hit over 83,000 on October 23 and then over 83,000 again on October 24 – they had never before exceeded 77,300 in a single day in the US. Hospitalizations are rising as well, and the surge in hospitalizations is starting again to overwhelm hospitals in parts of the country. It is absurd to say, as Trump repeatedly insists, that cases are rising only because more testing is being done. (As one wag put it: “I stopped gaining weight as soon as I stopped weighing myself.”)
The number of dead in the US from this disease now exceeds (as I write this) over 228,000. That exceeds the number of soldiers who died in battle in the US Civil War (Union plus Confederate together) of 214,938. It is 70% greater than the 134,575 Americans who died in battle in World War I plus the Korean War plus the Vietnam War, combined. This has been the worst public health crisis in the US in more than a century. Yet Trump claims he has been a great success.
The widespread wearing of masks would be an obvious signal of Trump’s failure. It is understandable (but not defensible) that he would want to hide such overt signs of his failure before the upcoming election. But to put short-term politics above public health concerns is deplorable.

You must be logged in to post a comment.