
This is a quick post drawing on a report in today’s Washington Post on the implementation of bus rapid transit (BRT) in Montgomery County, Maryland. The article notes that one of the early BRT routes planned in the county would run from Burtonsville to Silver Spring down US Highway 29, with an estimated capital cost of $200 million.
This would be a distance of 10.2 miles, so the cost would be $19.6 million per mile on average. This BRT line is currently slated to stop in Silver Spring, but it would be straightforward to extend it along East-West Highway for a further 3.7 miles to Bethesda. Assuming the same average cost per mile, the capital cost of this addition would be $72 million.
The current plan is for the Purple Line light rail line to cover this same basic route, connecting Silver Spring to Bethesda. As I have discussed in earlier blog posts, the Purple Line is incredibly expensive, even if one ignores (as the official cost estimates do) the environment costs of building and operating the line (including the value of parkland destroyed, which is implicitly being valued at zero, as well as the environmental costs from storm water run-off, habitat destruction, hazardous waste issues, higher greenhouse gas emissions, and more). The current capital cost estimate, following the service and other cuts that Governor Hogan has imposed to bring down costs, is $2.25 billion. This also does not include the costs that Montgomery County will cover directly for building the Bethesda station and well as the cost of a utilitarian path to be built adjacent to the train tracks. The Purple Line would also cost more to operate per rider than the Montgomery County BRT routes are expected to cost, so there is no cost savings from lower operating costs.
The Purple Line would be 16.2 miles long in total. Using just the $2.25 billion cost figure, this comes to $139 million per mile. This is extremely high. Indeed, the Columbia Pike streetcar line in Arlington County, which was recently cancelled due to its high cost, would have cost “only” $117 million per mile despite it being built through a high density urban corridor for most of its entire route.
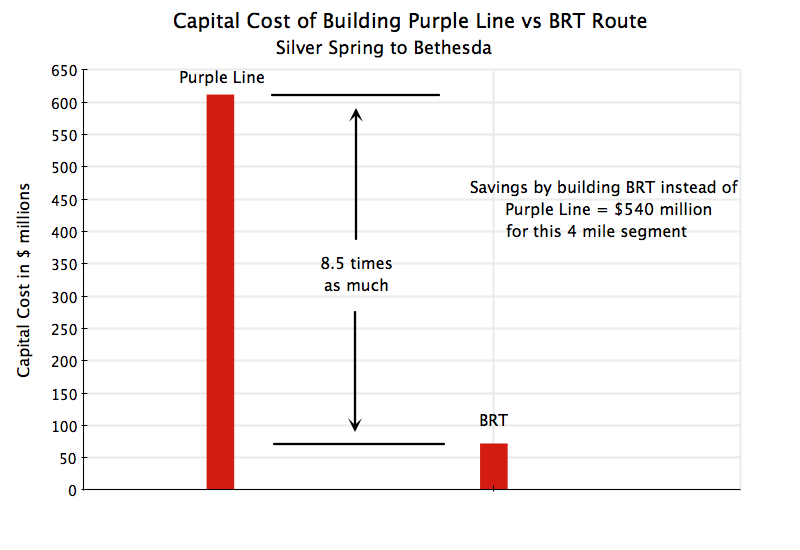
The distance from Silver Spring to Bethesda on the Purple Line will be 4.4 miles if it is built. This is longer than the direct route by road since it will follow a more indirect path passing up and around the direct route. Assuming the cost of this 4.4 miles is the same on average as for the rest of the Purple Line (it might be higher due to the need to build some major bridges, including over Rock Creek), the cost would come to $612 million.
The choice therefore is between spending $612 million to build this segment of the Purple Line from Silver Spring to Bethesda, or spending $72 million by extending the BRT. The Purple Line cost is 8.5 times as much, and government could save $540 million ( = $612m – $72m) by terminating the Purple Line in Silver Spring and using BRT service instead.
As an earlier blog post argued, new thinking is necessary if we are to resolve the very real transportation issues we face in this region. This is one more example of what could be done. A half billion dollar savings is not small.


You must be logged in to post a comment.