Inequality and Poverty in the US: Worse Than Elsewhere Due to Small Government

Gini Before Taxes & Transfers, OECD, 2010

Gini After Taxes and Transfers, OECD, 2010

A.  Introduction

Many observers are aware that the US has the worst income inequality in the world among the more developed high income countries.  But conservatives have attributed this to inequality resulting from what they see as a dynamic market based economy, that rewards entrepreneurs generously for hard work and taking risks.  Government interventions that have sought to compensate for the resulting inequality are seen by these conservatives as ineffective and misguided, and indeed counterproductive.  Thus on the 50th anniversary last week of President Lyndon Johnson declaring a “War on Poverty”, conservatives such as Senator Marco Rubio have asserted that those efforts were a failure, and that we should scale back, and even defund and dismantle, government social programs which have sought to alleviate the conditions of the poor.  They assert “big government” is the problem, and small government the solution.

But the premises on which these criticisms are based are faulty.  Individual anti-poverty programs have in fact worked quite well and poverty rates have come down – see this reference for example.  But more fundamentally, one needs to start with the recognition that the US market system does not itself produce greater inequality or higher poverty rates than elsewhere.  For this, US rates are similar to those for others, as will be seen below.  Where the US differs, however, is in the inequality and poverty rates after one includes the impact of government via taxes and transfer programs, to arrive at what individuals are in fact able to buy and consume.  Such government interventions have reduced inequality and poverty rates in all countries.  But because the US efforts are so much more limited than they are elsewhere, US inequality and poverty rates are the worst in the world once one takes these into account.  And since a person’s living standard depends on what they are able to buy after taking into account taxes and transfer programs (such as Social Security or unemployment compensation), it is the latter which matters.

Thus the assertion from Senator Rubio and others that government efforts to reduce inequality and poverty have failed (since we still have inequality and poverty), and that they therefore should be cut back or eliminated altogether, is misguided. Government interventions through tax and transfer programs have reduced inequality and poverty, but they have done so less in the US than elsewhere because their scale in the US is more limited than elsewhere.  It is due to this limited scale that the US ends up being ranked as the worst in the world among other high income countries in terms of inequality and poverty.

This blog post will review these issues, drawing mostly on data available from the OECD Statistics web site.  We will first focus on the inequality measure called the Gini coefficient, both before and then after taxes and transfers.  The Gini is probably the most widely used measure of inequality (when there is any measure of inequality available, which is not always the case as one needs large and expensive household sample surveys).  It varies from zero to one, with a value of zero indicating perfect equality of incomes (all individuals, or households, in the country earn the same amount), and a value of one indicating complete inequality (all of the nation’s income accrues to one person).  The section of the blog post that then follows will then look at poverty head counts – both before and then after taxes and transfers.

B.  Income Inequality as Measured by the Gini Coefficient

The chart at the top of this blog post shows the Gini coefficient for the US and a set of comparable high income countries (mostly from Western Europe, along with Canada, Japan, Australia, and New Zealand).  Based just on incomes as earned in the market, inequality in the US is in the middle of the range found for the other countries – a bit worse than the average but not by much.  Inequality of market incomes was worse in Ireland, the UK, Portugal, Spain, France, and Italy.  There is no sign here that the US economic structure leads to a distribution of income that is worse than that seen elsewhere among the high income developed countries of the world.

The picture changes markedly once one takes into account the impact of taxes and government transfer programs.  This is shown on the second chart above.  Inequality then falls in all of the countries, as there is at least some degree of progressivity in the tax systems, and government transfer programs are also and more markedly progressive.  Even if the benefits of some transfer program are distributed in equal dollar amounts to all in the population, that level of transfer will be of greater relative importance to a poor person than to a rich person.

But inequality falls by less in the US than elsewhere once one takes into account taxes and transfers, so that the US moves from the middle of the set of comparator countries to the country with the worst distribution.  The differences in the Gini coefficients are shown explicitly in the following chart:

Gini Coefficient - Dif Before and After Taxes & Transfers, OECD, 2010

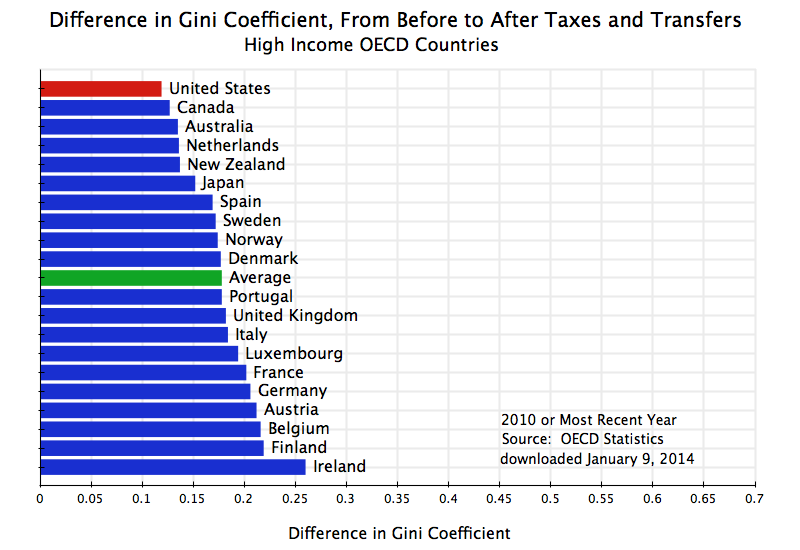
Inequality as measured by the Gini coefficient is reduced in each of the countries once one takes into account taxes and transfers.  The reductions are indeed quite significant.  But the reduction in the US is smaller than in any other country, and the result is that the US then ranks worst in terms of inequality once one takes into account taxes and transfers.

An interesting question is whether the reductions in inequality are primarily due to the tax system, or to transfer programs.  Tax systems and transfer programs are both in general progressive.  That is, tax rates are generally higher for those individuals with higher income, and transfer programs are generally designed to benefit the poor more than the rich.  But not all individual tax and transfer programs are progressive.  Flat consumption taxes, such as sales taxes in the US and value-added taxes in Europe, can be regressive, in that they take a higher share from the poor (who must consume almost all of their limited income) than the rich.  The scale of the programs also matter.  One might have an extremely progressive tax structure, for example, but if the size is small (so that little is collected in taxes) then it will have little impact on inequality.

One therefore needs to look at the data.  While the standard OECD files used for the above do not have this, an analysis posted as the Budget Incidence Fiscal Redistribution Database by the research center known as the Luxembourg Income Study (based in Luxembourg and with a US office at the City University of New York), does provide such a breakdown.  The analysis was prepared by Chen Wang and Koen Caminada of the University of Leiden in the Netherlands, and a description is available in this working paper.

Their analysis is drawn from data for 2004 (for most of the countries):

Change in Gini From Before To After Taxes and Transfers
2004 or nearest year
Gini Gini Total From From  Transfers/
Before After Change Taxes Transfers Income
US 0.482 0.372 0.109 0.043 0.066 9.9
Canada 0.433 0.318 0.114 0.038 0.076 10.9
Spain 0.441 0.315 0.126 0.001 0.124 20.7
Switzerland 0.395 0.268 0.128 -0.003 0.130 17.5
UK 0.490 0.345 0.145 0.021 0.124 14.3
Australia 0.461 0.312 0.149 0.047 0.101 11.1
Italy 0.503 0.338 0.165 0.000 0.165 25.4
Average 0.456 0.289 0.167 0.031 0.136 19.6
France 0.449 0.281 0.168 0.017 0.151 26.2
Norway 0.430 0.256 0.174 0.035 0.139 20.2
Ireland 0.490 0.312 0.178 0.046 0.132 17.3
Luxembourg 0.452 0.268 0.184 0.037 0.147 23.4
Austria 0.459 0.269 0.190 0.034 0.156 26.7
Denmark 0.419 0.228 0.191 0.042 0.149 18.9
Netherlands 0.459 0.263 0.196 0.040 0.156 21.3
Sweden 0.442 0.237 0.205 0.037 0.168 24.6
Germany 0.489 0.278 0.210 0.052 0.158 21.2
Finland 0.464 0.252 0.212 0.044 0.168 23.2
Europe only 0.456 0.279 0.177 0.029 0.148 21.5

The first two columns show the Gini coefficient, first before and then after taxes and transfers.  The third column then shows the change in the Gini, with the countries in the table ranked according to this change (from smallest to largest).  While the specific numbers differ from those in the OECD data shown above (the year is different, plus the data may be drawn from different underlying sources), the two are broadly consistent.  In both sets, the US ranks as the most unequal in terms of income after taxes and transfers, with the change in the Gini from before to after also the smallest.  Before taxes and transfers, the Gini for the US is within the range seen for the other countries, with Italy, the UK, Ireland, and Germany all worse.

The authors decompose the change in the Gini according to how much is due to the tax system and how much is due to government transfer programs.  For the US, for example, the total reduction in the Gini was 0.109 points, with 0.043 coming from the tax system and 0.066 coming from the impact of government transfers.

The reduction in the Gini in the US due to the impact of the tax system (of 0.043 points) is within the range seen for the other countries and is indeed even somewhat higher than the average impact across all countries (of 0.031 points).  The US relies mainly on direct income taxes for raising tax revenue, while European countries rely more on value-added taxes.  Income taxes with progressive rates will have a greater impact on reducing inequality than will value-added taxes.  But there are other taxes in all countries, including income taxes in Europe.  More importantly, Europe collects far more in tax revenues than the US does, and hence even if the US tax system has more progressive rates overall, the larger scale in Europe means there can be more of an impact on inequality there.  Based on OECD tax data, the US collected (at all levels of government) just 24% of GDP in tax revenue in 2012, while Western Europe on average collected over 60% more at 39% of GDP.

But more important than the impact of the tax system on inequality was the impact of government transfer programs.  Transfer programs in the US did reduce inequality as measured by the Gini by 0.066 points.  But this was the smallest of any of the countries.  It was less than half the average reduction across all the countries of 0.136 points, and an even smaller share relative to the average for just the European countries of 0.148 points.

The reduction was larger in Europe than in the US primarily because the transfer programs were larger in Europe than in the US.  The final column in the table shows the average level of transfers in each country relative to household incomes.  This was just 9.9% in the US, which was about half of the 19.6% for all the countries, and well less than half of the 21.5% average for just the European countries.

Transfer programs do bring down inequality, and does this in all countries including the US.  But government transfer programs are so much more limited in the US than elsewhere that the US ends up as the worst in the world in inequality once one accounts for them along with taxes.

C.  Poverty Rates

The discussion above was on inequality, using the Gini coefficient as the measure.  But inequality (and the Gini measure), cover the entire income range from rich to poor.  One might also reasonably want to know how the US compares when one focuses exclusively on the poor.  What share of the population is poor, where does the US rank by this measure compared to other countries, and again what is the impact of taxes and transfers?  We will find that the results are basically the same as that found above for the Gini.

A direct measure of the poverty rate is available from the same OECD data base utilized above for the Gini.  The concept used is the share of the population (the head count) with incomes below a poverty line defined as 50% of the median income in the country.  This is a relative measure that takes into account that the standard used for determining who is poor should depend on how rich the country is.

Based on this measure of poverty, the US poverty rate before taxes and transfers is again similar to that for other OECD countries.  It is indeed slightly better than the average for all the OECD countries included here (where there is consistent data also available now for this measure for the countries of Central Europe, so these countries have been added):

Poverty Head Count Before Taxes & Transfers, OECD, 2010

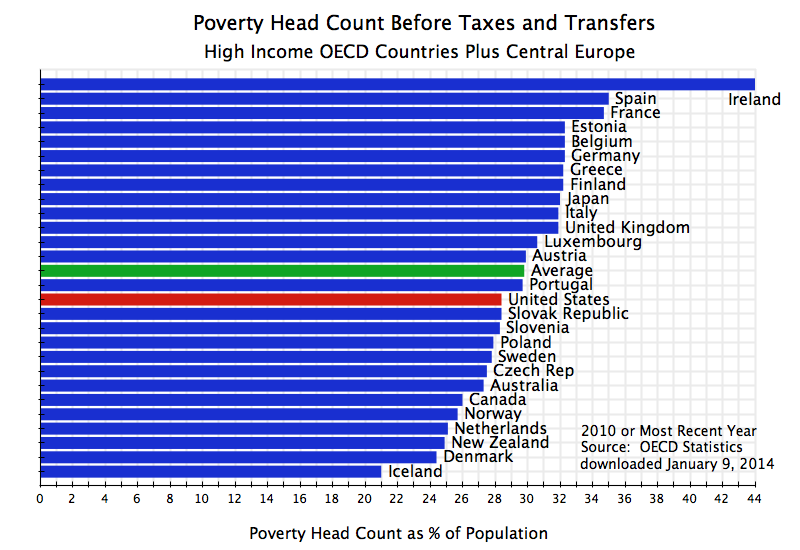
The US market economy therefore does not lead to higher poverty rates than that found in other OECD countries.  But this changes, as it did for the Gini, when one takes into account the system of taxes and transfers:

Poverty Head Count After Taxes & Transfers, OECD, 2010

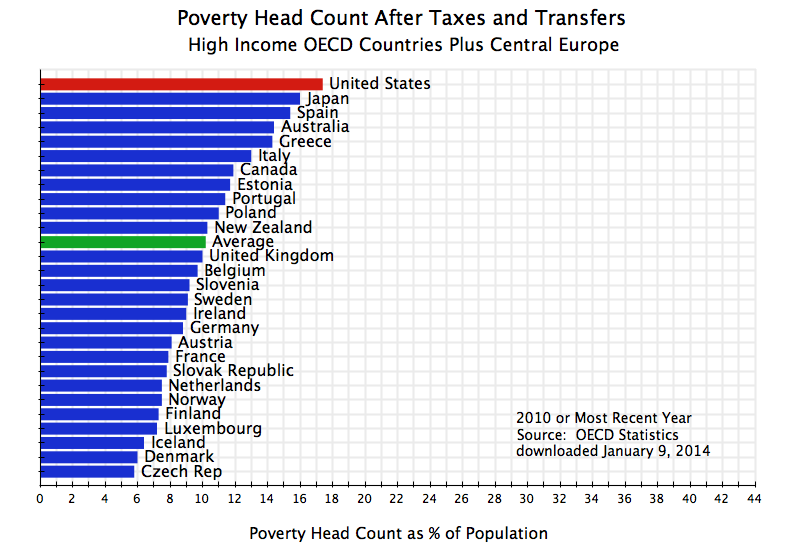
The US then ranks again worst among all OECD countries in terms of the poverty rate, once one includes the impact of taxes and transfers.  The system of taxes and transfers has a positive impact in all of the countries, in that the poverty rates fall in each country once one accounts for taxes paid and transfers received.  Indeed, the impacts in many of the countries are quite large.  But the programs are more limited in the US than elsewhere, so that the net reduction in the US is the smallest:

Dif in Poverty Head Count, Before to After Taxes & Transfers, OECD, 2010

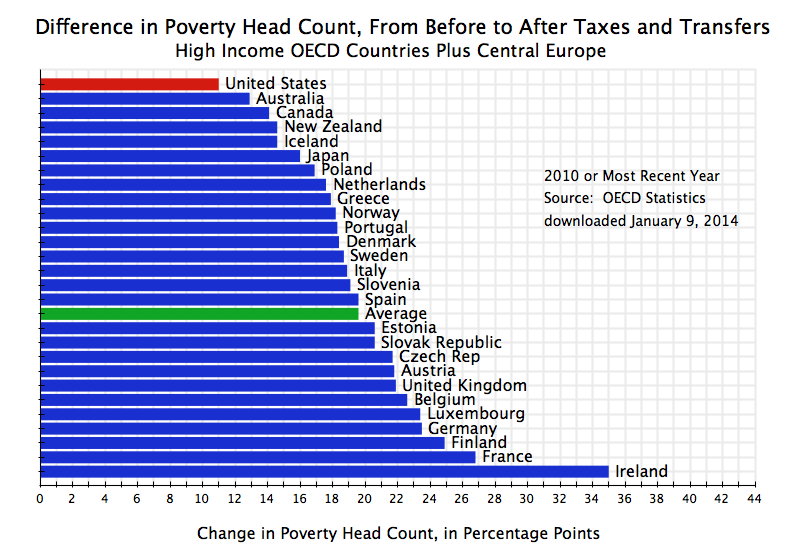
Due to the limited scale of such government programs in the US, poverty rates end up higher in the US than in any other high income OECD country.

D.  Conclusion

Many presume that the US has high inequality and poverty rates because of the market economy system in the US.  While it may be recognized that inequality in the US is higher than elsewhere, and poverty rates also higher, the presumption is that these are unfortunate byproducts of a market system that rewards hard work and risk taking.

But this is not the case.  Inequality and poverty in the US is similar to that found elsewhere among the high income OECD countries, when one takes incomes as determined before accounting for taxes paid and the impact of government transfer programs.  The US is indeed quite close to the average seen elsewhere for these market determined incomes.  Where the US differs, however, is in inequality and poverty rates after one takes into account taxes paid and transfers received.  And since this determines what individuals are in fact able to buy and consume, these incomes after taxes and transfers determine actual living standards.

Once one takes into account taxes and transfers, the US moves from the middle of the range to the worst ranking country.  The tax systems and transfer programs reduce inequality and poverty rates in all countries, including the US.  But the US programs are so much more limited than those found elsewhere, particularly in Europe, that the rest of the OECD world reaches and surpasses the US by these measures.

Inequality and poverty rates in the US, as the worst in the world after accounting for taxes and transfers, are not therefore a consequence of failed government programs, which conservatives such as Senator Rubio want to cut by even more.  Rather, the ranking of the US as the worst in the world is a consequence of the opposite:  that these programs are too small and limited.

The Obama Bull Market in Equity Prices Continues

S&P500 Index, March 9, 2009, to Nov 19, 2013

.

   Bull Market Rallies Since 1940
  Ranked by overall growth in real terms
    Nominal % Real % Real Rate
Start Date End Date Change Change of Growth
Dec 4, 1987 Mar 24, 2000 582% 361% 13%
Jun 13, 1949 Aug 2, 1956 267% 222% 18%
Aug 12, 1982 Aug 25, 1987 229% 181% 23%
Mar 9, 2009 Nov 15, 2013 166% 141% 21%
Apr 28, 1942 May 29, 1946 158% 124% 22%
Oct 22, 1957 Dec 12, 1961 86% 76% 15%
Oct 9, 2002 Oct 9, 2007 101% 75% 12%
Jun 26, 1962 Feb 9, 1966 80% 69% 16%
May 26, 1970 Jan 11, 1973 74% 57% 19%
Oct 6, 1966 Nov 29, 1968 48% 37% 16%
Oct 3, 1974 Nov 28, 1980 126% 34% 5%
         

Equity prices reached record levels on November 18, with the S&P 500 index hitting 1,800 in mid-day trading and the Dow Jones Industrial Average hitting 16,000, before both closed lower.  While any such index numbers are arbitrary, it might be timely for a brief update of a blog post from March of this year on the boom in equity prices, to see where things now stand.  That blog post noted that equity prices have boomed under Obama, to the extent that the stock market rally that began soon after he took office has been one of the largest of the last seven decades.

Since March, that rally in equity prices has continued.  The graph at the top of this post shows the path for the S&P 500 stock market index (a capitalization-weighted index that is generally taken as the benchmark for the market), from its trough on March 9, 2009, to its most recent peak (in terms of its daily closing price) on November 15.  It has now increased by 166% in nominal terms, and by 141% in real terms, since that low-point just six weeks after Obama was inaugurated.

The table above fits the on-going rally into all the bull market rallies since 1940.  These rallies are defined as increases in equity prices of 25% or more in nominal terms before ending with a correction of 20% or more.  The calculations are based on figures originally provided by Barry Ritholtz on his web site (which were in turn based on Merrill-Lynch figures), which were used in my March blog post.

There have been 11 such rallies since 1940, and the Obama market rally is now the fourth largest among these.  Since it is still on-going, it could also move up further in rank.  And the pace of the increase has been rapid.  The real rate of growth in equity prices over the course of this rally (of 21% per annum up to this point) is the third highest of any of these rallies.

Conservatives continue to charge that Obama’s policies have been terrible for business and for the economy.  Yet if that were true, one would not expect equity prices to be booming.  I should hasten to add that this rally could, of course, end tomorrow.  Stock market rallies always come to an end.  But until it does, it is hard to reconcile the view of conservatives that Obama has been bad for business with what we see happening in the markets.

Growth in France and the US: The Bottom 90% Have Done Better in France

France vs US, 1980-2012, GDP per capita overall and of bottom 90%

A.  Introduction

Conservative media and conservative politicians in the US have looked down on France over the last decade (particularly after France refused to join the US in the Iraq war, and then turned out to be right), arguing that France is a stagnant, socialist state, with an economy being left behind by a dynamic US.  They have pointed to faster overall growth in the US over the last several decades, and average incomes that were higher in the US to start and then became proportionately even higher as time went on.

GDP per capita has indeed grown faster in the US than it has in France over the last several decades.  Over the period of 1980 to 2007 (the most recent cyclical peak, before the economic collapse in the last year of the Bush administration from which neither the US nor France has as yet fully recovered), GDP per capita grew at an annual average rate of 2.0% in the US and only 1.5% in France.

But GDP per capita reflects an average covering everyone.  As has been discussed in this blog (see here and here), the distribution of income became markedly worse in the US since around 1980, when Reagan was elected and began to implement the “Reagan Revolution”.  The rich in the US have done extremely well since 1980, while the not-so-rich have not.  Thus while overall GDP per capita has grown by more in the US than in France, one does not know from just this whether that has also been the case for the bulk of the population.

In fact it turns out not to be the case.  The bottom 90%, which includes everyone from the poor up through the middle classes to at least the bottom end of the upper middle classes, have done better in France than in the US.

B.  Growth in GDP per Capita in France vs. the US:  Overall and the Bottom 90%

The graph at the top of this post shows GDP per capita from 1980 to 2012 for both the US and France.  The figures come from the Total Economy Database (TED database) of the Conference Board, and are expressed in terms of 2012 constant prices, in dollars, with the conversion from French currency to US dollars done in terms of Purchasing Power Parity (PPP) of 2005.  PPP exchange rates provide conversions based on the prices in two respective countries of some basket of goods.  They provide a measure of real living standards.  Conversions based on market exchange rates can be misleading as those rates will vary moment to moment based on financial market conditions, and also do not take into account the prices of goods which are not traded internationally.

Real GDP per capita (for the entire population) rose for both the US and France over this period, and by proportionately somewhat more in the US than in France.  These incomes are shown in the top two lines in the graph above, with the US in black and France in blue.  GDP per capita in France was 83% of the US value in 1980, and fell to 72% of the US by 2012.

But the story is quite different if one instead focuses on the bottom 90%.  The GDP per person of those in the bottom 90% of the US and in France are presented in the lower two lines of the graph above.  The figures were calculated using the distribution data provided in the World Top Incomes Database, assembled by Thomas Piketty, Emmanuel Saez, and others, applied to the GDP and population figures from the TED database.  The US distribution data extends to 2012, but the French data only reaches 2009 in what is available currently.

The Piketty – Saez distribution data is drawn from information provided in national income tax returns, and hence is based on incomes as defined for tax purposes in the respective countries.  Thus they are not strictly comparable across countries.  Nor is taxable income the same as GDP, even though GDP (sometimes referred to as National Income) reflects a broad concept of what constitutes income at a national level.  But for the moment (the direction of some adjustments will be discussed below), distributing GDP according to income shares of taxable income is a good starting point.

Based on this, incomes (as measured as a share of GDP, and then per person in the group) of the bottom 90% in France were 88% of the US level in 1980.  But this then grew to 98% of the US level by 2007, before backing off some in the downturn.  That is, the real income of the bottom 90%, expressed purely in GDP per person, rose in France over this period from substantially less than that for the US in 1980, to very close to the average US income of that group by 2007.  And since one is talking about 90% of the population, that is all those other than the well-off and rich, this is not an insignificant group.

C.  Most of the US Income Growth Went to the Top 10%

Figures on the growth of the different groups, and their distributional shares, show what happened:

France US
GDP per Capita, Rate of Growth, 1980-2007
  Overall 1.5% 2.0%
  Bottom 90% 1.4% 1.0%
Share of GDP, 1980
  Top 10% 31% 35%
  Bottom 90% 69% 65%
Share of GDP, 2007
  Top 10% 33% 50%
  Bottom 90% 67% 50%
Share of Increment of GDP Growth, 1980-2007
  Top 10% 36% 62%
  Bottom 90% 64% 38%

As noted before, overall GDP per capita grew at a faster average rate in the US than in France over this period:  2.0% annually in the US vs. 1.5% in France.  But for the bottom 90%, GDP per capita (for the group) grew at a rate of only 1.0% in the US while in France it grew at a rate of 1.4% per year.  The French rate for the bottom 90% was almost the same as the overall average rate for everyone there, while in the US the rate of income growth for the bottom 90% was only half as much as for the overall average.

Following from this, income shares did not vary much over the 1980 to 2007 period in France.  That is, all groups shared similarly in growth in France.  In contrast, the top 10% in the US enjoyed a disproportionate share of the income growth, leaving the bottom 90% behind.

In 1980 in France, the top 10% received 31% of the income generated in the economy and the bottom 90% received 69%.  With perfect equality, the top 10% would have had 10% and the bottom 90% would have had 90%, but there is no perfect equality.  The US distribution in 1980 was somewhat more unequal than in France, but not by much.  In 1980, the top 10% received 35% of national income, while the bottom 90% received 65%.

This then changed markedly after 1980.  Of the increment in GDP from growth over the 1980 to 2007 period, the top 10% received 36% in France (somewhat above their initial 31% share, but not by that much), while the bottom 90% received 64%.  The pattern in the US was almost exactly the reverse:  The top 10% in the US received fully 62% of the increment in GDP, while the bottom 90% received only 38%.  As a result of this disproportionate share of income growth, the top 10% in the US increased their overall share of national income from 35% in 1980 to 50% in 2007.  Distribution became far more unequal in the US over this period, while in France it did not.

The data continue to 2012 for the US, but the results are the same within roundoff.  That is, the top 10% received 62% again of the increment of GDP between 1980 and 2012 while the bottom 90% only received 38%.  For France the data continue to 2009, but again the results are the same as for 1980 to 2007, within roundoff.

With this deterioration in distribution, the bottom 90% in the US saw their income grow at only half the rate for the economy as a whole.  The top 10% received most (62%) of the growth in GDP over this period.  In France, in contrast, the bottom 90% received close to a proportionate share of the income growth.  For those who make up the first 90%, economic performance and improvement in outcomes were better in France than in the US.  Only the top 10% fared better in the US.

D.  Other Factors Affecting Living Standards:  Social Services and Leisure Time

In absolute terms, even with the faster growth of real incomes of the bottom 90% in France relative to the US over this period, the bottom 90% in France came close to but were still a bit below US income levels in 2007.  They reached 98% of US income levels in that year, and then fell back some (in relative terms) with the start of the 2008 downturn.

But the calculations discussed above were based on applying distributional shares from tax return data to GDP figures.  For income earning comparisons, this is reasonable.  But living standards includes more than cash earnings.  In particular, one should take into account the impact on living standards of social services and leisure time.

Social services include services provided by or through the government, which are distributed to the population either equally or with a higher share going to the poorer elements in society.  An example of a service distributed equally would be health care services.  In France government supported health care services (largely provided via private providers such as doctors and hospitals) are made available to the entire population.  Since individual health care needs are largely similar for all, one would expect that the bottom 90% would receive approximately 90% of the benefit from such services, while the top 10% would receive about 10%.  If anything, the poor might receive a higher share, as their health conditions will on average likely be worse (and might account for why they are poor).  For other social services, such as housing allowances or unemployment compensation, more than 90% will likely accrue to the bottom 90%.

Taking such services into account, the bottom 90% in France will be receiving more than the 67% share of income (in 2007) seen in tax return data.  How much more I cannot calculate as I do not have the data.  The direction of change would be the same in the US.  However, one would expect a much lower impact in the US than in France because social services provided by or through the government are much more limited in the US than in France.  While Medicare provides similar health care as one finds in France, Medicare in the US is limited to those over 65, while government supported health care in France goes to the entire population.  And the social safety net, focussed on the poor and middle classes, is much more limited in the US than in France.

In addition, economists recognize that GDP per capita is a only crude measure of living standards as it does not take into account how many hours each individual must work to obtain that income.  Your living standard is higher if you can earn the same income but work fewer hours as someone else to receive that income, as the remaining time can be spent on leisure.  And there is nothing irrational to choose to work 10% fewer hours a year, say, even though your annual income would then be 10% less.  The work / leisure tradeoff is a choice to be made.

GDP per capita may often be the best measure available due to lack of data on working hours, but for the US and France such data are available (and are provided in the TED database referred to previously).  One can then calculate GDP per hour of work instead of GDP per capita, both overall and (using the same distributional data as above) for the bottom 90%.  The resulting graph for 1980 to 2012 is as follows:

France vs US, 1980-2012, GDP per hour overall and of bottom 90% (Autosaved)

By this measure, overall GDP per hour of work in France was similar to that of the US in the 1990s, but somewhat less before and after.  Overall GDP per capita was always higher in the US over this full period (the top graph in this post), and by a substantial 20% (in 1980) to 38% (in 2012).  Yet GDP per hour worked never varied by so much, and indeed in some years was slightly higher in France than in the US.

But for the bottom 90%, income received per hour of work has been far better in France than in the US since 1983.  By 2007, GDP per hour worked was 30% higher in France than in the US for the bottom 90%.  This is not a small difference.  French workers are productive, and take part of their higher productivity per hour in more annual leisure time than their US counterparts do.

E.  Summary and Conclusions

The French economic record has been much criticized by conservative media and politicians in the US, with France seen as a stagnant, socialist, state.  Overall GDP per capita has indeed grown faster in recent decades in the US than in France, averaging 2.0% per annum in the US vs. a rate of 1.5% in France.  While such a difference in rates might appear to be small, it compounds over time.

But the picture is quite different if one focusses on the bottom 90%.  This is not a small segment of the population, but rather everyone from the poor up to all but the quite well off.  Growth in average real income of this group was substantially faster in France than in the US since 1980.  While overall growth was faster in the US than in France, most of this income growth went to the top 10% in the US, while the gains were shared more equally in France.

Furthermore, when one takes into account social services, which are more equally distributed than taxable income and which are much more important in France than in the US, as well as leisure time, the real living standards of the bottom 90% have not only grown faster in France, but have substantially surpassed that of the US.

For those other than those fortunate enough to be in the top 10%, living standards are now higher, and have improved by more in recent decades, in France than in the US.