
A) Introduction
The US is sinking into what looks likely to be its biggest public health crisis in over a century (i.e. since the Spanish Flu pandemic of 1918/19). But President Trump continues to insist that he is not to be blamed for its mismanagement. Rather, he insists that he should be commended for instituting the travel ban on China in early February, that “everyone” was opposed to him doing it but he decided to impose anyway, and that it turned out to be a “great success”.
None of this is true.
What was in fact done? On January 31, the Trump administration announced that he would impose a ban on travelers from China entering the US, with this going into effect the evening of February 2. It would not apply to returning US citizens. But there were other countries doing the same at that point, or even earlier (not many, but some). Australia, for example, set a ban on travelers from China which went into effect on February 1, and New Zealand set a ban effective February 2. Furthermore, numerous airlines were already suspending their flights from China. American Airlines had implemented a suspension on all its flights to the US from China effective on January 31. Delta and United Airlines had already announced that they would also be suspending their flights, and Delta did so on February 2 and United on February 5. Air Canada had already suspended its flights on January 30, and numerous European airlines suspended theirs starting January 29 (Lufthansa, Swiss International, Austrian, British Airways), January 30 (KLM, Air France), and January 31 (SAS, Iberia).
And it is not correct for Trump to claim that “everyone” was opposed to such a travel ban. I read the news closely, and I cannot recall any politician, nor any widely expressed public sentiment, arguing against the ban (although I acknowledge that there may well have been some – just not enough to be significant). Infectious disease experts did say that such a ban would not do much good at that point, as the disease was certainly already in the US and would spread. Keep in mind that any such disease starts with only one case, of a newly mutated virus that some animal carries (scientists believe it originated in bats, and then passed to some other animal species before jumping to some person). It then expands person to person from that one case. A travel ban, by itself, will not stop a spread if there are cases already here.
What a travel ban can do is buy some time. It can postpone a major spread of the disease by a few weeks. That can be of value if the ban is implemented very early and if those weeks are then spent to address aggressively the spread of the disease. This includes rapid testing of all those individuals that may have been exposed to the virus, the isolation of all the cases thus found, and the quarantining of all those who may have been exposed but have not shown symptoms at that point.
But none of this was done in the US. And as the experts noted, such travel bans will be harmful if they lull policymakers into a false sense of security, with an excuse then to delay taking urgent measures in the false belief that the country is now protected. It is clear that Trump himself believed this, or at least acted (or rather did not act) consistent with such a belief.
If such a travel ban might buy time, how much time might that be? This blog post will present some calculations of scenarios of what to expect. I should stress that I am not an epidemiologist, and the scenarios discussed here are in no way a forecast of what specifically might have happened. Epidemiologists are looking at that now, using far more sophisticated models (and with far greater knowledge than I have), but are still in an early stage as many of the characteristics of the disease are not yet known with any degree of certainty.
But what matters most is the basic mathematics of pandemics or epidemics (I will use the terms interchangeably here – a pandemic is simply an epidemic of greater range or coverage). An infectious disease will expand at an exponential rate early on and is subject to a ceiling on those it can infect (no more than 100% of the population, and normally less). And it is that basic mathematics of the process which shows why travel bans will be futile, and at best will simply delay by only a very short time the spread of a virus such as that which causes COVID-19.
The basic result is summarized in the chart at the top of this post and will be discussed in the next section below. With plausible parameters, a complete and total travel ban applied to all travelers (including US citizens) might have delayed the spread of the disease by perhaps 2 1/2 weeks. That is not much.
Far more effective would be policies to reduce the pace at which the disease spreads. Such policies include “social distancing”, where activities involving crowds are canceled or avoided, and one encourages everyone to wash their hands frequently, stay away from others to the extent they can, and so on. The chart shows (in the curve in orange) what that might achieve for a plausible parameter. Its impact is far greater than that of a travel ban.
Slowing down the pace at which the virus spreads is also supremely important, as otherwise our health system could easily become swamped with an overwhelming number of cases requiring care all at one time. As will be discussed and illustrated in section C below, a travel ban does not help with this at all. But social distancing will, and quite remarkably so. It could reduce the peak load on our health system (for the parameters examined here) by 75%. That could literally mean that thousands of lives could be saved.
What was done during February, after the travel ban had been put into effect? Sadly, not much. There was no significant effort to identify and then isolate cases, and quarantine those exposed to those cases. The development of a rapid COVID-19 specific test was also delayed as the initial version of the test turned out to be flawed. While other nations around the world developed and quickly applied tests of their own, the US only tested (through other means) a small number of possible cases of individuals meeting highly restrictive criteria (such as recent travel in China). And with only highly limited testing being done, the reported number of confirmed cases in the US was low. But you can only confirm cases if you test, and if you do not test you will have no confirmations.
President Trump, and his administration, has yet to acknowledge its responsibility in this fiasco. Trump has instead insisted that cases in the US are exceptionally low because, and only because, of the travel ban on China. The numbers suggest otherwise.
B) The Simple Mathematics of an Epidemic, and the Impact of a Travel Ban
One can model what an epidemic might look like (in terms of how fast it will spread) with some simple mathematics. While this is far from the sophisticated models epidemiologists have for such processes, a simple model will suffice for an examination of the issue of what a travel ban might do.
The basic characteristic of an epidemic is that it will grow at an exponential rate to start with, but since it is subject to a ceiling (it cannot infect more than 100% of a population, and normally will tail off well before this point), the expansion will eventually have to level off. A simple model with such characteristics is a logistic model, which was first proposed by a Belgian mathematician, Pierre Verhulst, in 1838.
The key parameter, called the “basic reproduction number” (and often designated as R0) is the number of new people who will, on average, be infected by a person who has been infected. If that number is 2.0, then (to start) two new people will be infected by each person that has been infected, and the number of people who are infected at any given time will double in each period (to start). If that number is 1.0, then (again, to start) one person will on average be infected by each person that has been infected, and the number of people who are infected in any given period will be constant (and the number who have cumulatively been infected will grow linearly over time). And if the number is less than 1.0, then the number of new cases of infection will decline in each period, eventually going to zero (with the cumulative total climbing week to week as long as there are any new cases, but at a diminishing rate and eventually leveling off).
The basic reproduction number depends both on the characteristics of the disease, and on the degree of interpersonal contact in the society. For the disease itself, some are more easily transmissible than others. Measles, for example, spreads extremely easily. Ebola (fortunately, as it has a high fatality rate) spread only if you had direct contact with bodily fluids, and hence did not spread easily.
But the spread also depends on what society is doing. When people are in close direct contact, for example in crowds at concerts or in church or in a crowded subway car, more will be infected than if people are well separated. Hence policy matters, and we will examine below the impact of measures that would reduce the degree of such close contact.
A key question for the virus that causes COVID-19 is how transmissible it is. A number of scholars have hurriedly examined this, mostly using data from the initial spread in Wuhan, China, but have come up with a fairly wide range of possible figures. The parameter is inherently hard to measure as data on the total number of people coming down with the virus week to week are simply not available, with the published figures possibly underestimates. But a careful study published in The Lancet on March 11 estimated a figure of 2.35 in Wuhan before travel restrictions were imposed, falling to 1.05 after the rather draconian travel and quarantine measures went into effect. An early study by a group of Chinese researchers published in the New England Journal of Medicine on January 29 (and summarized in an editorial co-authored by Dr. Anthony Fauci and others in the New England Journal of Medicine on February 28) arrived at an estimate of 2.2. An estimate in a study published on February 22 and based on the spread of the virus in the cruise ship Diamond Princess came to a figure of 2.28. And a review published on February 13 that examined as many other published studies as they could find up to that point (a total of 12, some of which might not have been of high quality) found a median estimate of 2.79, a mean of 3.28, and a range of 1.4 to 6.49.
I used an R0 of 2.3 for the calculations here. It might be a bit on the low side, and if it were higher then the impact of a full travel ban (the main issue I am examining here) would be even less. I am erring on the conservative side. I am also, for these scenarios, looking at what the impact would be if that number remains unchanged over time. That is, the scenarios examine what the impact would be if nothing is done to reduce the R0 by social distancing measures, either from policy (i.e. school closures) or simply by individuals being more careful and avoiding crowds or places where they could pick up an infection. I stress again that these are scenarios of what would happen under specific circumstances, not forecasts of what will happen.
Assumptions are required for several other factors as well. For simplicity, I am taking a discrete form of the logistic model, with calculations of week to week changes. It is assumed that there will be a one week incubation period of a person who has been infected, and that that person can then infect others in their second week of infection. After that, they can no longer infect others. These assumptions are broadly consistent with what appear to be some of the basic parameters of the disease (based on material from a good summary article published in The Lancet on March 9), where the authors state that the mean time it takes for a newly infected person to pass the disease on to others is estimated to be 4.4 to 7.5 days. So roughly one week after someone catches the virus they, on average, pass it on to others.
To examine the impact of a travel ban, I included as part of the model that a certain number of infected people would arrive from abroad each week, and that they would then add to those who could infect others domestically in the next week. That is, those who would (domestically) be infected each week depends on the number who had been infected domestically in the prior week plus those infected who had arrived from abroad in the prior week. To start, in period zero, I assumed there were 100 cases already active in the country domestically, and that 100 cases arrived from abroad. I also assumed that the cases arriving from abroad, if nothing were done, would increase exponentially week to week (reflecting that the number of cases abroad are also growing) until they reached 10,000 per week (given that there are only so many who fly back and forth, even in normal times), after which the number was kept at 10,000 per week.
Finally, I set the ceiling on the population that might be infected by the virus at roughly one-third of the US population. This model is too simple to forecast what that ceiling might be, so I used estimates made by others of the share of the US population that might in the end be infected if nothing is done. But this ceiling is primarily just a scaling variable. The results would not be impacted much by a different ceiling, within a reasonable range. What matters is that, for the scaling used here, one starts with 100, caps those coming from abroad at 10,000, and has an overall domestic ceiling of over 100 million.
The scenario then looked at what would happen with a complete and total ban on anyone coming from abroad. This would be far more extreme than any actual travel ban would be, as it would exclude returning American citizens and not just foreigners, plus it would cover travel from all countries in the world. This was far more comprehensive than simply a ban on non-citizen arrivals from China. But the aim was to be as generous as possible in calculating what the impact of a travel ban would be.
The chart at the top of this post shows what that impact might be. It would not be much. Even under such an extreme ban on travel, the path of the epidemic would be delayed by only about 2 1/2 weeks. With other values assumed for the basic reproduction number R0 within a reasonable range, that time delay might be as short as 2 weeks or as long as 3 1/2 weeks. None of these are large. A travel ban would, at best, buy some time, but not much time.
But that extra time was not used in any case. A travel ban in the very early stages of an epidemic can play a role if it is early enough (and February 2 was not early enough), and with then a major effort mounted to test all possible cases for the virus, with those testing positive isolated and those who had come into contact with such cases (or possible cases) quarantined. None of this was done.
More modestly, what could have been done would be immediately to have increased social distancing, so that the infection rate (the R0) would be reduced. The chart at the top of this post shows (in the curve in orange) what the impact would be had such measures been undertaken instead of the travel ban, and were sufficient to reduce the R0 to 1.5 from the 2.3 assumed in the other scenarios. That is, the curve shows the impact where, on average, each infected person then infects a further 1.5 people instead of 2.3 people. And again, to be clear, the curve assumes no foreign travel restrictions were imposed.
The spread of the disease is then slowed significantly. Furthermore, the total number infected rises just to 75 million, or one-third less than come down with the disease in the base scenarios (with or without a travel ban). The lower total number infected following from a lower R0 is an outcome of the random processes assumed in the logistic function, where as you approach the ceiling on the number who might be infected (the population), there is an increased likelihood that one will encounter only people who have already been infected and hence are now immune. When one encounters fewer people (an R0 of 1.5 rather than 2.3), the likelihood goes up that all of the people encountered will be immune, and hence the number who will be infected in those later periods falls below 1.0. The further spread of the disease then dies out. It is for this reason as well that the curves for the case where R0 equals 2.3 level off at the odd number of 113.5 million. I assumed a potential population of 120 million, and the logistic curve will level off below this.
Another scenario examined was one where the total travel ban was not implemented in week zero but rather in week six. This would be similar to a delayed travel ban, such as that Trump recently imposed for travelers from Europe. In the simple model, by week six the number of infected travelers coming in from abroad has reached its assumed peak of 10,000 per week. I assumed that this was instead brought to zero in week six and then remained at zero. The impact was trivial. A plot of the new curve sits basically on top of the old (no travel ban) curve. I therefore did not include it here as it simply looks almost exactly the same as the curve with no travel ban imposed.
C) Impact on Cases to be Treated
As many have stressed, what matters is not only the total number of people being infected but also the number of new cases of infection each week. Since about 20% of those coming down with the disease will likely need hospital treatment (based on current estimates), the burden on our hospital system will depend on how rapidly the number of new cases increase. There are only a limited number of hospital beds, a far more limited number of the ventilators (about 160,000) that many of those who come down with this respiratory illness will require, and an even more limited number of beds in intensive care units (only 46,500, with perhaps a similar number that could be added in a crisis). Furthermore, the patients that will need these ventilators and ICU beds may need to use them for two or three weeks. This is far longer than would be the typical use of such hospital facilities for other disease treatments where they are required.
Hence, as numerous news reports have flagged in recent days, we need to “flatten the curve”. That is, there is a critical need to reduce the peak load on such hospital facilities, with the need instead spread out over time. A travel ban does not do this: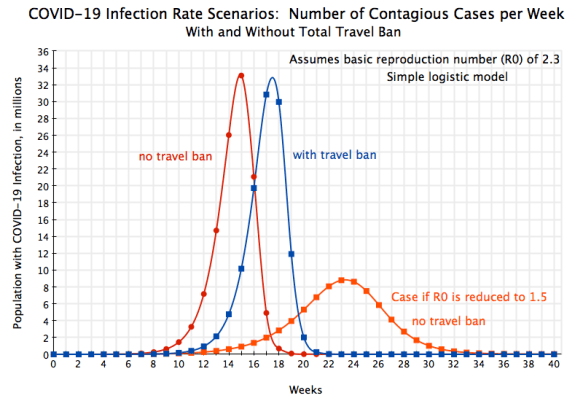
The peak loads on our hospital facilities would be almost exactly the same, with or without a total travel ban. The peak is just shifted by 2 1/2 weeks. In contrast, policies that by social distancing and other such measures reduces the basic reproduction number to 1.5 would have quite a marked effect, reducing the peak load by almost 75%. That could directly translate into possibly thousands of lives that might be saved. A travel ban does not help.
D) Conclusion
The US is facing a major public health crisis. Yet the response has been terribly mismanaged by the Trump administration. Direction starts at the top, but Trump has repeatedly asserted that there is no major problem and that the disease will soon go away. Even as late as March 10 (less than one week from when I am writing this), Trump said in remarks to the press at the White House that “And it will go away. Just stay clam. It will go away.” He also continued to assert in those remarks that the ban on travel from China that he put in place, which he insisted others would not have done, had “made a big difference”.
But as shown above, imposing a travel ban, and one far more sweeping than the one Trump imposed on non-American travelers from China, will not have a major effect on the path of an epidemic such as the one we are facing. This follows from the mathematics of compound growth as a disease spreads person to person. At best it will buy some time, but plausible estimates are that it would amount to only a few weeks at best. And those extra few weeks will only help if one makes use of that time to aggressively attack the disease. That was not done.
Furthermore, a travel ban will not change the basic pattern of the epidemic. It will merely shift it. The peak loads on a stretched hospital system will remain the same. Far more effective would be an early and sustained effort to promote social distancing. This will not only reduce the total number getting the infection, but will also spread the infections out significantly over time. Even a relatively modest reduction in the pace at which the disease spreads will have a major impact on those peak loads. And reducing those peak loads on the hospital system can make a major difference in the number of deaths, reducing them by quite possibly thousands.
Why, then, the travel bans? Probably because it may lead some to believe you are being serious and decisive, even macho, with such a clear-cut (albeit ineffective) measure. Plus this makes it look like foreigners are to blame. All this is appealing to someone like Trump. And as he has repeatedly done throughout his term in office, he discounts the evidence-based advice of scientists with expertise in a field. He thinks he knows better.
Sadly, Trump is accepting no responsibility for this fiasco. On March 13, when asked specifically whether he accepts any responsibility for the delay of more than a month in rolling out the extensive testing that is critical early in an epidemic to identify and quickly isolate those infected, Trump replied “No. I don’t take responsibility at all.”


You must be logged in to post a comment.