Europe GDP Falls Again: Austerity Programs Lead to Contraction

Europe GDP Growth, 2007Q4 to 2012Q4

The European Statistical Agency Eurostat released today its “flash” estimate of GDP growth in the European economies in the fourth quarter of 2012.  The results are terrible.  The initial estimate is that GDP fell at a seasonally adjusted annualized rate of 2.4% in the fourth quarter (or a fall of 0.6% quarter on quarter) in the 17 economies that make up the Eurozone, and that GDP fell at an annualized rate of 2.0% (0.5% quarter on quarter) in the 27 economies in the European Union as a whole.  The 2.4% rate of fall of GDP in the Eurozone, and fall of 2.0% in the EU as a whole, can be contrasted with the recently released estimate that GDP in the US was essentially flat (a 0.1% rate of decline in the initial estimate) in the fourth quarter of 2012.

The flat GDP in the US at the end of 2012 was not a good performance, and has been justly criticized as well below what is needed.  But the fall at a rate of 2.4% in the Eurozone was far worse.  As shown in the graph above, Eurozone GDP has now fallen steadily for five quarters in a row.  Europe is well into a double-dip recession, having never fully recovered from the 2008 downturn, and its GDP is now 3% below what it was in the first quarter of 2008, almost five years ago.

Not only is output falling in Europe as a whole, but it is also falling in each of the major countries.  Especially notable is the fall in GDP at an annualized rate of 2.4% in Germany.  GDP in Germany had been rising at a modest rate since mid-2009, although the recovery slowed in 2011 and has now turned negative.  But in addition to Germany, there were falls in GDP at annualized rates of 1.2% in France and the UK, of 0.8% in the Netherlands, and also of 2.8% in Spain and 3.6% in Italy (not shown in the graph above).

UK output is now even further below the path it followed during the Great Depression in the 1930’s.  As discussed in an earlier posting on this blog, the UK economy is performing worse now than it did during the Great Depression.  The turnaround from what had been a modest but steady recovery occurred in mid-2010, when the newly elected Conservative-led government embarked on an austerity plan similar to what Republicans have called for the US to follow.  But the consequences have been terrible.  By 19 quarters into the downturn (one quarter shy of five years), the UK economy is producing 3% less than it had in early 2008.  At the same point during the Great Depression, the UK economy was producing 4% more than at its previous cyclical peak, and growth was steadily positive.

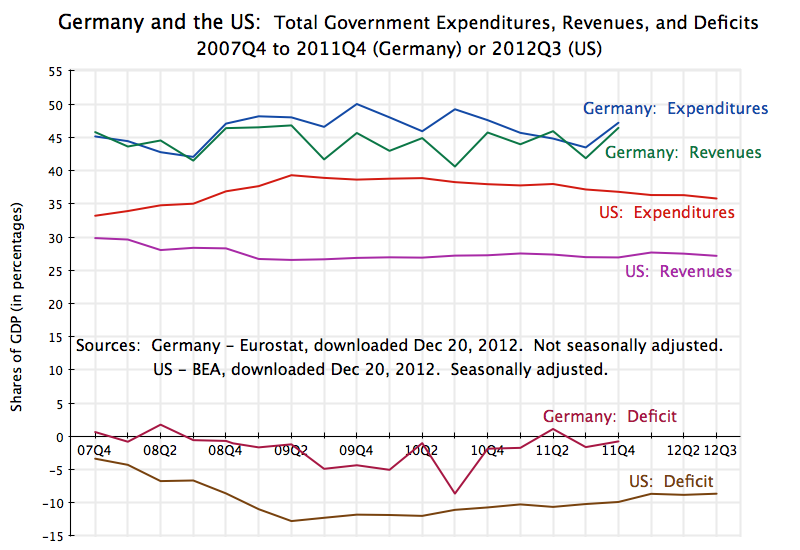
The fall in German GDP is significant, as it may now induce Germany to agree to steps that would allow Europe as a whole to recover and start to grow.  Germany has been a forceful advocate for austerity in both fiscal and monetary programs, even though (as discussed in an earlier posting on this blog), Germany itself had until 2011 had its government expenditures grow relatively strongly.  But its economy slowed in late 2011 and into 2012, and output has now fallen sharply in the last quarter of 2012.  Germany has strongly resisted measures which would have served to boost European growth, but there may now be a basis for the hope that this will change, now that Germany sees its interests aligned with those of others in Europe.

There are steps that Europe could take to recover from this downturn.  These include:

  1. Reverse the austerity policies, at least among the economies with ready access to the financial markets.  Ten year government borrowing rates are only 1.5% in Germany, 1.7% in the Netherlands, 1.8% in the UK, and 2.2% in France.  These are either below, or close to, the 2% inflation target of the ECB and others.  That is, these governments can borrow ten year funds at essentially zero or even negative real cost.  It is madness not to make use of such funds to pay for investments in infrastructure, education, and other purposes, at a time when resources (both labor and capital) are idle due to lack of demand.  Indeed, it is in times like these when such public investments are best made.  Not only do they boost the recovery, but they do not displace the use of such resources for other purposes.  When the economy is close to full employment, with capital also being fully utilized, using resources for infrastructure and other public investments entails a trade-off, as the resources then used for such public investment have to be drawn from their use for other purposes.  The trade-off might then still be warranted, but it is far better to make such public investments in times like today, when there is no such trade-off.
  2. The European Central Bank should follow the more supportive monetary policies that have been followed by all the other major central banks in the world, including in the US, the UK, and Japan.  The main policy interest rates at all these other central banks have been kept at 25 basis points (0.25%) or below since their economies started crashing in late 2008.  The European Central Bank, in contrast, kept its main policy interest rate at 100 basis points from May 2009 to April 2011.  This relatively high rate at a time of economic weakness led to greater economic weakness, as shown in the graph above.  It then made the mistake of starting to raise the rate, first to 125bp and then to 150bp in the spring and summer of 2011.  The renewed downturn in GDP of the Euro 17 started soon thereafter (see the graph above).  The ECB then started to lower the rate again in late 2011, but it was too little and too late. And the policy rate remains (since mid-2012) at 75bp, well above the rates followed by the other major central banks of the world.  The ECB should lower its rate to 25bp immediately.
  3. Weakness in the commercial banking system in Europe remains a major problem, particularly as financial markets in Europe are far more dependent on their commercial banking systems than is the case in the US (where capital markets are relatively larger).  When the euro was under intense pressure last summer, European leaders agreed to move to some form of a system of more centralized commercial bank regulation and supervision.  But while an important agreement was reached in December 2012, under which the European Central Bank would supervise directly the larger banks in Europe, this agreement did not go as far as had been earlier anticipated.  While it was agreed that the ECB would have direct responsibility for the supervision of the major banks, its authority to deal with failing banks and the resources it could use to do so, were kept limited.  There is also no central system of deposit insurance, but rather still a set of different systems at the national level.  A euro-wide system of bank regulation and supervision, with the power and resources to address failing banks and with a consolidated deposit insurance system, would go far to addressing the weaknesses of a common currency zone.  In a common currency zone, the ability of national authorities to deal with failing banks is constrained.

Europe is now in a double-dip recession.  The austerity programs have failed.  Yet Republicans in the US continue to push for the US to follow similar policies.

The Long-Term Damage From Keeping the Bush Tax Cuts

CBO Revenue Projections - Extended Baseline vs Alternative Fiscal Scenario, 2012to 2037

The US Senate has voted in favor of a package of measures to avert temporarily the so-called “fiscal cliff” (but in doing so, has set up a new cliff that will hit in two months).  As I write this, it is not yet clear whether the House of Representatives will vote to pass this compromise, or will try to amend it, or will attempt something else, but right now a vote appears imminent.

But there is one aspect of the deal which has not received much attention in at least the public discussion of what is being voted on:  While it is recognized that extending the Bush Tax Cuts will slash government revenues over the ten year period being discussed (2013 to 2022), little attention has been paid to the long term impact if the Bush Tax Cuts were made permanent.

The Bush Tax Cuts were originally passed under legislation where they would expire on December 31, 2010.  With the economy then still extremely weak, Obama signed legislation in December 2010 to extend the cuts for a further two years, to December 31, 2012.  Other recent tax measures (including in particular the effective rates for the Alternative Minimum Tax) also were set with an expiration date of December 31, 2012.  The issue being debated in the Congress is whether these tax cuts should be extended again, in whole or in part.  Both Obama and the Republicans have been in favor of extending them for most households.  The debate has centered on whether taxes should be allowed to revert to what they were during the Clinton years for households with incomes over $250,000 a year, over $450,000 a year, or over $1,000,000 a year, or some other number within that range.  This corresponds to extending the Bush Tax Cuts permanently for approximately 97% of the population ($250,000), 99.3% of the population ($450,000), or 99.7% of the population ($1,000,000).

The bill passed by the Senate would extend the Bush Tax Cuts permanently for the 99.3% of households earning up to $450,000 a year.  That is, almost everyone would continue to pay the lower tax cuts first passed during the Bush Administration.  Even the remaining 0.7% of the population would see their taxes fall similarly on their first $450,000 of income.  Beyond that, their marginal tax rates would revert to those that applied during the Clinton years.

Since the richest 0.7% earn so much more than the rest of us, there would still be a substantial increase in tax revenues paid.  The estimate is that the tax measures in the bill passed by the Senate would raise tax revenues by about $600 billion over the ten years 2013 to 2022 (i.e. by $60 billion per year).  There would have been an estimated extra $4.5 trillion in revenues over the ten years if the Bush Tax Cuts and the other tax measures had been all allowed to expire.  The $600 billion is only 13% of the $4.5 trillion.  That is, 87% of the Bush Tax Cuts (and related tax cuts) are made permanent.

The problem of what to do about the fiscal deficit over the next ten years will therefore largely remain.  As Jeff Sachs has noted in a recent column, without the revenues that will be lost by making the bulk of the Bush Tax Cuts permanent, it will be hard to pay for the basic government programs that most consider important.  But what few have noted is that extending the bulk of the Bush Tax Cuts not only hurts the fiscal balance for the next ten years, but makes the situation far worse beyond that.

The graph above shows projected federal government revenues up to the year 2037 under two scenarios:  where the Bush Tax Cuts (and AMT and other related tax measures) are allowed to expire as scheduled (the Extended Baseline Scenario), and where these tax cuts are instead made permanent (the Alternative Fiscal Scenario).  The projections are from the Congressional Budget Office in their Long-Term Budget Outlook, of June 2012.  We do not yet have what the projections would be to 2037 under the Senate bill, where taxes are allowed to revert to previous levels only for those earning over $450,000.  However, since this would recover only 13% of the revenues that would be lost if the Bush Tax Cuts were extended for everyone, the curve would lie between the two shown above, but relatively close to the curve labeled the Alternative Fiscal Scenario.

If the tax cuts are made permanent for all, the CBO projects that federal revenues would recover over the next three years from their current very low levels (low due to the economic downturn), but then flatten out and not rise above 18.5% of GDP even in the very long term.  In contrast, if the tax cuts were allowed to expire for all, federal revenues would first recover, but then continue to rise slowly to 21% of GDP by 2021, to 22 1/2% of GDP by 2030, to 23 1/2% of GDP by 2036, and to continue on that rising path beyond that.

The increase in taxes as a share of GDP over time, were the Bush tax rates allowed to expire and revert to their previous levels, is interesting and important.  The tax share is projected by the CBO to increase because GDP is projected to grow over time, and under the previous tax regime the tax system was progressive, with higher incomes leading to higher tax rates and hence higher tax collections.  In contrast, under the tax regime brought on by the Bush Tax Cuts, the system is no longer progressive:  When GDP grows over time, those receiving the higher incomes will only pay taxes at rates similar to those who are poorer, so taxes as a share of GDP remains flat.

This loss in progressivity of the tax system may well be the most damaging aspect of the Bush Tax Cuts.  Relative to the previous system with progressivity, the tax cuts have led not only to a loss in revenues, but also to a system where on average higher incomes do not result in a higher rate of taxes on that higher income.  As Warren Buffett has noted, a person as rich as he is will pay, under the current tax system, a lower rate of taxes on average than his secretary.  This will not change significantly under the bill passed by the Senate.  And the losses in revenues as a share of GDP become steadily larger over time as the economy grows.

The losses in revenues are huge.  They start at about 2 1/2% of GDP from 2014 to 2020, but then rise to 4% of GDP by 2030 and to 5% of GDP by 2036.  Keep in mind that future governments could decide that such extra revenues are not needed.  If so, they could then  enact tax cuts of a size and structure suitable for the time.  But it is far easier to legislate tax cuts in the American political environment than it is to legislate tax increases when extra revenues are needed.

With the difficult long term fiscal outlook that most foresee for the US, an ability to raise adequate revenues will be critical to the country’s long-term financial stability.  But I should add that while this is a critical long-term problem, this does not mean that the Bush Tax Cuts should all end immediately, as they would have under the fiscal cliff.  Unemployment, while better than three years ago, remains high.  Rather, the optimal path would be to phase them out over the next few years.  A reasonable policy would be to link them to the unemployment rate.  To start, taxes would revert now to those of the Clinton period (when growth was solid, and the fiscal accounts moved to surplus) for those with income over $250,000.  Taxes would then revert to Clinton period rates for those with income of over $100,000, say, when the unemployment rate had fallen from the current 7.7% to a rate of perhaps 7%, and then taxes would revert for everyone once unemployment had fallen to below 6%.

But under the Senate passed bill, this will not happen.

Fiscally Prudent Germany: Government Expenditures Have Grown, Despite the Rhetoric

Europe GDP Growth, 2007Q4 to 2012Q3 - 1

Germany & US - Govt Cons & Investment, 2007 to 2011

Germany & US - Govt Expenditures, Revenues, Deficit - 2007Q4 to 2012Q3

As was noted in the preceding post on this blog, austerity programs implemented in most of the major European economies in 2010/2011 have led to a double-dip recession in Europe, as the incipient recovery of 2009/2010 was killed.  Germany would appear to be an exception to this, as the German economy (like that of the US) continued to grow in 2011 and 2012.  The top graph above (repeated here from the preceding blog post) shows the growth since the end of 2007 for Germany, the US, and for the Eurozone area as a whole, as well as for France, the Netherlands, and the UK.

Germany, led by Angela Merkel of the conservative Christian Democrats since 2005, has been especially adamant in insisting on the austerity programs.  She pushed for such programs in much of the continent, and in particular as a condition of financial loan support from Germany in the cases of Spain, Italy, Greece, and others.  She was also the principal proponent of the “fiscal compact” under which EU member governments would be required to maintain balanced budgets.

Given all this, one would have expected that Germany itself would have followed a strict austerity program.  However, it in fact allowed government expenditures to rise relatively sharply (see the second graph above), and by a good deal more than in the US.  What is different in Germany is that it also kept up its government revenues, rather than seek to stimulate the economy through tax cuts.  This is seen in the third graph.  The result is that while German fiscal deficits grew, to almost 5% of GDP in 2010, they remained well below the deficits seen in the US and elsewhere.  The deficit was then reduced in 2011 as revenues rose and expenditure growth was moderated, but with a resulting slow-down in German growth in 2011 and 2012 (see the top graph).

In contrast to Germany, the US had government consumption and investment expenditures level off in 2010 and then fall in 2011 (second graph).  Total government expenditures (including transfer payments, such as for Social Security and Medicare) were reduced after peaking in the second quarter of 2009 (third graph).  But the US also cut back sharply on taxes (as discussed in this blog post).  The result was an increase in the overall government deficit to over 12% of GDP (for all levels of government).  This has now come down to about 8 1/2% of GDP, but remains high.

Germany is often cited as an example by conservatives in the US and elsewhere of prudent fiscal policy in response to the crisis.  The German fiscal deficit is indeed relatively modest.  But the German deficit is modest not because government expenditures are low, but because Germany has kept government revenues high.  Indeed, German government expenditures are a good deal higher than they are in the US as a share of GDP (21% higher in 2011).  But German government revenues are also far higher than they are in the US (64% higher in 2011, as a share of GDP).  The prudence comes not from low government expenditures, but from ensuring government revenues are kept high to pay for such expenditures.

Senator Mitch McConnell, the Republican Leader in the Senate, has said repeatedly in recent years:  “We’re not in this mess because Washington taxes too little; we’re in this mess because Washington spends too much.”  The example of conservative and fiscally prudent Germany points to the opposite:  We are in trouble not because Washington spends too much, but because it taxes too little.

————————————————

Notes on Data

The data for Germany comes from the European statistical agency Eurostat.  It is an excellent source of consistent data for all members of the European Union.  However, national accounts and fiscal data for Europe are gathered differently in the US, which sometimes makes it difficult to arrive at directly comparable data.  In particular:

  • Quarterly data on government total expenditures and revenues are not available on a seasonally adjusted basis.  Furthermore, the most recent quarterly data reported is only for the period through the fourth quarter of 2011.
  • While seasonally adjusted quarterly data (in real, inflation-adjusted, terms) are available in the national income (GDP) accounts for government consumption, the national income accounts in Europe do not show government investment separately.  Rather, government investment is combined with private investment in the European accounts.  In the US, the national income accounts record government consumption and government investment together.
  • Real government investment is available separately on an annual basis for the European economies, which is why the second graph above shows these numbers on an annual rather than quarterly basis.
  • Total government expenditure (for not just consumption and investment, but also including transfer payments such as for old-age pensions, medical care, unemployment insurance, etc.) is available on a quarterly basis, but only in nominal terms (i.e. not inflation adjusted) and not on a seasonally adjusted basis.  The German data in the third graph was therefore shown as a share of GDP, and the lack of seasonal adjustment accounts for the quarterly fluctuation seen.  When figures are quoted in the text (such as for 2011 government expenditures and revenues) the four quarter average was used.
  • The US data comes from the Bureau of Economic Analysis (BEA) of the US Department of Commerce.

Finally, note that “government” as defined here includes all levels of government:  federal, state, and local.