The Republican Campaign to Shift the Blame for the Sequester To Obama: If You Don’t Want It, Pass a Simple Bill To End It

John Boehner Obamaquester

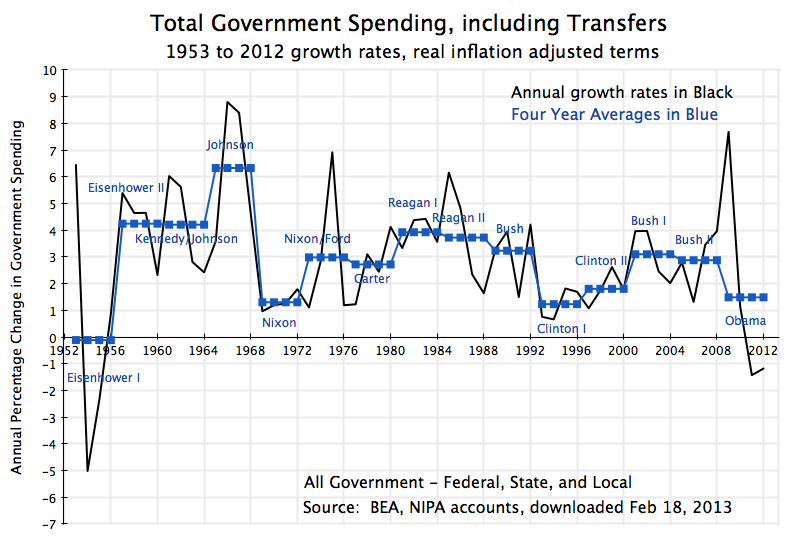
It appears increasingly likely that the Congressionally mandated severe and across-the-board budget cuts, known as the sequester, will begin on March 1.  Serious negotiations are not underway, Congress is only back in session now after having been gone for most of the past two weeks, and public statements are not focused on negotiating an agreement but rather on shifting blame.  Should the sequestration budget cuts go into effect, not only will critical federal functions be suspended, but the sudden cuts in spending levels will likely push the country back into recession.  As was noted in an earlier posting on this blog, cuts in Government spending were already the primary cause for a fall in GDP in the fourth quarter of 2012 (according to the initial estimate, which may be revised).  More broadly, had government spending been allowed to rise following the 2008 downturn as it had during the Reagan presidency following the 1981 downturn, we would now likely be at full employment.

The situation is serious, but the new assertion by the Republican leadership that the sequester is there only at the insistence of Obama is almost farcical.  As part of this campaign, Speaker Boehner has staged events for the cameras such as that pictured above, behind a podium labeled with the hashtag “#Obamaquester”, and in front of a clock marked as “Countdown to #Obamaquester”.  Boehner is now asserting that the sequester is only there due to “the president’s demand”, and he refers to the cuts as “the president’s sequester”.

Even some of Boehner’s Republican colleagues find it absurd to try to blame Obama for the sequester.  For example, Representative Justin Amash, a conservative Republican from Michigan (who voted against the bill that set up the sequester mechanism) said:  “I think it’s a mistake on the part of Republicans to try to pin the sequester on Obama.  It’s totally disingenuous.  The debt ceiling deal in 2011 was agreed to by Republicans and Democrats, and regardless of who came up with the sequester, they all voted for it.  So, you can’t vote for something and, with a straight face, go blame the other guy for its existence in law.”

With these new assertions from Boehner and similar assertions from colleagues such as Congressman Paul Ryan (the Republican Chair of the Budget Committee in the House), it may be of interest to review briefly the history of how the sequester mechanism came to be:

  1. The sequester’s origin came from the strategic decision by the key Republicans in Congress in early 2011 to use the routinely required authorization to raise the public debt ceiling as leverage to force through drastic cuts in the budget.  Eric Cantor, the then new Republican House Majority Leader, was the principal architect and proponent of the strategy, which he proposed in January 2011 at a closed-door retreat of Republican congressional members in Baltimore.  He was soon stating publicly that the Republican controlled Congress should not approve an increase in the debt ceiling without drastic spending cuts.  
  2. What this meant was that they would hold the economy hostage to their budget demands, as a refusal to raise the debt ceiling would force the US to default on its debt.  While speeches and pontificating are routine whenever Congress has had to approve an increase in the nominal public debt ceiling, never before had such demands been attached to this approval.
  3. And default on the US public debt would be serious.  US Treasury Bonds are held as risk-free assets both in the US and around the world, and are indeed the foundation of the modern international monetary system.  The impact of default on such assets cannot be predicted with certainty, as it has never happened before, but the consequences could quite possibly throw the global economy into a downturn that would make the 2008 collapse look mild. 
  4. [As an aside:  While I am not a lawyer, the constitutionality of a refusal by Congress to raise the debt ceiling (and hence force a default on the public debt) looks to me to be questionable.  The Fourteenth Amendment to the Constitution (passed in 1866, following the American Civil War) reads in its Section 4:  “The validity of the public debt of the United States, authorized by law, including debts incurred for payment of pensions and bounties for services in suppressing insurrection or rebellion, shall not be questioned.”  In their oath of office, Congressmen pledge to uphold the Constitution.  They cannot then take actions (or defer taking action) which would violate the Constitution by forcing a direct default on the public debt.  However, as noted above, I am not a lawyer, and obtaining such Congressional approval for increases in the debt ceiling has been customary since substantial borrowing needs developed during World War I.]
  5. As the country was coming increasingly close to breaching the existing debt ceiling in July 2011, negotiations were underway at many levels in Washington.  I will not try to review them all here, but the most senior were direct negotiations between Obama and Speaker Boehner.  These talks broke up when Boehner was not able to convince his Republican congressional colleagues to support an approach that included even a relatively small share of revenue increases along with larger expenditure cuts.  In fact, Boehner had to reverse himself twice from tentative agreements he had reached with the President, as he could not get backing from sufficient numbers of his Republican colleagues in Congress.  At the time, Boehner stated publicly that the President had negotiated in good faith.  But in his op-ed piece in the Wall Street Journal this month, Boehner now says the opposite, and asserts the talks failed because the President had reversed his position.
  6. As the deadlines approached and it became clear that agreement would not be possible on a specific set of spending cuts and revenue increases, Jack Lew, then the head of the Office of Management and Budget in the White House (and soon likely to be US Treasury Secretary), suggested consideration of a mechanism that had been used in the 1980s, in budgetary negotiations during the Reagan term.  In its final form and as passed by Congress, the mechanism established a Joint Committee made up of 12 members of the Senate and Congress (split evenly between Republicans and Democrats), who would by a certain date (November 21, 2011) develop a plan to achieve $1.2 trillion in deficit reduction (over 9 years) through a combination of spending cuts and revenue increases.  If the Joint Committee could not reach agreement, an automatic cut in spending of $109 billion per year over nine fiscal years (FY2013-21) would be required, split evenly between Defense and non-Defense programs.  These automatic across-the-board cuts were known as the “sequester”, and were deliberately crude and draconian to serve as an inducement to the Joint Committee to reach an agreement on more palatable means to achieve a similar reduction in the deficit.
  7. The mandate of the Joint Committee was to reach agreement on measures that would reduce the deficit by $1.2 trillion over ten years.  Such measures could include both spending reductions and revenue increases.  And the revenue increases could be achieved not only by raising tax rates, but also by closing tax loopholes, cutting expenditures that are implemented via tax subsidies, and/or broadening the tax base.  But the Joint Committee never reached an agreement, as Republicans refused to agree to any revenue measures at all.
  8. At the time, Boehner, Paul Ryan, and other Republicans praised the sequester mechanism as a means to force what they were seeking.  Boehner famously said in a CBS interview on August 1, 2011, that he had gotten “98%” of what he wanted.  Ryan emphasized and praised the sequester mechanism in an interview on Fox News on August 1.  Following his recent reversal now to criticize the sequester, a YouTube video was even put together showing a series of Ryan statements over the years in favor of sequester mechanisms (including this one specifically) and statutory spending caps.  And a Power Point presentation put together by Boehner when he made the case to his Republican colleagues to vote in favor of the bill that established the sequestration mechanism, makes clear his approval of it at the time.
  9. Obama, in sharp contrast, had always wanted a clean bill authorizing an increase in the public debt ceiling, without additional conditions added on.  It is indeed rather absurd to think that Obama would want to see a bill passed that would deliberately tie his hands.  Obama had proposed alternative approaches to reducing the deficit, including in his FY2013 budget (in great detail) and during the negotiations with Boehner.  Obama still stands by these proposals.  But while the Republicans assert that Obama has not offered any such plans, the issue is rather that the Republicans have rejected the plans Obama has offered.
  10. Jack Lew only suggested the option of the sequester mechanism as a fallback if no agreement is reached, late in the negotiations when it became clear that agreement on a specific set of spending cuts and revenue increases would not be possible.  But Obama and Lew would have greatly preferred a clean bill without any such conditions.  It is absurd to say, as Boehner now does, that the sequester mechanism is there only because it was something Obama “insisted upon in August 2011”.

The automatic sequester will cut government expenditures by $85.3 billion over the remainder of the fiscal year, from March 1 to September 30, 2013.  If nothing is done, there would be further cuts of $109.3 billion in each of the next eight fiscal years to FY2021.  The $85.3 billion cut over seven months would be equal to roughly 1% of the seven month GDP.  With a multiplier of two, this would by itself drive down GDP by 2% from what it would be otherwise.  The Congressional Budget Office estimates that the US economy is producing at about 5 1/2% below what it potentially could be producing at full employment.  An additional 2% reduction would be significant.

Agreement is difficult in Washington, particularly in the current political environment.  But if Boehner, Ryan, and others now hold to the view that the sequester is a bad idea, there is a simple solution.  All that they would need to do would be to pass a simple bill which revokes it.  Obama would certainly sign it.  The budgetary mechanism would then revert to the standard process, and that standard process could be followed to determine whether certain public expenditures should be cut and by how much, and whether revenues should be increased by closing loopholes, cutting tax subsidies, raising rates, or some other approach.

But there is nothing that requires the sequester mechanism.  If Boehner, Ryan, and the others do not want it, they can pass a simple bill to end it.

Government Spending During Obama’s First Term – The Facts

Govt 2 During Presidential Terms - Cons & Invest, 1953-2012

A.  Introduction

Republicans continue to assert that government spending has exploded under Obama.  It is a myth.  Depending on which specific measure of government spending is used, such expenditures have either fallen during Obama’s presidency or have increased at one of the lowest rates in the last six decades.

This myth is unfortunately important as conservative politicians continue to use it aggressively to push for drastic cuts in government spending, despite the damage such cuts have done to the economic recovery.  And drastic government spending cuts loom with the rapidly approaching deadline of March 1 when the automatic across-the-board sequester budget cuts will enter into force, unless Congress pulls back from the brink before then with new legislation.  Yet as of this writing, Congress is on vacation, and there is little sign that any agreement will be reached by March 1.  An already weak economy (GDP fell by 0.1% in the fourth quarter of 2012 largely due to government spending cuts in that quarter), will almost certainly be driven into decline if the sequester spending cuts happen.

Yet Republican leaders continue to assert big increases in government spending during Obama’s presidential term are the source of the economy’s problems.  A recent example was in the formal Republican response (by Senator Rubio of Florida) to Obama’s State of the Union address.  Rubio asserts that the rise in government under Obama is the cause of our weak economy, and that our problems would be solved by cutting government spending.  But government spending has not risen as he asserts.

B.  Government Consumption and Investment Expenditures

Government consumption and investment expenditures have in fact fallen during Obama’s presidential term.  It is the first such fall in 40 years.  And such government spending rose fastest in this period during the presidential terms of Reagan and George W. Bush.

The graph above shows the growth rates for government spending on consumption and investment as recorded in the National Income and Product Accounts (often referred to as the GDP accounts) published by the Bureau of Economic Analysis of the Department of Commerce.  Such government spending accounts for one component of GDP (along with private consumption, private investment, and exports less imports).  It encompasses all direct spending by government on goods and services, and does not include government transfer payments (which will be considered below).  We now have such data for the full four calendar years of Obama’s presidential term, and can compare the record during Obama’s term to that during previous presidential terms.

Earlier posts on this blog have noted that such fiscal spending has in fact been falling for much of Obama’s term, and that this has acted as a drag on the recovery (see here, here, here, and here).  The now complete data for the full four years of Obama’s first presidential term shows that such government spending fell sharply in both 2011 and 2012, and that while there was growth in 2009 with the stimulus package, the average rate of growth over the full four years of Obama’s term has been negative.  Such government spending is now less than when he took office.

This government spending (all figures in real, inflation adjusted, terms) fell at an average annual rate of 0.2% during Obama’s term.  This fall can be contrasted with the substantial increases during George W. Bush’s two terms, and the even larger increases during Reagan two terms.  (See the graph above, and the table at the bottom of this post provides the specific numbers.)  The only comparable performance to Obama in recent decades was the growth of close to zero during Clinton’s first term.  One would have to go back 40 years, to Nixon’s 1969-72 presidential term, before one again sees a fall in government spending as one had under Obama.  There was also a fall during Eisenhower’s first term, as spending fell sharply in 1954 and 1955 following the end of the Korean War in 1953.

It should be noted that there is certainly no reason to aim for zero growth of government spending over the long term.  Over the sixty years from 1952 to 2012, real GDP grew at a 3.0% annual rate, so real government spending could also grow at a 3.0% annual rate and leave the spending we do as a society for public goods such as infrastructure, education, defense, and so on, at a constant share of GDP.  And it is interesting to note that despite the Republican complaints on government spending, the only periods when government spending grew at a 3% rate or faster over the last 60 years were during the first George W. Bush term, the second Reagan term, the Kennedy/Johnson and Johnson terms, and almost the second Eisenhower term (growth then at a 2.8% annual rate).

The average rate of growth of government spending for goods and services over the full 60 year period was indeed only 1.9% a year in real terms, and hence such government spending as a share of GDP has fallen.  This is the fundamental reason our infrastructure is falling apart and our public services are so poor compared to that found elsewhere among the richer countries of the world.

C.  Total Government Spending, including Transfers

One can reasonably argue that a better measure of government spending is not simply that which enters directly into the GDP accounts (expenditures by government directly on goods and services), but which includes also expenditures by government on transfer payments.  Transfer payments are made by government to others, without goods or services provided in return.  They are mostly to households (such as for Social Security, Medicare and Medicaid, unemployment insurance, and similarly), but include also subsidies to corporate and business entities (such as for agricultural subsidies, energy subsidies, and similarly) as well as interest payments on public debt.  There are also significant transfer payments between levels of government (e.g. federal to state, federal to local, and state to local), but these are netted out for spending at all government levels (but federal transfers will be included when federal spending alone is discussed below).

By this measure as well, the rate of growth of government spending during the Obama term has been one of the lowest in decades:

Govt During Presidential Terms - Total Spending, 1953-2012The rate of growth of such government spending during Obama’s first term was just 1.5% a year, with absolute falls in 2011 and 2012.  This is well below the growth during the two terms of George W. Bush, the term of George H. W. Bush, and the two terms of Reagan.  And it is noteworthy that this slow overall growth in total government expenditures during Obama’s term was achieved despite the collapsing economy and resulting high unemployment that Obama inherited on taking office.  The collapsing economy Obama confronted automatically drove up expenditures on unemployment insurance, food stamps, and other safety net programs, all of which count as government transfer programs.  Hence (and along with spending from the stimulus package) there was a sharp peak in 2009, with this increase critical to stopping and then reversing the economic collapse.  But this was then followed by a sharp fall in government spending soon thereafter, which slowed the recovery.

The only comparable periods of such slow growth in total government spending in the last 60 years were during the two Clinton terms and the Nixon term, while such spending was flat during the first Eisenhower term, when Korean War spending ended.

D.  Federal Government Spending Only

The analysis so far has covered expenditures at all levels of government – federal, state, and local.  It is such expenditures which matter in terms of impact on the economy.  And consolidation makes sense as transfers from the federal level cover a substantial share of expenditures that are then carried out by state and local governments.  However, if one wants to focus more narrowly on government expenditures where the role of the president is more direct, then a case can be made to focus exclusively on expenditures at the federal level.  The president is still not omnipotent, as expenditures will depend on budgets passed by the Congress as well as on laws that established programs many years before (such as Social Security or Medicare) .  But the influence of the president will be more direct when focused on federal only expenditures.

Here again, growth in government expenditures during Obama’s term in office has been one of the lower ones of recent decades, and in particular well below the growth seen under Bush or Reagan.  First, for government direct spending on goods and services:

Govt During Presidential Terms - Fed only Cons & Invest, 1953-2012Such expenditures grew at an annual rate of 1.3% over Obama’s term, with out right reductions in 2011 and 2012.  In contrast, such expenditures grew at rates of 5.5% in George W. Bush’s first term and 2.9% in his second, and at rates of 4.6% in Reagan’s first term and 3.8% in his second.  Yet Republicans assert that Obama must be blamed for a rapid expansion in government spending over his term, while Reagan and Bush are praised for their promises to cut government.

In sharp contrast to the increases under Reagan and George W. Bush, federal government expenditures on consumption and investment were cut sharply during Clinton’s first term (at a rate of -2.9% a year), and were basically flat during Clinton’s second term.  There is no basis for the attack that such spending increases at explosive rates under Democrats.

One can similarly look at federal government total spending, including transfers (to households and businesses, and also here transfers from the federal level to the state or local levels):

Govt During Presidential Terms - Fed only Total Spending, 1953-2012

Here again, the growth under Obama has been moderate, with growth at a rate of just 2.7% a year, despite the consequences for mandated expenditures in programs such as unemployment insurance and food stamps that resulted from the economic collapse that Obama inherited.  And despite the weak economy (and indeed contributing importantly to that weakness), federal government total expenditures fell in 2011 and 2012.

Furthermore, growth in such expenditures were higher during the the two terms of George W. Bush, during the term of George H. W. Bush, and during the two terms of Reagan.  They were significantly slower during the two Clinton terms.  Here again, there is no basis for the assertion made by Republicans that Democrats are responsible for sharp growth in government spending, while the Republican presidents have kept it low.

E.  Conclusion

It is important to know the facts when making statements asserting that government spending has exploded under Obama, with this then asserted as the cause of the slow recovery.  In fact, the opposite is true, with government spending either falling during the term of Obama’s presidency or rising at a slower rate than seen in recent Republican presidential terms.  This has then diminished demand for goods and services, and hence has slowed a recovery where the problem is lack of demand to make use of currently underemployed resources (with high unemployment as well as low capital utilization rates).

What has been high in recent years is not government spending, but rather the fiscal deficits.  But these have been high due both to the 2008 economic collapse and slow recovery (which diminished tax revenues and raised certain government expenditures, such as for unemployment insurance), but more importantly to lower tax rates stemming from a series of tax cuts enacted over the last decade (starting with the Bush tax cuts of 2001 and 2003) and continuing into the Obama term.  The size and impact of these tax cuts were discussed in a previous posting on this blog.  These tax cuts reduced government revenues and, along with the impact of the downturn, account for most of the resulting fiscal deficit.  The problem is not high government spending, as government spending has either not grown or has grown only slowly.  The problem, rather, is low government revenue.

=====================================================

Table of Data, and Technical Notes

The specific numbers on four-year growth rates by presidential terms going back to Reagan are presented in the following table:

real average annual growth rates Obama Bush II Bush  I Clinton II Clinton I Bush Reagan II Reagan I
2009-12 2005-08 2001-04 1997-00 1993-96 1989-92 1985-88 1981-85
A)  All Levels of Govt
  1)  Direct Spending -0.2% 1.4% 3.0% 2.4% 0.2% 1.9% 4.2% 2.4%
  2)  Total Spending 1.5% 2.9% 3.1% 1.8% 1.2% 3.2% 3.7% 3.9%
B)  Federal Govt only
  1)  Direct Spending 1.3% 2.9% 5.5% 0.1% -2.9% 0.4% 3.8% 4.6%
  2)  Total Spending 2.7% 4.0% 4.0% 0.9% 0.8% 3.0% 3.0% 4.5%

Direct spending is all government spending directly on the purchases of goods and services.  Such spending is for either government consumption or for government investment, and is the government spending presented in the standard GDP accounts.  Government investment is in gross investment terms (i.e. estimated depreciation is not subtracted).  The price deflator used is as estimated by the BEA in the GDP accounts.

Total spending is direct spending by government on goods or services plus transfer payments.  Inter-governmental transfers (e.g. from the federal to the state level, state to local, or federal to local) are netted out in the figures for spending at all government levels together, but federal transfers to state or local governments are counted when federal only spending is calculated.  Transfer payments are mostly to households (such as for Social Security, Medicare, unemployment compensation, food stamps, and so on), but also include transfers to businesses (such as for agricultural subsidies and energy subsidies) and interest payments on public debt.  Since most are to households, these transfer payments were deflated using the personal consumption deflator estimated by the BEA in the GDP accounts.

The Long-Term Damage From Keeping the Bush Tax Cuts

CBO Revenue Projections - Extended Baseline vs Alternative Fiscal Scenario, 2012to 2037

The US Senate has voted in favor of a package of measures to avert temporarily the so-called “fiscal cliff” (but in doing so, has set up a new cliff that will hit in two months).  As I write this, it is not yet clear whether the House of Representatives will vote to pass this compromise, or will try to amend it, or will attempt something else, but right now a vote appears imminent.

But there is one aspect of the deal which has not received much attention in at least the public discussion of what is being voted on:  While it is recognized that extending the Bush Tax Cuts will slash government revenues over the ten year period being discussed (2013 to 2022), little attention has been paid to the long term impact if the Bush Tax Cuts were made permanent.

The Bush Tax Cuts were originally passed under legislation where they would expire on December 31, 2010.  With the economy then still extremely weak, Obama signed legislation in December 2010 to extend the cuts for a further two years, to December 31, 2012.  Other recent tax measures (including in particular the effective rates for the Alternative Minimum Tax) also were set with an expiration date of December 31, 2012.  The issue being debated in the Congress is whether these tax cuts should be extended again, in whole or in part.  Both Obama and the Republicans have been in favor of extending them for most households.  The debate has centered on whether taxes should be allowed to revert to what they were during the Clinton years for households with incomes over $250,000 a year, over $450,000 a year, or over $1,000,000 a year, or some other number within that range.  This corresponds to extending the Bush Tax Cuts permanently for approximately 97% of the population ($250,000), 99.3% of the population ($450,000), or 99.7% of the population ($1,000,000).

The bill passed by the Senate would extend the Bush Tax Cuts permanently for the 99.3% of households earning up to $450,000 a year.  That is, almost everyone would continue to pay the lower tax cuts first passed during the Bush Administration.  Even the remaining 0.7% of the population would see their taxes fall similarly on their first $450,000 of income.  Beyond that, their marginal tax rates would revert to those that applied during the Clinton years.

Since the richest 0.7% earn so much more than the rest of us, there would still be a substantial increase in tax revenues paid.  The estimate is that the tax measures in the bill passed by the Senate would raise tax revenues by about $600 billion over the ten years 2013 to 2022 (i.e. by $60 billion per year).  There would have been an estimated extra $4.5 trillion in revenues over the ten years if the Bush Tax Cuts and the other tax measures had been all allowed to expire.  The $600 billion is only 13% of the $4.5 trillion.  That is, 87% of the Bush Tax Cuts (and related tax cuts) are made permanent.

The problem of what to do about the fiscal deficit over the next ten years will therefore largely remain.  As Jeff Sachs has noted in a recent column, without the revenues that will be lost by making the bulk of the Bush Tax Cuts permanent, it will be hard to pay for the basic government programs that most consider important.  But what few have noted is that extending the bulk of the Bush Tax Cuts not only hurts the fiscal balance for the next ten years, but makes the situation far worse beyond that.

The graph above shows projected federal government revenues up to the year 2037 under two scenarios:  where the Bush Tax Cuts (and AMT and other related tax measures) are allowed to expire as scheduled (the Extended Baseline Scenario), and where these tax cuts are instead made permanent (the Alternative Fiscal Scenario).  The projections are from the Congressional Budget Office in their Long-Term Budget Outlook, of June 2012.  We do not yet have what the projections would be to 2037 under the Senate bill, where taxes are allowed to revert to previous levels only for those earning over $450,000.  However, since this would recover only 13% of the revenues that would be lost if the Bush Tax Cuts were extended for everyone, the curve would lie between the two shown above, but relatively close to the curve labeled the Alternative Fiscal Scenario.

If the tax cuts are made permanent for all, the CBO projects that federal revenues would recover over the next three years from their current very low levels (low due to the economic downturn), but then flatten out and not rise above 18.5% of GDP even in the very long term.  In contrast, if the tax cuts were allowed to expire for all, federal revenues would first recover, but then continue to rise slowly to 21% of GDP by 2021, to 22 1/2% of GDP by 2030, to 23 1/2% of GDP by 2036, and to continue on that rising path beyond that.

The increase in taxes as a share of GDP over time, were the Bush tax rates allowed to expire and revert to their previous levels, is interesting and important.  The tax share is projected by the CBO to increase because GDP is projected to grow over time, and under the previous tax regime the tax system was progressive, with higher incomes leading to higher tax rates and hence higher tax collections.  In contrast, under the tax regime brought on by the Bush Tax Cuts, the system is no longer progressive:  When GDP grows over time, those receiving the higher incomes will only pay taxes at rates similar to those who are poorer, so taxes as a share of GDP remains flat.

This loss in progressivity of the tax system may well be the most damaging aspect of the Bush Tax Cuts.  Relative to the previous system with progressivity, the tax cuts have led not only to a loss in revenues, but also to a system where on average higher incomes do not result in a higher rate of taxes on that higher income.  As Warren Buffett has noted, a person as rich as he is will pay, under the current tax system, a lower rate of taxes on average than his secretary.  This will not change significantly under the bill passed by the Senate.  And the losses in revenues as a share of GDP become steadily larger over time as the economy grows.

The losses in revenues are huge.  They start at about 2 1/2% of GDP from 2014 to 2020, but then rise to 4% of GDP by 2030 and to 5% of GDP by 2036.  Keep in mind that future governments could decide that such extra revenues are not needed.  If so, they could then  enact tax cuts of a size and structure suitable for the time.  But it is far easier to legislate tax cuts in the American political environment than it is to legislate tax increases when extra revenues are needed.

With the difficult long term fiscal outlook that most foresee for the US, an ability to raise adequate revenues will be critical to the country’s long-term financial stability.  But I should add that while this is a critical long-term problem, this does not mean that the Bush Tax Cuts should all end immediately, as they would have under the fiscal cliff.  Unemployment, while better than three years ago, remains high.  Rather, the optimal path would be to phase them out over the next few years.  A reasonable policy would be to link them to the unemployment rate.  To start, taxes would revert now to those of the Clinton period (when growth was solid, and the fiscal accounts moved to surplus) for those with income over $250,000.  Taxes would then revert to Clinton period rates for those with income of over $100,000, say, when the unemployment rate had fallen from the current 7.7% to a rate of perhaps 7%, and then taxes would revert for everyone once unemployment had fallen to below 6%.

But under the Senate passed bill, this will not happen.