ObamaCare Has Not Led to a Shift of Employees From Full-Time to Part-Time Work

Part-Time Employment #2 as Share of Total Employment, Jan 2007 to Sept 2013

Conservative media have repeatedly asserted that due to ObamaCare (formally the Affordable Care Act), there has been and will be a big shift of workers from full-time to part-time status.  Publications such as Forbes, the Wall Street Journal, and of course Fox News, have asserted that this is a fact and a necessary consequence of ObamaCare.  The argument is that since ObamaCare will require employers to include health care benefits as part of the wage compensation package to full time employees (defined as those who normally work more than 30 hours a week for the firm), firms will have the incentive, and by competition the necessity, of shifting workers to part-time status.  It is argued that instead of employing three workers for 40 hours each (for 120 employee hours), firms will instead employ four part time workers at just below 30 hours each to obtain the 120 employee hours.

There are a number of problems with this argument.  First, the ObamaCare requirements for health coverage only apply to firms with more than 50 full time employees.  There is no change for firms employing fewer than 50 workers.  Second, almost all of the firms in the US with more than 50 employees, and indeed a majority also of the workers in firms of fewer than 50 employees, are already in firms that provide health insurance coverage for their workers.   Specifically, 97% of the workers in firms with more than 50 employees are in firms offering health insurance coverage as part of their wage compensation package.  ObamaCare will require this (to avoid a per worker penalty) to go from 97% to 100%, which is not a big change.  And even though ObamaCare will not have such a requirement for firms employing fewer than 50 workers, it is already the case that 53% of the workers in such firms are in firms providing health insurance coverage.   Firms provide health insurance coverage as part of the total compensation package they pay their employees both because they have a direct interest in having healthy workers, but also because there are tax and financial advantages to doing so.

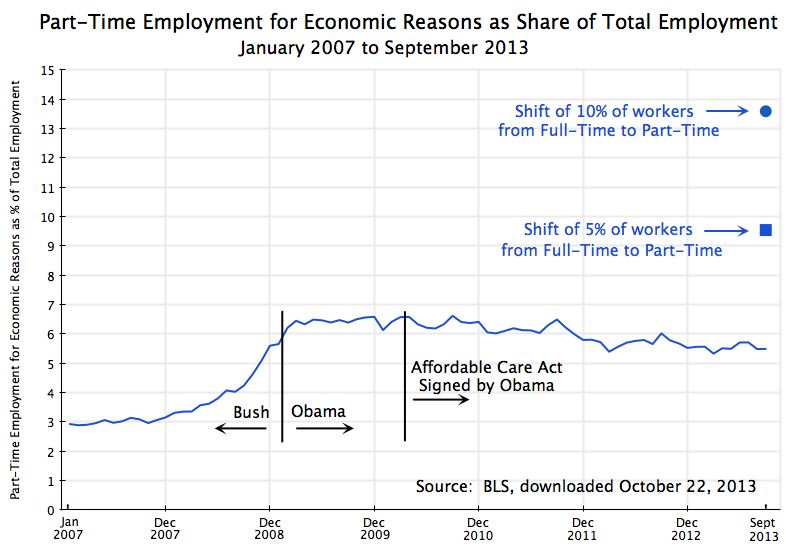
Notwithstanding these issues, the conservative media and Republican politicians continue to assert that ObamaCare is leading to a large substitution of part-time for full-time workers.  But as Jason Furman, the Chairman of the Council of Economic Advisors in the White House has recently noted, this is not seen in the data.  The graph at the top of this blog post is one way to look at this data.

The graph shows the share of part-time workers (part time for economic reasons and not part time by choice) in all workers, by month, for the period from January 2007 to September 2013.  The data come from the Bureau of Labor Statistics.  If ObamaCare is leading to a large shift of workers from full-time to part-time status, then this ratio would be rising since ObamaCare was passed or at some more recent date.  But it is not.

The share of part-time workers in all workers rose in the last year of the Bush administration due to the economic crisis, from about 3% before to about 6 1/2% after.  It was rising rapidly as Obama took office, but stabilized soon thereafter as the economy began to stabilize with the passage of Obama’s stimulus package and aggressive actions by the Fed.  Since then the ratio has trended downwards, albeit slowly.  As has been noted previously in this blog, the continued fiscal drag from government expenditure cuts since 2010 has held back the economy and hence the recovery in the job market.  The blog post noted that if government spending had simply been allowed to grow at its long term average rate, we would likely have already returned to full employment (and would have returned to full employment in 2011, if government expenditures had been allowed to rise at the same pace as they had during the Reagan years).

The Affordable Care Act was signed by Obama in March 2010.  As the graph above indicates, there was no sharp change in trend once that act was signed.  If anything, the share of part-time workers in all workers then began to decline from a previous steady level.  Such a response is the opposite of what the conservative media and Republican politicians have asserted has been the result of ObamaCare coming into effect.

To put the figures in perspective, the graph above also shows how high the ratio of part-time workers to all workers would have had to jump, had either just 5% (the square point) or 10% (the round point) of full-time workers been substituted for by an equal number of part-time workers, additional to where the September 2013 ratio in fact was.   An equal number is used between the full-time and part-time workers to be conservative in the estimate.  The argument being made by the critics is in fact that a higher number of part-time workers would have been hired to substitute for the full-time workers let go, to get the same number of working hours.  But even with an equal number being substituted, such a shift of 5% of the workers would have led to rise in the ratio by 74% relative to where it was in September 2013, and a shift of 10% would have led to a rise of 148%.  One does not see anything like this.

It is not known what the paths would have been to reach those 5% or 10% shifts, but the resulting changes in the paths would have been obvious.  Such changes did not occur.  Since one is comparing the figures to what otherwise would have been the case, the conservative critics would need to argue that the ratio of part-time to all workers would have plummeted in the absence of ObamaCare.  There is no reason given on why this would have been so.  Furthermore, for the case of a 10% shift the number of part-time workers would have had to be negative in the absence of ObamaCare, which is of course impossible.

There is simply no evidence to support the assertion in the conservative media that ObamaCare is leading a significant share of firms to shift workers from full-time to part-time status.

The Impact of Health Reform on Jobs: The Evidence from Massachusetts is Positive

Share of Massachusetts in US Employment, Jan 1990 to Aug 2013

A.  The Assertion

Republicans have repeatedly asserted that the Affordable Care Act signed into law in 2010 (also often referred to as ObamaCare) will be, and indeed already has been, a “job-killer”.  The Republican controlled Congress has voted repeatedly to repeal the health reform, starting once they took control of the chamber in January 2011 (with the first such bill titled “Repealing the Job Killing Health Care Law Act”), and with over 40  such party-line votes since then.

But while the Republicans have vociferously asserted that the health care reform law has and will “kill jobs”, is there any evidence that such a law will indeed do this?  The assertion is particularly odd as the major reform under the law, that of establishing competitive market exchanges through which the currently uninsured will be able to purchase affordable health coverage from private insurers, has not even gone into effect yet.  The exchanges are scheduled to open only on October 1, and coverage will not begin for policies purchased on the exchanges until January 1, 2014.

Once the law goes fully into effect, we may be able to find from the data whether the impact of the health reform law had a negative, or a positive, impact on jobs.  But until then we can look at the impact a very similar reform that may shed light on what to expect.

Specifically, what has come to be called “ObamaCare” was modeled on a very similar health reform passed in Massachusetts in 2006.  That reform was signed into law by then Governor Mitt Romney on April 12, 2006, and entered into implementation in phases starting in late 2006.  The poor were first enrolled into a subsidized health insurance program, and then competitive market exchanges for health insurance for other individuals opened on May 1, 2007.  An individual mandate to have insurance from some source began on July 1, 2007.  If this health care reform is a job killer, one would expect to find that job growth in Massachusetts from 2007 and for the next several years to be relatively slower than job growth in the rest of the US.  The share of Massachusetts in total US jobs would then fall.  Did that happen?

B.  The Evidence

The graph at the top of this post shows employment in Massachusetts (using BLS data) as a share of employment in all of the US from 1990 (when the series on state employment starts) to now, including the period before and after 2007.  The Massachusetts shares of overall employment (including government) as well as private employment only, are shown.  (The private employment share is higher than the overall employment share since the share of government employment in Massachusetts is relatively less than it is elsewhere in the country, despite what some people appear to assume).

The trend from 1990 up to 2007 was for the share of Massachusetts in national employment to fall.  Massachusetts is a relatively small and mature state, and employment in the US in the period was focused more on the Sun Belt states.  But it is then striking how this turned around precisely in 2007, as the Massachusetts Health Care reform entered into effect.  If such a health reform had been a “job-killer”, then the Massachusetts share in national employment would have fallen in 2007 and the following years.  One would at least have seen a continuation of the previous downward trend.  But instead the share turns sharply up starting in 2007, with this continuing to about 2010/2011 before it levels off and then perhaps resumes the previous trend.

One should of course not put too much weight on this one observation.  There was much else going on in the economy at that time, which might account for why job performance in Massachusetts was relatively better than elsewhere in the US in 2007 and subsequent years.  In particular, the economy collapsed in 2008, in the last year of the Bush Administration, pushing up national unemployment in 2008 and 2009 until the stimulus program of the new Obama Administration plus aggressive Fed actions turned this around.  The 2008 collapse could have differentially affected Massachusetts.  However, the change in the trend in Massachusetts began before national unemployment started to rise.

Furthermore, while one sees also a similar (but much smaller) peak in the graph starting with a rise from the beginning of 2000 and then a fall in 2001, this rise and fall did not coincide with the increase in unemployment during the first few years of the Bush Administration.  National unemployment started to rise only in January 2001, and then reached a peak in June 2003.  Finally, from 1990 to June 1992 there was also a rise in national unemployment, during the Bush I Administration, but this coincided with a steady fall of the share of Massachusetts in total national employment over the period.  This was the opposite of the pattern seen in 2007 to 2010.  There does not appear to be a consistent pattern that the Massachusetts share of US employment rises in recessions, so one would need to be careful to argue that this must explain what happened in 2007-10.

C.  Conclusion

The rise in the share of employment in Massachusetts in overall US employment following the implementation of the Massachusetts Health Reform in 2007 is therefore consistent with the view that such reforms are not job-killers.  Following the implementation of the health reform, job growth in Massachusetts was relatively faster (or job cuts were relatively slower, during the peak of the downturn) than elsewhere in the US, with this lasting for several years.  While too much should not be read into this finding and assume that it implies health reform will spur a sharp increase in jobs, it is certainly not consistent with the assertion made by the Republicans that such health reform will necessarily be a dramatic killer of jobs.

We Have a Revenue Problem: Government Debt to GDP Would Fall Without the Bush Tax Cuts

Debt to GDP Ratio, FY1790 to 2038, no Bush Tax Cuts

A.  Debt to GDP Would Fall Without the Bush Tax Cuts

If the Bush tax cuts had not been extended at the start of this year for almost all households, the public debt to GDP ratio would be falling rapidly.  Even though health care costs are rising and Social Security payments will need to increase as baby boomers retire, the US would be generating more than sufficient tax revenues to cover such costs, if we simply had reverted to the tax rates that held prior to the Bush tax cuts.

The figures on this can be calculated from numbers provided by the Congressional Budget Office with its annual Long-Term Budget Outlook, which was published earlier this week.  Most of the attention paid to the report focussed on the base case projection by the CBO of the public debt to GDP ratio if nothing changes in current policy.   The ratio had risen sharply as a consequence of the economic collapse of 2008, in the last year of the Bush administration, and subsequent weak recovery.  But with the economy recovering and with other measures taken, the ratio is now projected to stabilize and indeed fall modestly for several years.  However, the ratio would then start to grow again in fiscal year 2019, and especially after 2023.  As the graph above shows, the CBO projects that, under current policy, the debt to GDP ratio would rise to 100% of GDP by fiscal 2038, reaching levels last seen at the end of World War II.

This has been interpreted by Republicans as a runaway spending problem, and have asserted this calls for further sharp cuts.  But the data issued by the CBO with its report allows one also to work out what the consequences were of allowing most of the Bush tax cuts (primarily – there were also some other tax measures) to be extended from January 1, 2013.  The Bush tax cuts had been scheduled to expire on that date.  They were instead extended and made permanent for all but the extremely rich (those households earning more than $450,000 a year, the richest 0.7% of the population).

Specifically, the CBO provided in the projections it had made last year (in 2012) what public revenues would have been if the tax cuts had expired, as scheduled, at the start of 2013.  The new report provides those figures for comparison, updated to reflect the new methodology for GDP that the BEA adopted in July.  One can combine those revenue projections with CBO’s current projections of non-interest expenditures, along with a calculation of what interest would then be on the resulting (lower) debt, to estimate what the fiscal deficit and debt to GDP figures would then be.

The resulting path of federal government debt to GDP is shown as the green line in the graph above.  The debt to GDP ratio plummets.  Instead of reaching 100% of GDP in fiscal 2038, it instead would fall to just 37% of GDP in that year.  And a simple extrapolation of that line forward would bring the debt all the way to zero in a further 24 years.

The extension of the Bush tax cuts for most households can therefore, on its own, more than fully account for the projected rise in the public debt to GDP ratio.  With tax rates as they had been under Clinton, there would be no debt issue.

B.  A Longer Term Perspective

The CBO report also provides data on the federal government debt to GDP ratio going back to the founding of the republic in 1790.  I have put the projected paths on a graph with the history to put them in that context.  The fall in the debt ratio that would follow if the Bush tax cuts had not been extended is similar to the falls seen in that ratio in the periods following the Revolutionary War, the Civil War, World War I, World War II, and during the Clinton years following the run-up during the Reagan and first Bush presidencies.

Public debt reached a peak of 106% of GDP in fiscal year 1946, at the end of World War II.  The ratio then fell steadily in the 1950s and 1060s, and was just 25% in 1981, at the end of the Carter presidency.  It fell during this period not because there were large budget surpluses, but rather because of generally strong economic growth.  This also shows that strong growth is possible even if the debt ratio is as high as 106%, undermining the argument made by the economists Carmen Reinhart and Ken Rogoff in a 2010 paper, that debt in excess of 90% of GDP will lead to a sharp reduction in growth.  Republican politicians had quickly jumped on the Reinhart and Rogoff conclusion, arguing that this work supported their views.  But aside from numerous counterexamples, such as the US after World War II, researchers later discovered that there had been a coding error in the spreadsheet Reinhart and Rogoff used to assemble their data.  More fundamentally, researchers showed that to the extent there is a relationship between high debt and slow growth, it is that downturns and slow growth lead to a rise in the debt to GDP ratio (as we saw in the US after the 2008 collapse), rather than that a high debt ratio leads to slow growth.

The debt ratio then rose sharply during the Reagan and first Bush presidencies, rising from 25% of GDP in fiscal 1981 to 48% in fiscal 1993.  This was the first such rise in the debt ratio in American history, aside from the times when the country went into war or at the start of the Great Depression.  During the Great Depression the ratio rose during the Hoover years from 15% in fiscal 1929 to 39% in fiscal 1933, and then to 43% in fiscal 1934.  But it is interesting that during the Roosevelt presidency, and in stark contrast to the common view that the New Deal was characterized by big increases in government spending, the ratio then stayed in the range of 40% to 44% until 1942, following the entry of the US into World War II.

The debt ratio then fell during the Clinton presidency, from 48% in fiscal 1993 to 31% in fiscal 2001.  But with the Bush tax cuts and then the 2008 collapse, the ratio rose to 52% in  fiscal 2009, and to 73% this year.   As noted above, the ratio would now start to fall again if the Bush tax cuts had not been extended, reaching a projected 37% in fiscal 2038.  But with most of the Bush tax cuts made permanent, the ratio (with the same government spending levels) is instead projected to rise to 100% in that year.

C.  Conclusion

The first step in addressing some problem is to understand the cause.  The cause of the current fiscal problems, which if not addressed would lead to a public debt rising to 100% of GDP by fiscal 2038, is the Bush tax cuts.

An earlier post on this blog looked at what the debt to GDP ratio would have been had the Bush tax cuts never been enacted (in 2001 and 2003) and the Afghan and Iraq wars had not been launched.  It found that even assuming the 2008 economic downturn would still have occurred, the public debt to GDP ratio would have risen only to about 35% by fiscal 2014, and would then start to fall.  That post also showed that even assuming the cost of the wars and with the Bush tax cuts in place from 2001 to 2013, phasing out the tax cuts starting in fiscal 2014 would have led the public debt to GDP ratio to fall until at least fiscal 2022 (the last year in the CBO figures then available).

The current post has made use of the CBO’s new long term projections, and finds that if the Bush tax cuts had not been extended at the beginning of 2013, the debt to GDP ratio would be on a sharp downward path to at least fiscal 2038.  The current conventional wisdom appears to be that rising health care costs and the increase in the number of retirees as the baby boom generation reaches 65 means that a rise in the debt to GDP ratio is inevitable, unless there are sharp cut-backs in Medicare and Social Security.

But that is not the case.  The debt ratio would be falling rapidly if it were not for the Bush tax cuts.