 A. Introduction
As many are aware, based on the most recent forecast and if nothing is done, the Social Security Trust Fund is expected to be fully depleted by 2035. Under current law that sets the operating rules for the Social Security system, benefit payments made to retirees and the disabled would then have to be scaled back to a level that would match the Social Security taxes being paid into the system each year. This would mean a reduction of about 16% (based on current forecasts) from the payments that retirees and other beneficiaries of the system would have otherwise received in 2035.
That would be catastrophic. Retirees and others depend on their monthly Social Security checks, and slashing those by 16% would mean a dramatic fall in the living standards of many. In the aggregate, the cut in payments would amount to about 1% of GDP. Even if one were to ignore the impact on the retirees who depend on their Social Security checks, a sudden scaling back of those payments by 1% of GDP could very well throw the economy into a recession.
What would happen if Congress were instead to fund that shortfall through the regular federal budget? The amount is certainly large, at 1% of GDP or, in terms of the GDP forecast for 2035, about $425 billion. How much would the federal deficit (and federal borrowing needs) then increase relative to what it would have been before the Trust Fund was depleted?
The answer is: Nothing. None. Zero. Zilch. Nada. Not a dime.
There would be no impact on the deficit. Government borrowing in the financial markets would be exactly the same as before. It is true that the deficit would fall if Social Security payments were slashed by 16% from one day to the next. Leaving aside the resulting disruption this would cause for the economy – as a sudden cut in payments of 1% of GDP would certainly depress output and increase unemployment – the fiscal deficit would indeed be smaller if Social Security payments were reduced. But compared to what it was the day before the Trust Fund was depleted, keeping up the Social Security payments in their promised amounts by covering this through the regular federal budget would have no impact on the deficit nor on federal borrowing needs.
Many may not realize this, and I have not seen a discussion of this point in the media or in other accounts of what might happen when the Social Security Trust Fund is depleted. To be honest, I had not really thought this through before myself, and had operated on the (incorrect) assumption that maintaining Social Security benefit payments at their scheduled levels once the Trust Funds had been depleted would add to the federal deficit and borrowing requirements. But it would not. That is important, but I have not seen any discussion of it nor its policy implications.
This post will examine how the Social Security Trust Fund works, its history over the last half-century and its prospects, and briefly on why it is now expected to be depleted by about 2035. The mechanics of the Social Security Trust Fund operations will then be examined in the context of the federal fiscal accounts, showing why it is an accounting mechanism but one that does not itself affect the federal fiscal deficit nor the federal government’s borrowing needs in the markets. It will be seen that maintaining Social Security benefit payments as currently scheduled and promised in 2035 and after would not add to the deficit nor to government borrowing needs. Some of the policy implications will then be considered.
But before starting, some of the terms should be clarified. My references to the “Social Security Trust Fund” (or simply “Trust Fund”) are to the combined Old Age Security (OAS) and Disability Insurance (DI) trust funds. Formally these are two separate trust funds, but they are commonly combined and referred to as the OASDI Trust Fund. Payments from Social Security taxes have on more than one occasion (most recently in 2016 to 2018) been shifted between the OAS and DI accounts as a short-term fix when one of the funds was getting close to depletion (the DI fund in the 2016 to 2018 case). In reports, the OAS and DI funds are often aggregated as if there were one OASDI fund, and I will treat them that way here as well.
Also, the more formal name for the taxes that go into the Social Security accounts is FICA (for Federal Insurance Contributions Act) taxes. FICA taxes are applied on wages (i.e. not on other earnings) at current rates for the worker and the employer together of 10.6% for the OAS and 1.8% for the DI accounts – a total of 12.4%. While these are formally “paid” half by the worker and half by the employer, all analysts agree that these payments in fact all come out of the worker’s wages. The tax applies up to a ceiling on wage earnings of $168,600 in 2024, after which the tax rate is zero. In addition, there are also FICA taxes of 2.9% for Medicare Hospital Insurance (with no ceiling on wage earnings). The Medicare funding will not be addressed here, and when I refer to “Social Security taxes” I will be referring to the 12.4% for the OAS and DI trust funds (OASDI together).
B. How the Social Security Trust Fund Works
Each year, there are workers who are paying Social Security taxes on their wages (at the 12.4% rate) and retirees (and other Social Security recipients, such as spouses, dependents, and the disabled) who are receiving benefit payments from Social Security. The taxes paid go into the Social Security Trust Fund and the benefit payments made are drawn out of it. When the tax payments going in are greater than the current benefit payments going out, the excess accumulates in the Trust Fund. And in those years when the tax payments in are less than the current benefit payments out, the Trust Fund redeems a share of its assets to cover the difference.
The Trust Fund is invested in specially issued US Treasury obligations – essentially special US Treasury bonds. The Trust Fund earns interest on those US Treasury holdings at a rate set by law to equal the weighted average yield observed in the markets as of the last business day of the prior month on US Treasury bonds that are not due or callable for 4 years or more. That interest is added to the Trust Fund. The Trust Fund also receives income taxes paid by certain retirees on their Social Security benefits (from retirees with incomes above a certain threshold). There are also some other, generally minor, transfers to the Trust Fund.
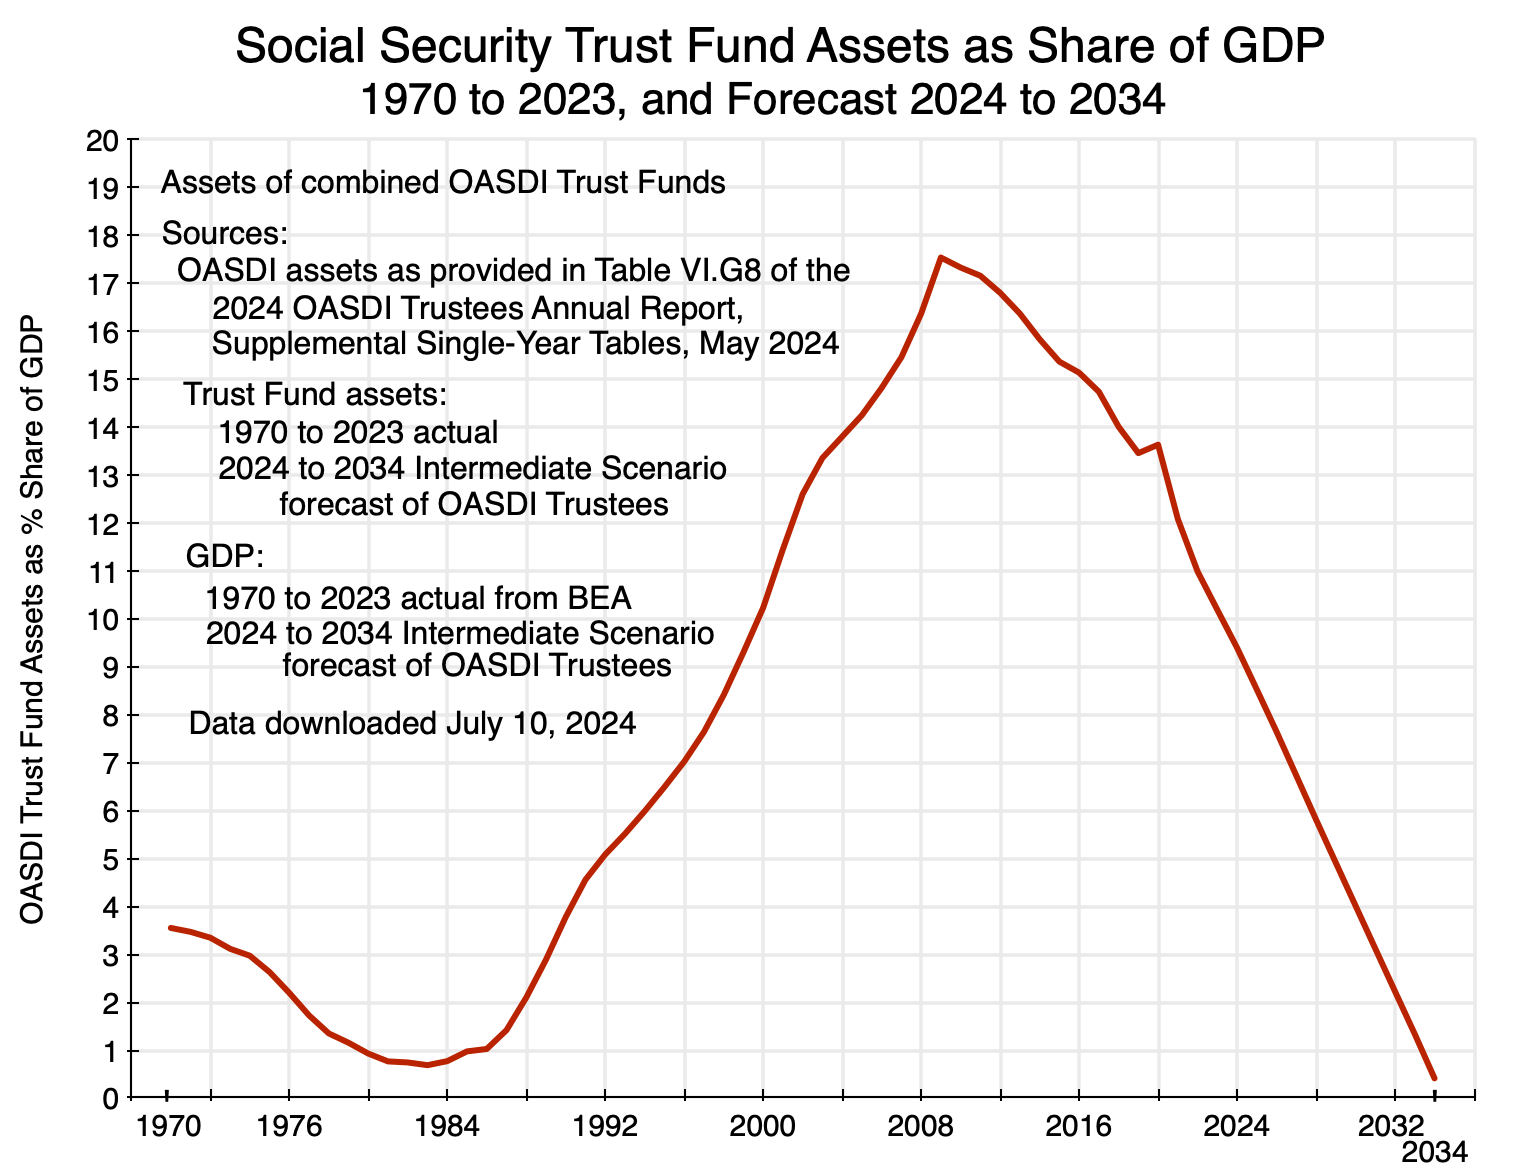
The resulting accumulated balances in the Social Security Trust Fund, as of the end of each year and expressed as a share of GDP of the year, are shown in the chart at the top of this post. It has varied over time, and one can see that the Trust Fund came close to being depleted before – in the early 1980s. Before that, the Social Security system had been managed in a more ad hoc way, with benefit levels, eligibility, tax rates, the income ceiling on which Social Security taxes were due, and more frequently adjusted by Congress. Indexing for inflation was only introduced in the 1970s.
By 1981, the forecast was that the Social Security Trust Fund would be fully depleted by 1983. In response, President Reagan with Congress appointed a commission in 1981 chaired by Alan Greenspan (and subsequently usually referred to as the Greenspan Commission) to provide recommendations for what would return the system to viability. The Commission issued its recommendations in early 1983, with a combination of higher tax rates, adjustments to benefit levels, an increase in the retirement age for full eligibility, and numerous more minor changes. Congress approved these in 1983.
The Greenspan Commission recommendations were based on forecasts of what changes would be needed to lead to the Trust Fund remaining solvent (i.e. not depleted at any point) for at least 75 years. Starting in 1982, the 75 years would carry the forecasts through to 2057. This did not mean that the Trust Fund would be brought to zero in the 75th year, but rather that it would still be solvent at that point. They did not try to look beyond that.
Knowing that the large Baby Boom generation was then in its prime working-age years and that they would be retiring starting around 2010, the changes were designed so that the Trust Fund would be built up in the 1980s, 90s, and 2000s, and then begin to be used to pay out benefits on a net basis as the Baby Boomers retired. This produced the large “hump” seen in the chart at the top of this post with the Trust Fund growing from less than 1% of GDP to 17 1/2% of GDP in 2009, after which it began to decline.
The decline as a share of GDP was planned. However, under the forecasts of the Greenspan Commission in 1983, the Trust Fund would not have been fully depleted by 2035. While it is often stated in the media that this is a consequence of the Baby Boomers reaching retirement age and of longer life expectancies, that is not in fact true. The Greenspan Commission was well aware of how many Baby Boomers would be reaching retirement age in those years – they had already been born. And the issue is not whether life expectancies have been rising, but whether life expectancies have been rising by more than what the Greenspan Commission assumed in their forecasts. And it has not. Indeed, life expectancy in the US has actually been decreasing since 2014 (and then plummeted in 2020/21/22 due to Covid), is well below that enjoyed in comparable countries, and is well below what the Greenspan Commission forecast.
As was discussed in an earlier post on this blog, the Social Security Trust Fund is now expected to be depleted well before the Greenspan Commission anticipated not because of the Baby Boomers nor because of life expectancies growing longer, but rather because the Greenspan Commission did not anticipate that wage inequality would grow so dramatically following Reagan. This matters, because it led a higher share of wage earnings to be drawn above the ceiling on which Social Security taxes are paid, where they are not taxed at all. The Greenspan Commission’s assumption that the share of wages that would be subject to tax would remain where it was (at about 90% of total wages) was not unreasonable at the time, as that share had remained fairly steady in the post-World War II period up to the early 1980s. But then it deteriorated sharply in the subsequent decades.
Due to that increase in wage income inequality, the Trust Fund is now forecast to be depleted in 2035. In my earlier post on this issue, I calculated that had the share of wages subject to Social Security taxes remained at the 90% share (and taking into account what this would also mean for higher benefit payments for the high-income wage earners who would then still be paying into the system), the Trust Fund would have been forecast to last until 2056. The calculations assumed that all else would then be as it was historically when my forecasts were made in 2016, or as the Social Security then forecast in the years from 2016 onwards.
But wage inequality rose in the decades since 1983 and the Social Security Trust Fund is now expected to run out by 2035. Under the current law that governs the Social Security system, Social Security benefits would then be scaled back to a level that would match amounts being paid into the Trust Fund by the workers in those years. This would require a scaling back of benefits of about 16% based on current forecasts. This would be devastating for many. In a biennial report issued by the Social Security Administration (last issued in 2016 with data for 2014 – it appears the Trump administration stopped it, and it has not been restarted), it was estimated that Social Security benefits accounted for 100% of the income of 20% of the population aged 65 or older, and for 90% or more of the income of a third of the population. Saying that again, one-third of Americans aged 65 or older depend on Social Security for 90% or more of their income.
Furthermore, not only do a high share of those over 65 depend on their Social Security checks for almost all of their income in their old age, but the checks themselves are not that high. As of June 2024, the average monthly benefit was only $1,781, or $21,372 on an annual basis. And most of those who especially depend on their Social Security checks also receive well less than these average payments.
A high share of those aged 65 or older in the US depend critically on Social Security. A sudden cut of 16% would be devastating.
C. Federal Borrowing Before and After the Trust Fund is Depleted
As described above, when the amount being paid into the Social Security Trust Fund in Social Security taxes exceeds what is being paid out in Social Security benefits, the excess is invested in interest-earning US Treasury obligations. That excess will reduce what the US Treasury will need to borrow from the markets to cover whatever the federal deficit might be from all of its other revenues less expenditures (i.e. everything other than from Social Security revenues and expenditures). The Social Security Trust Fund will, in such years, be built up as it was from 1983 to 2009.
The opposite happens in years when Social Security tax revenues fall short of what Social Security is paying out in benefits. In those years, the Social Security system will redeem a portion of the US Treasury obligations it holds and from this receive the cash it needs to pay the scheduled benefits. When it does this, the US Treasury will then need to borrow in the markets the amount required to cover the US Treasury obligations that the Social Security system has redeemed. That is, as the Social Security Administration redeems a share of the US Treasury obligations that it holds in the Trust Fund, the Treasury will need to issue new debt to the public to obtain the cash it needs to pay to Social Security for those redemptions.
Now suppose the Trust Fund has been fully depleted, and it no longer holds any balance of US Treasury obligations. This is the forecast for what will be faced in 2035. It no longer has US Treasury obligations that it can redeem. Under the current law for the Social Security system, it would then be required to scale back benefit payments to the amount it is then receiving from Social Security taxes being paid by those then working. The current forecast is that this would require a scaling back of 16%. (Note that this is not 100%, as some people appear to believe. Social Security is not being shut down in some kind of “bankruptcy”. Rather, Social Security payments would continue – just not at the scheduled benefit levels.)
But what would happen in terms of federal government borrowing requirements if, instead of scaling back benefits by 16%, the government instead funded those payments in full from the general budget? The amount would be far from small, at a forecast 1% of GDP to cover that 16% shortage. But what would then happen to what the US Treasury would need to borrow from the public?
The answer is nothing. There would be no change at all. As explained above, when the funds come out of the Social Security Trust Fund holdings of US Treasury obligations, the Treasury will need to borrow from the public whatever is redeemed by the Trust Fund. That is where the cash comes from. When the Trust Fund no longer has any holdings of the US Treasury obligations, then the cash needed to cover the 16% Social Security payment gap from the general budget will be exactly the same. That is, the amount the US Treasury will need to borrow from the public will be the same whether it needs the cash to cover redemptions of US Treasury obligations from the Trust Fund, or to cover the 16% gap in what is needed to pay Social Security benefits in full.
The fiscal deficit will also be the same, whether the full Social Security payments are made out of redemptions from the Trust Fund or are made out of transfers from the general government budget. Social Security taxes (i.e. FICA taxes) are included as revenues going to the government, the same as personal income taxes or other sources of government revenues. Similarly, payments for Social Security benefits are treated as government expenditures – whether or not they are covered by redemptions from the Social Security Trust Fund.
To illustrate with numbers from FY2023 (and using the recent, June 2024, budget figures from the Congressional Budget Office), and expressed as a share of GDP: Outlays for the Social Security system (for retirees and their dependents, as well as for the disabled) was 5.0% of GDP. Payroll taxes for Social Security (the 12..4% on wages) was 4.4% of GDP, leaving 0.6% of GDP to be obtained by drawing down the Social Security Trust Fund. This accounted for part of the overall fiscal deficit in FY2023 of 6.3% of GDP. If the 0.6% of GDP gap had been covered by direct fiscal transfers from the general government budget instead of by redemptions from the Social Security Trust Fund, the overall fiscal deficit (6.3% of GDP) as well as government borrowing requirements (whether to fund the deficit or to cover the Trust Fund redemptions) would have been the same.
(Note: I have left out here the relatively much smaller amounts coming from the transfer of income tax revenues arising from taxation of Social Security benefits in households meeting certain income thresholds, and the interest earned on Trust Fund assets during the year. These are both covered elsewhere in the fiscal accounts.)
It is in this sense that it is accurate to describe Social Security as a “pay-as-you-go” system. While it is not always clear what is being referred to when speakers refer to Social Security as pay-as-you-go (different speakers appear to be referring to different things), it would be accurate to say that this is the case from the point of view of the government’s fiscal accounts and of its borrowing requirements in the markets. What Social Security pays out in benefits in any given year will match what Social Security obtains as revenues in that year (primarily from the Social Security share of the FICA taxes) plus what is provided to the system from the US Treasury. Whether those amounts transferred from the US Treasury are matched by a drawdown on the Treasury obligations in the Social Security Trust Fund, or come directly from the budget, the overall fiscal deficit as well as the Treasury’s borrowing requirements in the market will be the same.
D. Policy Implications and Conclusion
Recognizing this, what does it imply for what should be done in 2035 (or whenever the Social Security Trust Fund is fully depleted)? Under current law, and what is repeatedly stated in the media, is that scheduled Social Security benefit payments would have to be scaled back drastically (by about 16% in the current forecasts). If that is done, that would indeed be a disaster for many given their dependence on the Social Security checks they receive.
But as explained above, there would be no impact on the deficit, nor on government borrowing requirements, if the scheduled benefit payments were kept in full and not scaled back from the scheduled levels, but rather with the gap covered instead by appropriations from the regular budget. Congress could approve this if they wished.
Seen in this perspective, the question then becomes how best to fund the Social Security system along with all other government programs in the budget. One should not restrict consideration only to adjustments in the payroll taxes that are currently tied to the Social Security system, nor to possible reductions in benefit levels by, for example, raising the normal retirement age. Consideration should thus be given to possible other changes in the overall tax system – for example in personal income taxes and/or corporate income (profit) taxes. The payroll tax is regressive, with a flat 12.4% on wages (and only wages) and only up to a ceiling ($168,600 in 2024). Greater reliance on progressive income taxes is an attractive alternative to a regressive payroll tax.
One should therefore take a more holistic view as to what the tax system should be and not treat the issue as one for Social Security taxes in isolation. While there could very well be political advantages to defining a trust fund for Social Security into which certain taxes are paid and from which benefit payments are then made, one should recognize that fundamentally this is only presentation. Covering a portion of the Social Security benefit payments through the general budget, and hence through the overall system of income and other taxes, could well be preferred to exclusive reliance on payroll taxes.
Note also there is precedent for this. Medicare taxes are also paid on wages (at a 2.9% rate, but with no ceiling on the wages subject to tax) and go into a trust fund, plus there are direct monthly premia paid for Medicare coverage. However this funding does not suffice to cover all of what Medicare now costs. The difference is made up by direct fiscal transfers. It is certainly a major government expense, but no one argues Medicare payments should be limited to whatever is paid in Medicare taxes and premia.
As noted, sustaining payments once the Social Security Trust Fund has been fully depleted would require a change in the law that governs the Social Security system. That law has been changed numerous times in the past, and could certainly be changed on this. The real problem is that with Congressional gridlock, obtaining approval for such a change may well be difficult. Republicans have been opposed to Social Security ever since its origin in the Social Security Act of 1935 under Roosevelt. As Social Security became popular and demonstrated its success in reducing poverty among the elderly, that political criticism became less overt but has remained. And those opposed to Social Security will likely use the imminent prospect of the Trust Fund being depleted by 2035 as an opportunity to scale the system back. A reduction in expenditures of 1% of GDP would be huge.
But as examined above, maintaining Social Security benefit payments at scheduled levels once the Trust Fund is depleted would have no fiscal effects in itself. Government revenues, expenditures, and borrowing requirements would be the same the day after the Trust Fund was depleted as it was the day before.


You must be logged in to post a comment.