

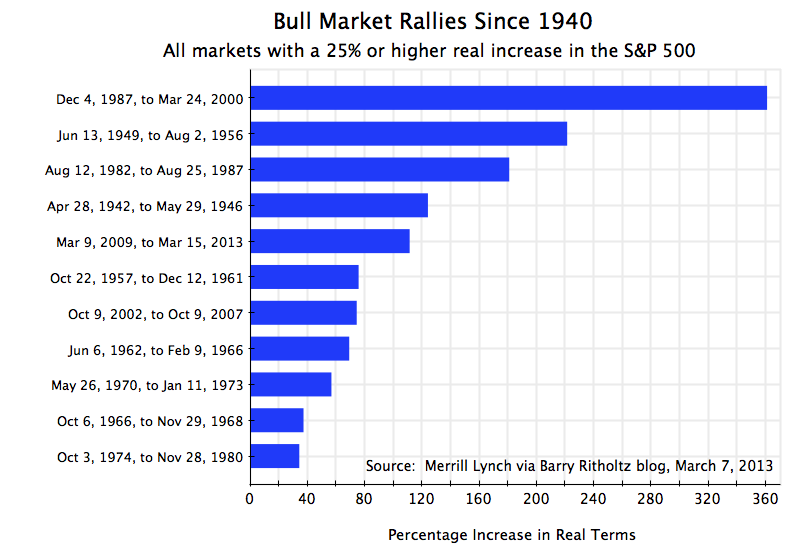
| Bull Market Rallies Since 1940 | |||||
| Ranked by overall growth in real terms | |||||
| Start Date | End Date | Calendar Days | Nominal % Change | Real % Change | Real Rate of Growth |
| Dec 4, 1987 | Mar 24, 2000 | 4,494 | 582% | 361% | 13% |
| Jun 13, 1949 | Aug 2, 1956 | 2,607 | 267% | 222% | 18% |
| Aug 12, 1982 | Aug 25, 1987 | 1,839 | 229% | 181% | 23% |
| Mar 9, 2009 | Mar 10, 2014 | 1,827 | 177% | 151% | 20% |
| Apr 28, 1942 | May 29, 1946 | 1,492 | 158% | 124% | 22% |
| Oct 22, 1957 | Dec 12, 1961 | 1,512 | 86% | 76% | 15% |
| Oct 9, 2002 | Oct 9, 2007 | 1,826 | 101% | 75% | 12% |
| Jun 26, 1962 | Feb 9, 1966 | 1,324 | 80% | 69% | 16% |
| May 26, 1970 | Jan 11, 1973 | 961 | 74% | 57% | 19% |
| Oct 6, 1966 | Nov 29, 1968 | 785 | 48% | 37% | 16% |
| Oct 3, 1974 | Nov 28, 1980 | 2,248 | 126% | 34% | 5% |
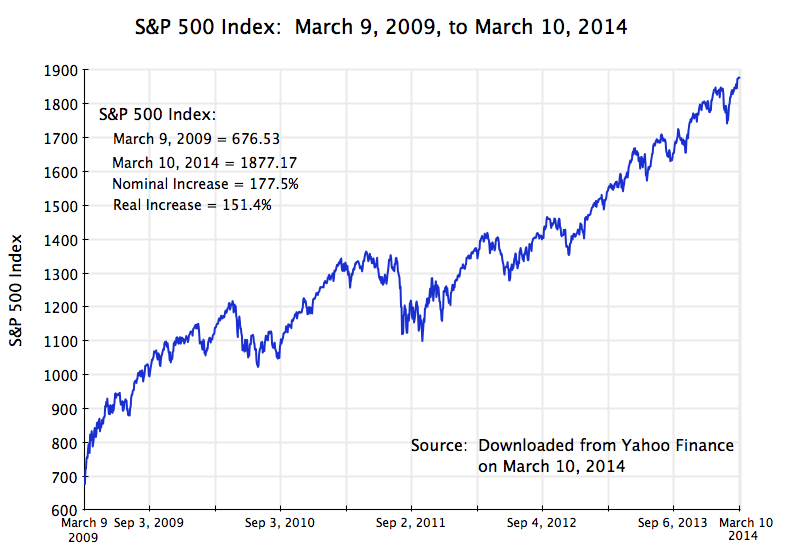
Today marks the fifth anniversary of the Obama bull market rally. The rally began on March 9, 2009, just six weeks after Obama was inaugurated. A reader of this blog suggested that on this anniversary, an update of previous posts on the strong performance of the stock market during Obama’s tenure (see here and here) might therefore be timely and of interest.
Stock market prices have indeed continued to rise, and as the table above shows, stocks during Obama’s term in office have now posted the fourth highest gains of any stock market rally since 1940. Market rallies are defined as at least a 25% rise in the S&P 500 Index (in real terms), without a 20% fall. Equity prices (as measured by the S&P 500) have risen by 177% in nominal terms since March 9, 2009, as of the close today. The increase in real terms (using the CPI inflation index) has been 151%. And since this rally is on-going, it could move further up in rank. In addition, in just twelve more days (assuming the rally does not suddenly collapse) this rally will be the third longest in terms of calendar days of all market rallies since 1940.
It is also interesting to see how steady the upward progression has been, especially since September 2011. This is shown in the graph at the top of this post. I do not believe anyone had predicted this.
The rally could also end tomorrow. All rallies eventually come to an end, and this one will as well. But the rise in prices already achieved, the fourth largest since 1940, needs to be recognized.
Should Obama be given credit for this historic market rally? Not fully. I doubt that equity prices in themselves are a primary objective of what Obama has been trying to achieve. Rather, the objective has been a stronger economy. Regulatory as well as policy measures have been taken with the aim of strengthening the system, and this ultimately benefits business (as well as the population) as a whole. This then helps equity prices. Unfortunately, and as this blog has discussed in earlier posts, fiscal drag from cuts in government spending has held back the pace of the recovery, and this fiscal drag is continuing. The economy could be doing better. Nevertheless, there has been a partial recovery. But it is not yet complete, nor as rapid as one would have had without the fiscal drag.
But what this strong growth in the stock market does clearly indicate is that the charges by Republican politicians that Obama has been bad for business (indeed a disaster for business many of them have said), has no basis. If there were any truth to the charge, stock market prices would not be up by 177% in nominal terms (and by 151% in real terms) over the last five years, leading to the fourth biggest rally in stock prices in three-quarters of a century.


You must be logged in to post a comment.