
Chart 1
A. Introduction
The failure of Trump’s economic policies in terms of his own stated objectives is becoming increasingly clear. This is not to say that those stated objectives always make much sense. They often do not. But they provide a metric to assess whether Trump is succeeding in terms of his own stated objectives.
The release on July 2 of the regular monthly BLS Employment Situation report provides figures that allow for an update on where some of these stand. This short post will look at several of them.
B. Trump’s Anti-Immigrant Policies Have Not Led to Improved Job Prospects for Native Born Labor
The Current Population Survey of households of the BLS (the basis for the reported unemployment rate and related measures) provides a breakdown of labor market participation, employment, and unemployment between immigrants (which the BLS refers to as the foreign born population) and those born in the US – the native born. While the BLS does not provide seasonally adjusted figures for this breakdown, the nonseasonally adjusted figures can still provide a meaningful comparison, especially when taken over several years.
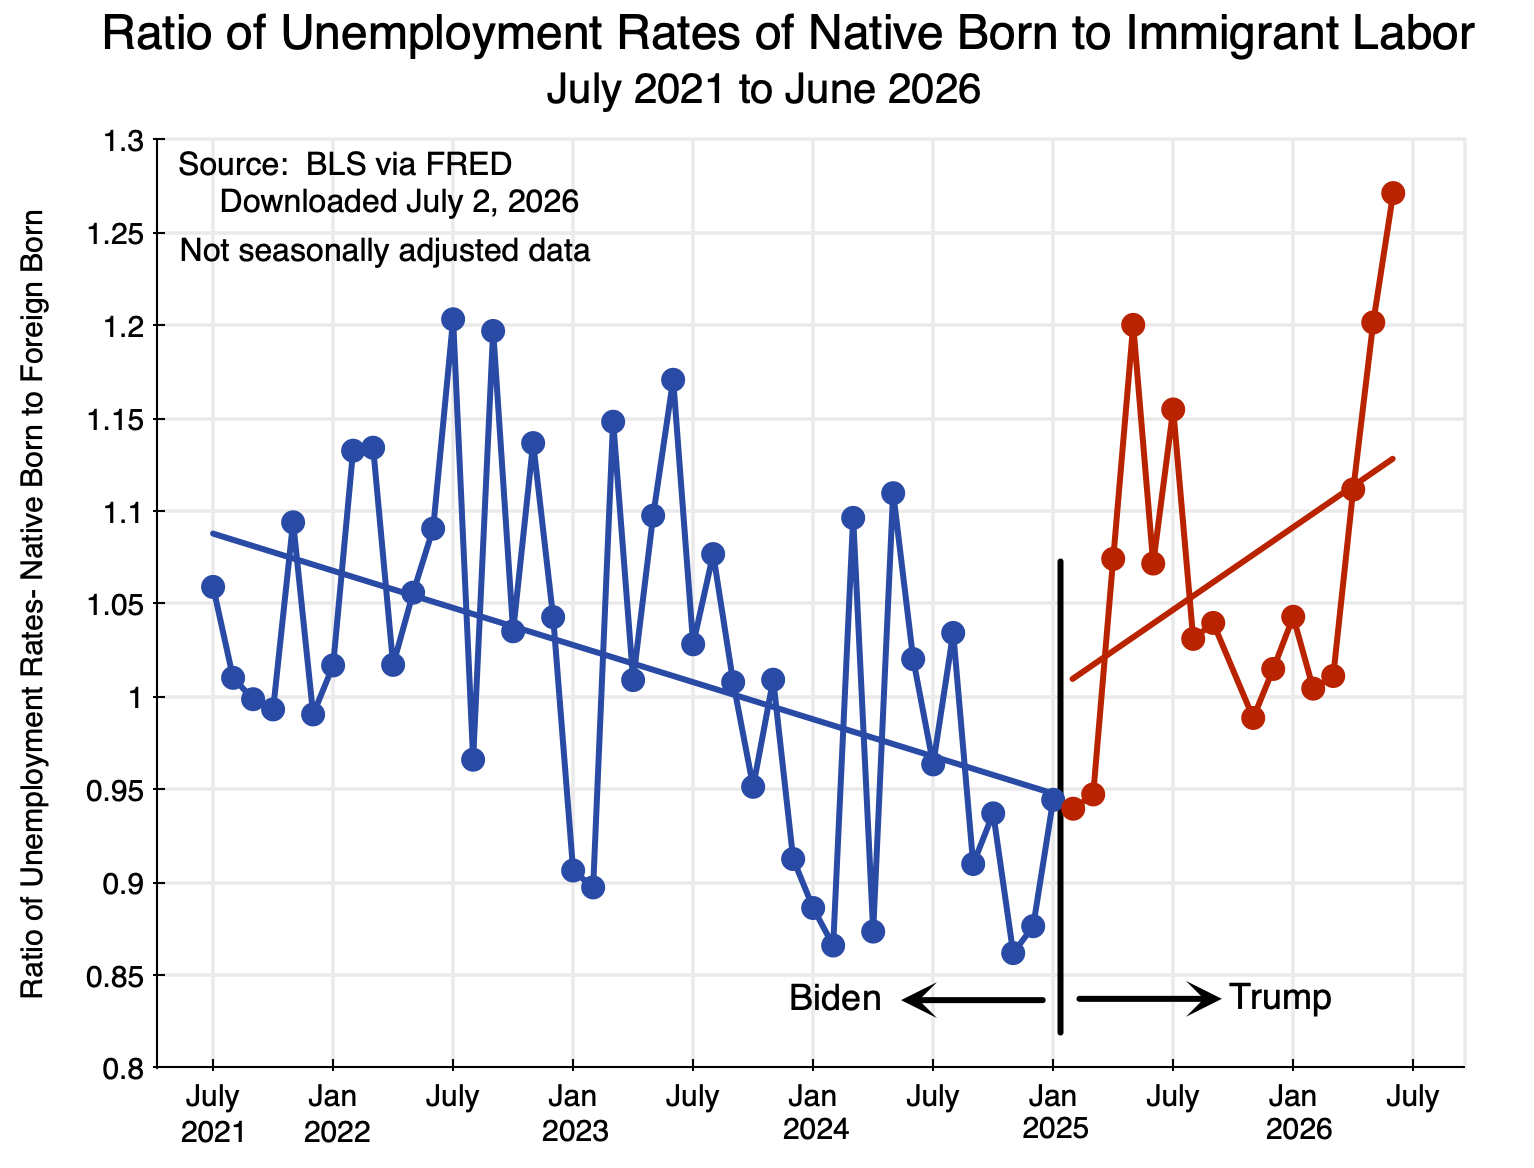
The chart at the top of this post shows the ratio of the unemployment rates of the native born population to that of immigrants, from July 2021 to June 2026. An argument Trump has made against immigrants is that they have been “taking American jobs”. If so, then the deportation of hundreds of thousands of them would lead – by this argument – to improved job prospects for the native born. The unemployment rate of the native born should fall.
Under Trump it has not, while it did during the Biden presidency. The ratio of the unemployment rate of the native born population to that of immigrants was on a downward trend during the Biden administration. This is the opposite of what would have happened if Trump’s argument were correct. Job prospects of the native born population (relative to immigrants) were improving during the Biden term.
It then reversed under Trump, despite of (or more likely because of) his anti-immigrant policies. Immigrants have been deported in massive numbers, but this did not lead to a fall in the unemployment rate of the native born relative to that of immigrants. Instead, it rose.
This is a relative measure – a comparison of the unemployment rate of one group (the native born) to that of another (immigrants). While this is the type of measure that Trump’s view of the world would engender – of one group in opposition to another in a zero-sum world where there are only a fixed number of jobs – reality can be different. What is good for one group is not necessarily – and indeed not normally – bad for another.
It is more appropriate to focus simply on what happened to the job prospects of the native born themselves. Is there any evidence that the deportation of hundreds of thousands of immigrants since Trump took office in January 2025 led to lower unemployment among the native born?
There is not. The unemployment rate of the native born in absolute terms – while very low under Biden and still relatively low under Trump – continued on the same path it was on before:

Chart 2
The unemployment rate had gone as low as about 3 1/2% during the Biden presidency – which is extremely low. It is now about 4 1/2% under Trump – still low, but not as low as before the aggressive anti-immigrant campaign. Indeed, the trend since late 2022 looks to be basically the same – whether when Biden was in office or when Trump was – with no shift evident despite the anti-immigrant policies. More basic underlying factors have been driving the figures, and not Trump’s deportations.
Why then did the ratio of the unemployment rate of the native born to that of immigrants turn around and start to rise under Trump, as seen in the chart at the top of this post? It was because while the unemployment rate of native born labor continued on its prior upward path, the unemployment rate for immigrant laborers leveled off:
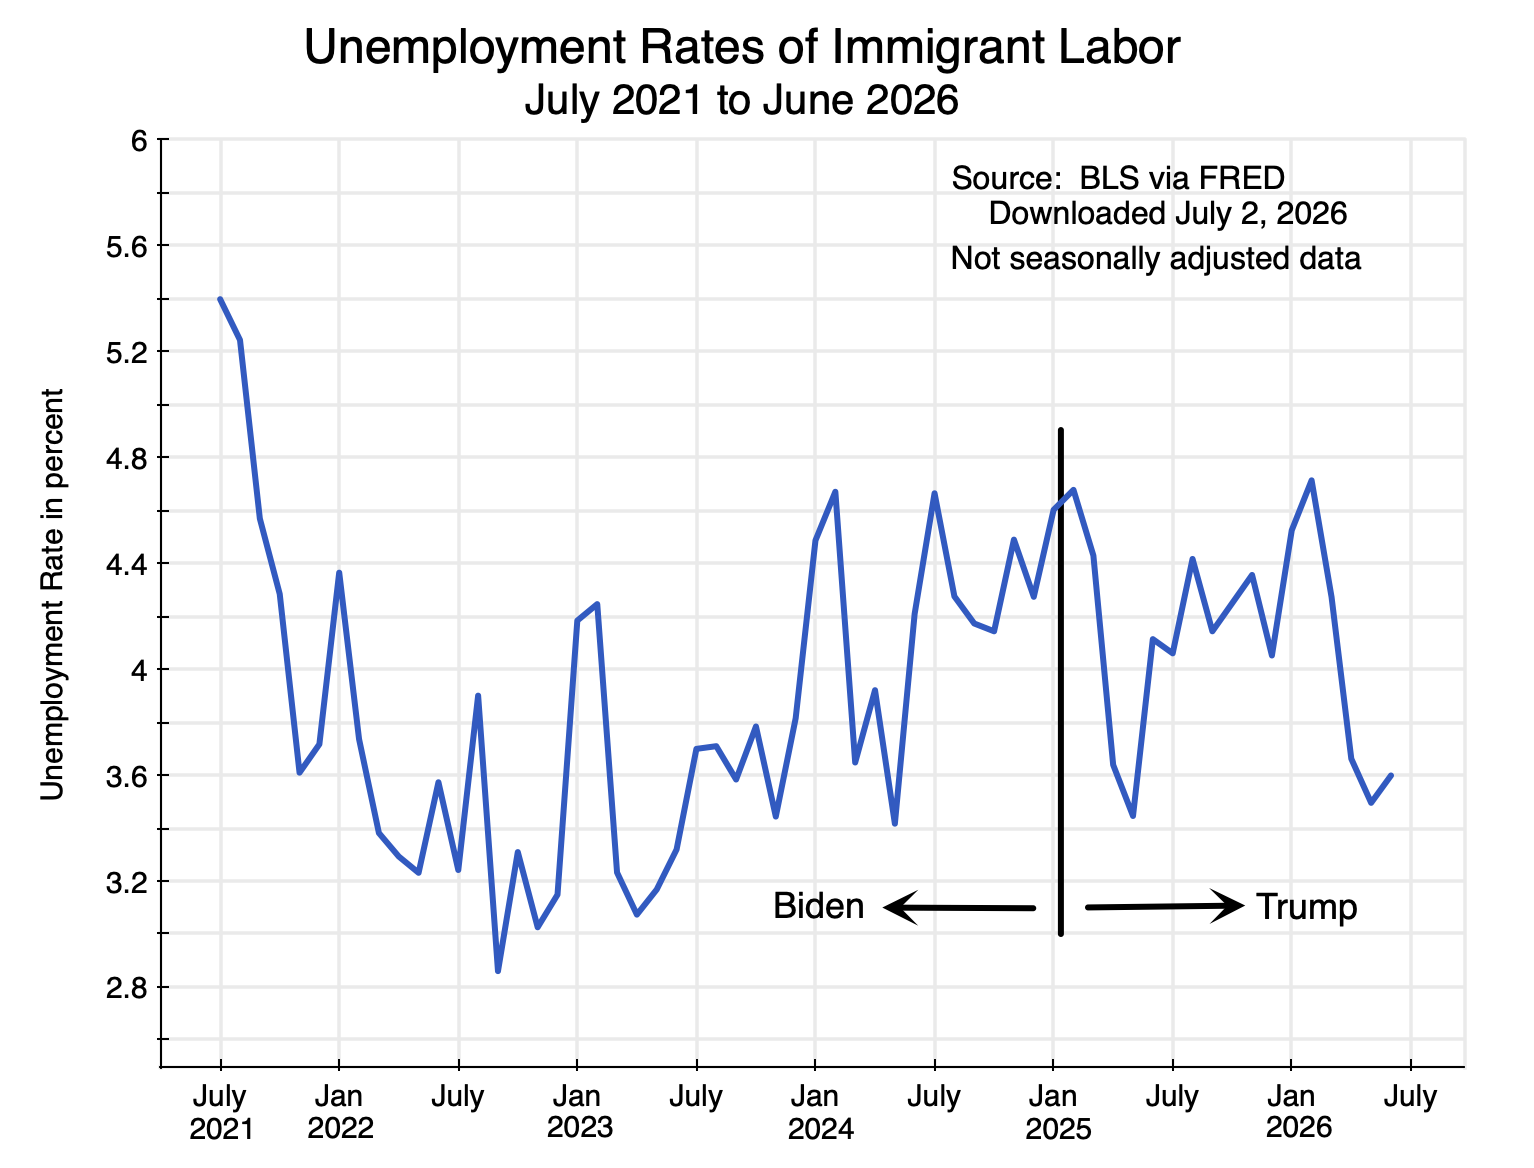
Chart 3
While there is a good deal of noise in the data (as the sample size of immigrant labor is far less than that of native born labor), and the lack of seasonal adjustment makes it more difficult to see the trends, it does appear that the unemployment rate for immigrant labor leveled off after Trump took office. It had been rising before, although again I would emphasize that all of these unemployment rates are low by historical standards.
But with the unemployment rate of immigrant labor leveling off after Trump took office, while the unemployment rate of native born labor continued to slowly rise, the ratio of the latter to the former rose. That is, Trump’s policies appear not to have led to improved job prospects for native born labor, but rather did so for the immigrant labor still in the country.
This is, in fact, not surprising: Reducing the immigrant labor force can be expected to most affect the group most similar to them, which is other immigrants. But it failed in its stated objective of improving job market conditions for the native born.
C. Employment in Manufacturing
Trump also campaigned on a promise to raise employment in manufacturing. He said he would impose impossibly high tariffs on imported manufactures to force Americans to buy from domestic factories. High tariffs have indeed been imposed, with an average rate as much as ten times higher than when Trump took office, and at a level not seen for the US since the 1940s. But they have varied widely by country (with rates for China especially high for a period) and by commodity (with a rate of 50% for steel and aluminum, 25% for cars and trucks and their parts, and 100% for pharmaceuticals, among many others). And there have been numerous exemptions and special exceptions benefiting specific firms, often announced by Trump via a post on his social media site. It has been chaotic.
The stated aim has been to force manufacturers to produce their products in the US rather than import them. This would lead – it was argued – to higher employment in manufacturing.
It has not:

Chart 4
Manufacturing employment recovered under Biden following the Covid lockdowns, and it recovered to a level higher than what it was before. It is interesting to note, however, that employment in manufacturing had already begun to fall well before the Covid lockdowns. It hit a peak of 12.79 million in July 2019 (and in fact had hit this level already in January 2019), and had fallen by 47,000 workers by February 2020 – before the Covid lockdowns. It then plummeted.
Employment recovered as the lockdowns ended, and this continued under Biden to a level above the peak it had achieved before. It then started to fall slowly over the last two years of the Biden administration. That fall then continued under Trump. As of June 2026 (and based on the most recent BLS estimates, which will be updated), there are now 75,000 fewer workers employed in manufacturing than when Trump took office.
But is this important? While employment in manufacturing has been falling, the productivity of the labor employed in manufacturing (output per employee) has been rising:

Chart 5
The data are drawn from the data I downloaded from the BEA and BLS for the prior post on this blog. It is quarterly as the BEA estimates for GDP are quarterly, and the data for 2025Q4 are still the most recent available for GDP at the sector level. Manufacturing “output” is more formally called the value-added produced in the sector, and is shown here in real terms (at the prices of 2017).
Relative to the first quarter of 2012, manufacturing output as of the fourth quarter of 2025 was 21% higher in real terms. Employment was just 6.3% higher. The difference between the two reflects greater average labor productivity in the sector. Note that this can be due not solely to higher productivity in the production of a particular good. It can also reflect changes in the mix of goods. I suspect (and this is speculation, as the data at the level of detail required is only issued on an annual basis, and that for 2024 is the latest available) the change in the mix of goods that are manufactured will account for much of this increase in average productivity in recent years. In particular, production of semiconductors and related products was strongly supported by the Biden administration. Some of the major plants that most focus on are now coming online, but there is also production of related products that receive less attention. In the BEA data through 2024, production in the “semiconductor and other electronic component manufacturing” subsector was already 26.3% higher in real terms in 2024 than it was in 2019. Manufacturing as a whole grew by 5.0% over this same period.
The higher productivity in manufacturing is a good thing. It is what enables living standards to rise over time (although while a necessary condition, it is not sufficient in itself and requires supportive policies to ensure the gains are fairly shared). Despite what politicians (of all parties) say, the aim should not be employment per se, but rather improvements in living standards.
D. Employment in Coal Mining
Employment in coal mining has also long been a priority for Trump. Coal is a terribly dirty fuel (in all phases, from digging it out of the ground, to transporting it, to burning it), and coal burning power plants are also expensive. Indeed, the marginal cost of keeping older coal-burning power plants active (to cover simply the cost of the coal that is burnt and the cost of operations and maintenance – these are high, especially for the older and hence less efficient coal burning plants) is higher than the full cost of newly-built solar and wind generation facilities at attractive sites, including the cost of storage. And this is the case before taking into account the subsidies that are available for the clean generation of power.
But for whatever reason, Trump has pushed strongly to maintain or increase employment in the mining of coal. He has failed:

Chart 6
Employment in the sector was 39,200 as of June 2026 (in the most recent estimate, which is subject to updating), versus 40,500 when Trump took office in January 2025. That is a fall of 1,300, or 3.2%. It was lower in March and April – at 38,400, a reduction of 5.2% – but has received a bit of a boost, probably because of the shortage of liquefied natural gas (LNG) resulting from Trump’s war on Iran (where LNG – natural gas – is a primary fuel for power plants).
There has been a decline, but all these figures are small. There are simply not many workers employed in coal mining. They account for only 0.025% of total employment in the US economy – i.e. 99.975% are employed elsewhere. Indeed, the 39,200 in coal mining can be compared to the 280,200 employed in the solar energy sector in the US (counting those employed in the manufacture, installation, and related work on solar power systems) as of 2024 – more than seven times as many.
E. Conclusion
Trump has made clear that he is seeking to achieve certain aims through his economic policies. They do not always make a lot of sense in themselves, but Trump has been clear that they reflect what he is trying to do. And he has regularly claimed that he has had great success.
The data indicate otherwise.


You must be logged in to post a comment.