More Trump Failures

Chart 1

A. Introduction

The failure of Trump’s economic policies in terms of his own stated objectives is becoming increasingly clear.  This is not to say that those stated objectives always make much sense.  They often do not.  But they provide a metric to assess whether Trump is succeeding in terms of his own stated objectives.

The release on July 2 of the regular monthly BLS Employment Situation report provides figures that allow for an update on where some of these stand.  This short post will look at several of them.

B.  Trump’s Anti-Immigrant Policies Have Not Led to Improved Job Prospects for Native Born Labor

The Current Population Survey of households of the BLS (the basis for the reported unemployment rate and related measures) provides a breakdown of labor market participation, employment, and unemployment between immigrants (which the BLS refers to as the foreign born population) and those born in the US – the native born.  While the BLS does not provide seasonally adjusted figures for this breakdown, the nonseasonally adjusted figures can still provide a meaningful comparison, especially when taken over several years.

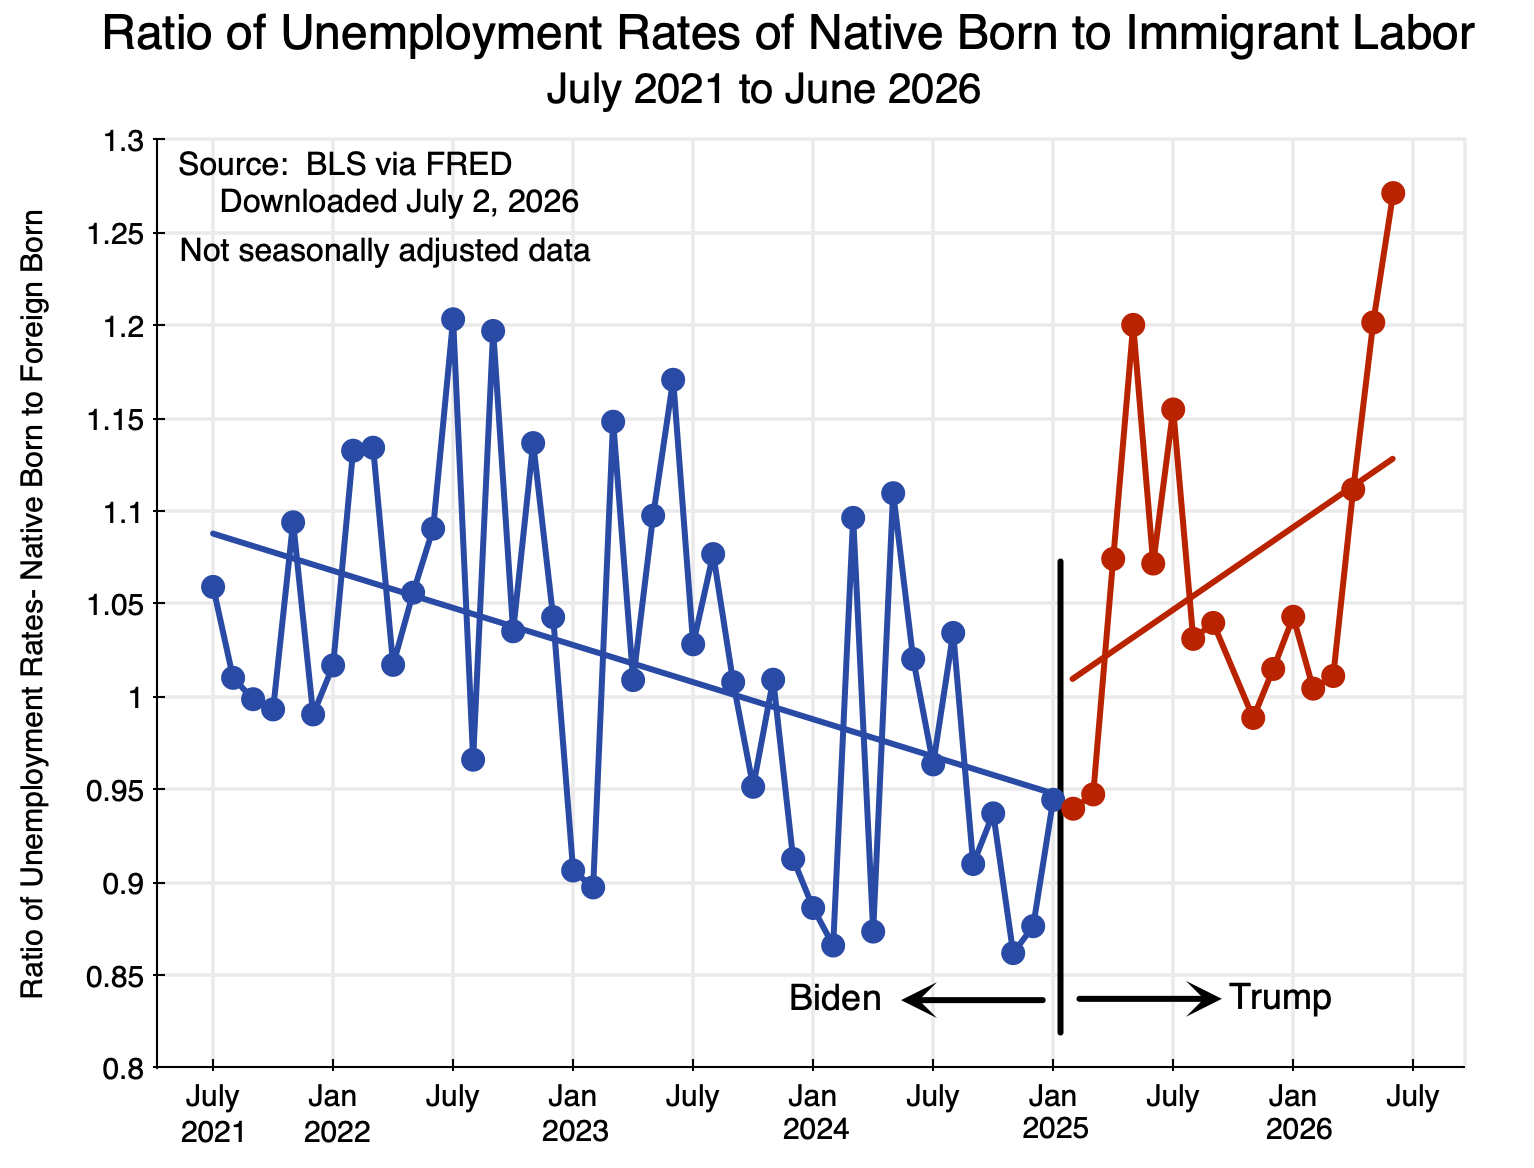
The chart at the top of this post shows the ratio of the unemployment rates of the native born population to that of immigrants, from July 2021 to June 2026.  An argument Trump has made against immigrants is that they have been “taking American jobs”.  If so, then the deportation of hundreds of thousands of them would lead – by this argument – to improved job prospects for the native born.  The unemployment rate of the native born should fall.

Under Trump it has not, while it did during the Biden presidency.  The ratio of the unemployment rate of the native born population to that of immigrants was on a downward trend during the Biden administration.  This is the opposite of what would have happened if Trump’s argument were correct.  Job prospects of the native born population (relative to immigrants) were improving during the Biden term.

It then reversed under Trump, despite of (or more likely because of) his anti-immigrant policies.  Immigrants have been deported in massive numbers, but this did not lead to a fall in the unemployment rate of the native born relative to that of immigrants.  Instead, it rose.

This is a relative measure – a comparison of the unemployment rate of one group (the native born) to that of another (immigrants).  While this is the type of measure that Trump’s view of the world would engender – of one group in opposition to another in a zero-sum world where there are only a fixed number of jobs – reality can be different.  What is good for one group is not necessarily – and indeed not normally – bad for another.

It is more appropriate to focus simply on what happened to the job prospects of the native born themselves.  Is there any evidence that the deportation of hundreds of thousands of immigrants since Trump took office in January 2025 led to lower unemployment among the native born?

There is not.  The unemployment rate of the native born in absolute terms – while very low under Biden and still relatively low under Trump – continued on the same path it was on before:

Chart 2

The unemployment rate had gone as low as about 3 1/2% during the Biden presidency – which is extremely low.  It is now about 4 1/2% under Trump – still low, but not as low as before the aggressive anti-immigrant campaign.  Indeed, the trend since late 2022 looks to be basically the same – whether when Biden was in office or when Trump was – with no shift evident despite the anti-immigrant policies.  More basic underlying factors have been driving the figures, and not Trump’s deportations.

Why then did the ratio of the unemployment rate of the native born to that of immigrants turn around and start to rise under Trump, as seen in the chart at the top of this post?  It was because while the unemployment rate of native born labor continued on its prior upward path, the unemployment rate for immigrant laborers leveled off:
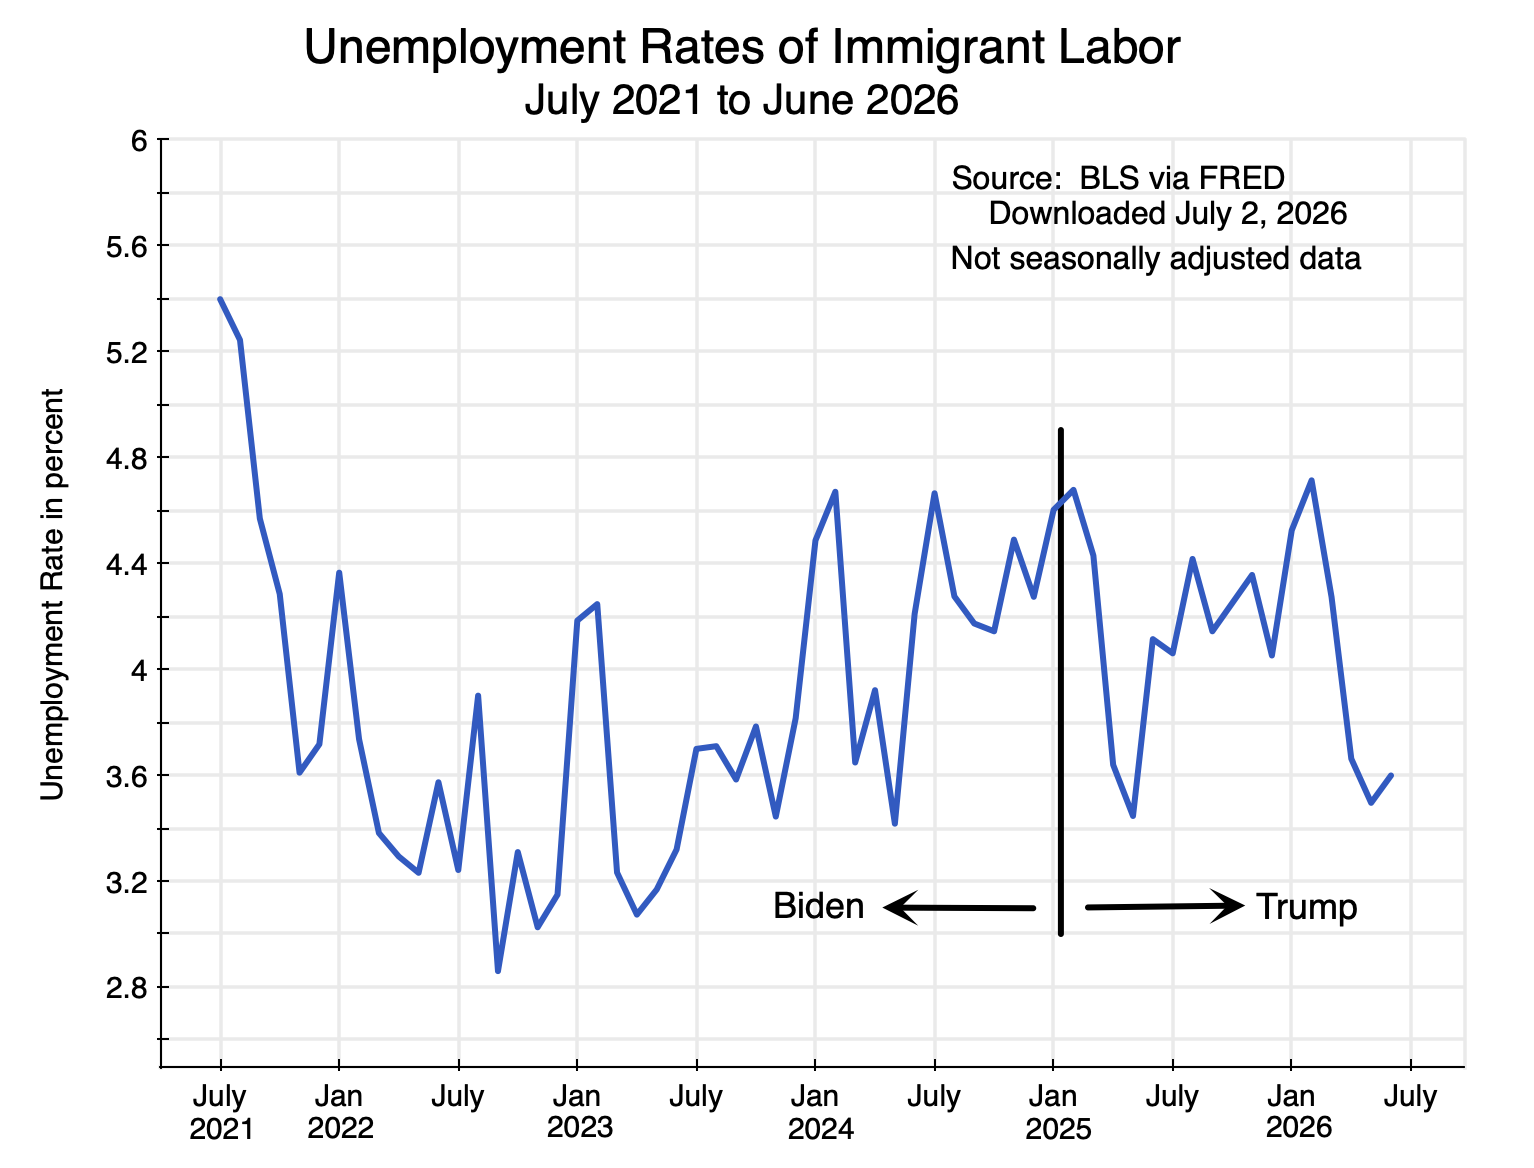
Chart 3

While there is a good deal of noise in the data (as the sample size of immigrant labor is far less than that of native born labor), and the lack of seasonal adjustment makes it more difficult to see the trends, it does appear that the unemployment rate for immigrant labor leveled off after Trump took office.  It had been rising before, although again I would emphasize that all of these unemployment rates are low by historical standards.

But with the unemployment rate of immigrant labor leveling off after Trump took office, while the unemployment rate of native born labor continued to slowly rise, the ratio of the latter to the former rose.  That is, Trump’s policies appear not to have led to improved job prospects for native born labor, but rather did so for the immigrant labor still in the country.

This is, in fact, not surprising:  Reducing the immigrant labor force can be expected to most affect the group most similar to them, which is other immigrants.  But it failed in its stated objective of improving job market conditions for the native born.

C.  Employment in Manufacturing

Trump also campaigned on a promise to raise employment in manufacturing.  He said he would impose impossibly high tariffs on imported manufactures to force Americans to buy from domestic factories.  High tariffs have indeed been imposed, with an average rate as much as ten times higher than when Trump took office, and at a level not seen for the US since the 1940s.   But they have varied widely by country (with rates for China especially high for a period) and by commodity (with a rate of 50% for steel and aluminum, 25% for cars and trucks and their parts, and 100% for pharmaceuticals, among many others).  And there have been numerous exemptions and special exceptions benefiting specific firms, often announced by Trump via a post on his social media site.  It has been chaotic.

The stated aim has been to force manufacturers to produce their products in the US rather than import them.  This would lead – it was argued – to higher employment in manufacturing.

It has not:

Chart 4

Manufacturing employment recovered under Biden following the Covid lockdowns, and it recovered to a level higher than what it was before.  It is interesting to note, however, that employment in manufacturing had already begun to fall well before the Covid lockdowns.  It hit a peak of 12.79 million in July 2019 (and in fact had hit this level already in January 2019), and had fallen by 47,000 workers by February 2020 – before the Covid lockdowns.  It then plummeted.

Employment recovered as the lockdowns ended, and this continued under Biden to a level above the peak it had achieved before.  It then started to fall slowly over the last two years of the Biden administration.  That fall then continued under Trump.  As of June 2026 (and based on the most recent BLS estimates, which will be updated), there are now 75,000 fewer workers employed in manufacturing than when Trump took office.

But is this important?  While employment in manufacturing has been falling, the productivity of the labor employed in manufacturing (output per employee) has been rising:

Chart 5

The data are drawn from the data I downloaded from the BEA and BLS for the prior post on this blog.  It is quarterly as the BEA estimates for GDP are quarterly, and the data for 2025Q4 are still the most recent available for GDP at the sector level.  Manufacturing “output” is more formally called the value-added produced in the sector, and is shown here in real terms (at the prices of 2017).

Relative to the first quarter of 2012, manufacturing output as of the fourth quarter of 2025 was 21% higher in real terms.  Employment was just 6.3% higher.  The difference between the two reflects greater average labor productivity in the sector.  Note that this can be due not solely to higher productivity in the production of a particular good.  It can also reflect changes in the mix of goods.  I suspect (and this is speculation, as the data at the level of detail required is only issued on an annual basis, and that for 2024 is the latest available) the change in the mix of goods that are manufactured will account for much of this increase in average productivity in recent years.  In particular, production of semiconductors and related products was strongly supported by the Biden administration.  Some of the major plants that most focus on are now coming online, but there is also production of related products that receive less attention.  In the BEA data through 2024, production in the “semiconductor and other electronic component manufacturing” subsector was already 26.3% higher in real terms in 2024 than it was in 2019.  Manufacturing as a whole grew by 5.0% over this same period.

The higher productivity in manufacturing is a good thing.  It is what enables living standards to rise over time (although while a necessary condition, it is not sufficient in itself and requires supportive policies to ensure the gains are fairly shared).  Despite what politicians (of all parties) say, the aim should not be employment per se, but rather improvements in living standards.

D. Employment in Coal Mining

Employment in coal mining has also long been a priority for Trump.  Coal is a terribly dirty fuel (in all phases, from digging it out of the ground, to transporting it, to burning it), and coal burning power plants are also expensive.  Indeed, the marginal cost of keeping older coal-burning power plants active (to cover simply the cost of the coal that is burnt and the cost of operations and maintenance – these are high, especially for the older and hence less efficient coal burning plants) is higher than the full cost of newly-built solar and wind generation facilities at attractive sites, including the cost of storage.  And this is the case before taking into account the subsidies that are available for the clean generation of power.

But for whatever reason, Trump has pushed strongly to maintain or increase employment in the mining of coal.  He has failed:

Chart 6

Employment in the sector was 39,200 as of June 2026 (in the most recent estimate, which is subject to updating), versus 40,500 when Trump took office in January 2025.  That is a fall of 1,300, or 3.2%.  It was lower in March and April – at 38,400, a reduction of 5.2% – but has received a bit of a boost, probably because of the shortage of liquefied natural gas (LNG) resulting from Trump’s war on Iran (where LNG – natural gas – is a primary fuel for power plants).

There has been a decline, but all these figures are small.  There are simply not many workers employed in coal mining.  They account for only 0.025% of total employment in the US economy – i.e. 99.975% are employed elsewhere.  Indeed, the 39,200 in coal mining can be compared to the 280,200 employed in the solar energy sector in the US (counting those employed in the manufacture, installation, and related work on solar power systems) as of 2024 – more than seven times as many.

E.  Conclusion

Trump has made clear that he is seeking to achieve certain aims through his economic policies.  They do not always make a lot of sense in themselves, but Trump has been clear that they reflect what he is trying to do.  And he has regularly claimed that he has had great success.

The data indicate otherwise.

The Impact on the Employment Numbers of the August 21 Announcement of the Bureau of Labor Statistics

A.  Introduction

The Bureau of Labor Statistics (BLS) issued an announcement on August 21 that said it had made a preliminary estimate that its figure for total employment as of March 2024 will be revised downwards by 818,000.  Some news media articles treated the announcement as if it were something to be alarmed by, and Trump issued a blast on the social media site he owns.  Trump asserted:  “MASSIVE SCANDAL!  The Harris-Biden Administration has been caught fraudulently manipulating Job Statistics to hide the true extent of the Economic Ruin they have inflicted upon America.  New Data from the Bureau of Labor Statistics shows that the Administration PADDED THE NUMBERS with an extra 818,000 Jobs that DO NOT EXIST, AND NEVER DID.  The real Numbers are much worse …” (sic, and capitalization as in the original).

None of this is true, but we know that accuracy has never been a strong point for Trump.  And such derogatory comments about the professionals at the Bureau of Labor Statistics just doing their jobs are also appalling.  There was nothing scandalous in their work.  A few basic points:

a)  Such a “preliminary benchmark revision” is issued every August, as part of an annual process by which the monthly employment estimates of the BLS are updated and anchored to (benchmarked to) more comprehensive estimates of employment.  This is done on a regular and routine basis every year.

b)  The date of the announcement is certainly not a secret, but rather is set well beforehand.  One will find it, for example, highlighted in a box on page 4 of the July jobs report that was released on August 2.  There was no attempt at a cover-up nor a leak.

c)  The 818,000 jobs figure is not some sort of monthly job number that people normally associate with the monthly jobs reports, but rather reflects an estimate of the change in the total number of people employed in March 2024.  The monthly employment estimates are then anchored to this benchmark, which will be updated again next year to an estimate for March 2025.  Employment still grew – and grew strongly – over the period from March 2023 (the previous benchmark) to March 2024 (which, when finalized, will become the new benchmark), but not by as much as was estimated before.  The previous estimate was of job growth of 2.9 million over this March to March period.  The new estimate (if the preliminary benchmark estimate holds – but bear in mind that it is preliminary and may well change) is of job growth of about 2.1 million.  That is still strong job growth.

d)  Many of the news articles highlighted that the 818,000 revision in estimated overall employment is high.  But one should keep in mind that it is equal only to about 0.5% of total employment.  That is, the revised figure (if the preliminary benchmark figure holds) will be 99.5% of what had been estimated earlier.  The 0.5% revision is also certainly not unprecedented.  Such revisions are part of a regular annual process, and figures the BLS provides going back to 1979 show that there have been revisions of 0.7% twice (in 1994 and 2009), 0.6% twice (1991 and 2006), and 0.5% four times (1979, 1986, 1995, and now in 2024).  That is, there have been such revisions to estimated overall employment by 0.5% or more a total of 8 times in 46 years, or 17% of the time.  A 0.5% change is large compared to what the figures normally are, but it is certainly not unprecedented, and in several years the revisions have been greater.

There is no scandal here.  There is no indication of manipulation.  And if there was some kind of politically motivated manipulation possible, doesn’t Trump realize that it would have made much more sense to manipulate the employment figures to be higher rather than lower?  Did he give even a few seconds of thought to his accusations?  The BLS is just doing the professional job it always has.

With all the publicity that has surrounded the BLS announcement, some may find of interest a description of how this annual updating process of the employment estimates works.  We will review that in the next section below.  The section following will then look at the figure itself – the 818,000 change in estimated overall employment – and what it may imply.  While still preliminary, the final estimate is likely to be close.  And the main message is that the basic story on employment growth during the Biden presidency has not changed.  Employment growth under Biden has been, and continues to be, exceptionally strong.

The chart at the top of this post updates a chart I provided in an article on this blog that was posted on August 21 – the day the BLS announcement came out.  I saw that announcement and the reports on it just after I posted that article.  One focus of that post was on the employment record under Biden and how it compared to the record under Trump.  The chart above replicates one in that August 21 post, but with the addition of what the path of estimated employment may now look like once the new benchmark is taken into account for the recent employment estimates.  That revised path is shown in orange.  It is a very rough estimate as the BLS has not yet worked out and released what the monthly employment figures will be with the new benchmark.  They are working on that now, and will release it – as they always do – in early February as part of the January monthly jobs report.

The path in orange is below the original one in red, but follows the same basic course.  It is still rising at a strong pace, and the basic message remains the same.  Job growth under Biden has been far stronger than what it was under Trump.

B.  The Annual Process of the BLS to Update Its Monthly Employment Estimates

The discussion in this section is based on material the BLS provides on its website on the process it follows in updating its monthly employment estimates to tie them (anchor them) to comprehensive employment estimates arrived at once a year from census-like figures.  The summary description provided here is based primarily on the BLS posts here and here.

The monthly jobs report of the BLS (more formally: “The Employment Situation” report) is eagerly awaited by many.  It provides estimates for what happened to the number of “jobs created” during the past month (more accurately, the change in the estimated number of nonfarm employees between the current month and the month before), as well as the unemployment rate along with numerous other measures of the labor market.

The report is produced on a very tight schedule.  The employment statistics come from a sample of establishments (both public and private, and called the Current Employment Statistics, or CES, survey), where the employing entities report to the BLS the number of employees on their payroll in the week of the month which includes the 12th day of the month.  The BLS jobs report is then issued at 8:30am on the Friday three weeks later, which is usually the first Friday of the following month.

(There are also figures in the monthly Employment Situation report on unemployment, the number in the labor force, and other figures that are obtained through the much smaller Current Population Survey (CPS) of households.  Most of what we will discuss here will be for the CES survey of business establishments, but similar modeling issues arise with the CPS survey, where there is also an annual process to update the model parameters.)

The survey of establishments is a rather comprehensive one, where the reporting entities account for about one-third of all nonfarm payroll jobs.  But it is still a sample survey, and the BLS needs to estimate from this survey the overall number of employees in the country (and hence what the change was from the previous month – the growth in the number employed).

For this, what is mainly needed is a large set of weights that the BLS can use to aggregate the reports it receives from firms of various types.  That is, to estimate the overall totals the BLS will need to know what weight to give to what is found in the survey reports for a particular type of firm (such as of a given size), operating in a particular sector, and perhaps categorized in other ways as well.

For example, small firms with up to 99 employees accounted for (in March 2023) 40.0% of all private employment in the country.  But while 70.4% of the number of private firms sampled by the BLS for the CES were in this category of up to 99 employees, those in the CES survey sample accounted for only 4.6% of total private employment.  Those firms are all small.  In contrast, large firms with employment of 1,000 or more were 6.2% of the number of private firms sampled by the BLS.  But those firms accounted for 68.4% of total private employment in the sample (and 28.8% of the total private employment in the country).

The BLS thus needs to know what weights to assign to each of these categories of firms to determine the overall totals.  The annual benchmarking exercise provides this.  A comprehensive census-type of exercise is needed, and for this the BLS uses primarily the March report of the Quarterly Census of Employment and Wages (QCEW) – which the BLS is also responsible for.  The QCEW is a comprehensive accounting of essentially all workers in the US based on the filings (and unemployment insurance tax payments) all firms are required to provide for the unemployment insurance program.

About 97% of the workers counted in the CES reports will be covered by regular unemployment insurance and hence included in the QCEW reports.  About 3% of workers are not, and the BLS uses various methods to arrive at a count for them.  Such “noncovered employment” (as the BLS labels it) includes, for example, certain workers at nonprofits and religious organizations, certain state and local government workers, railroad workers (where unemployment insurance is covered under the Railroad Retirement Board), paid interns and apprentices, and a range of others.

Keep in mind also that “employment” as reported in the monthly jobs report is for the nonfarm payroll, and thus excludes the self-employed as well as those working on farms (whether as self-employed owners or as employees).  But based on CPS data (the survey of households), those employed on farms (whether as employees or self-employed) only account for 1.4% of total employment.  That is so small that changes in on-farm employment do not have a significant impact on overall employment growth.  More potentially significant are the self-employed, who equal 6.1% of total employment according to the CPS data.  Unemployment insurance does not cover the self-employed, but those who are self-employed are also not employees and hence are not included in the CES definition of the nonfarm payroll.

The BLS then uses the detailed census counts from the March QCEW each year (supplemented by various sources of information for the remaining 3% of employees) to work out the weights to use to aggregate to the global estimates.  The March QCEW figures (as supplemented for the remaining 3%) then serve as an anchor on the employment totals.  It is updated on a routine basis annually on a calendar schedule that is set well ahead of time.  The monthly employment estimates are then worked out over the course of the year relative to the annual anchors of every March.

In addition to working out the weights to use to go from the monthly survey results to the overall totals, the BLS must also estimate the changes over time in the number of firms in each category.  That is, it needs to have an estimate for the number of new firms in each category that have begun operations each month (births), plus the number of firms that have ceased operations (deaths).  The QCEW census data will, by its nature, have nothing on the births and only outdated and now wrong information on the deaths.  The BLS updates its model of firm births and deaths each year as well, as part of its annual process of updating the benchmarks.

There has been speculation that the relatively large estimated reduction in estimated total employment of 818,000 in March 2024 may have been due in part to issues in the estimates of firm births and deaths.  There was an especially large jump in the number of new business establishments that opened in 2021 – a jump of 33% over what it was in 2020 or an increase of 37% over what it was in 2019 – to 1.4 million new firms in that year.  And the number of new firms was again at this record high of 1.4 million in 2022.  But small new firms typically struggle after a year or two, and many close even in the best of times.  It is possible that the BLS model for firm births and deaths did not capture well that this large jump in new business creation in 2021 and again in 2022 was followed by a relatively high number then closing in 2023 and 2024.

The BLS work begins once the March QCEW data become available, and each August it announces its preliminary benchmark revision for total employment in the prior March.  This is what the BLS announced on August 21, that Trump attacked.  The BLS will now work out the month-by-month implications of the new benchmark, adjusting the monthly employment figures that it had earlier estimated to reflect the new benchmark.  These revised monthly figures will be announced as part of the release of the January 2025 jobs report on Friday, February 7, 2025.  It does this in every January jobs report each year.

The benchmark figures on total employment are not seasonally adjusted numbers.  The anchors are the figures for each March, and hence the anchors in the upcoming revision will be for March 2023 (which is unchanged from what was determined before) and March 2024 (the new one).  The non-seasonally adjusted employment numbers will then be revised for the 21 months from April 2023 through to December 2024.  From April 2023 to the new March 2024 benchmark, the monthly employment figures will be adjusted in a simple linear fashion based on what the overall change in employment was between the March 2023 and March 2024 anchors.  If the final estimate turns out to be 818,000 (the same as the preliminary estimate), then that means the April 2023 non-seasonally adjusted employment estimate will be reduced by 68,167 (equal to one-twelfth of 818,000), the May 2023 estimate will be reduced by 136,333 (two-twelfths of 818,000), the June 2023 estimate by 204,500, and so on until the March 2024 employment estimate is reduced by 818,000.

The April 2024 to December 2024 figures for non-seasonally adjusted employment will then be re-estimated based on the models the BLS has updated based on the new March 2024 anchor estimates.  Keep in mind that by the time the January 2025 employment estimates are ready to be released (in early February 2025), the BLS will already have issued estimates for the April to December 2024 figures.  The revised estimates for all of the 2024 estimates are then provided in the Employment Situation report along with the employment figures for January.

The seasonally adjusted employment figures are then also updated.  Seasonally adjusted figures are calculated based on a statistical analysis of the regular annual patterns seen in the non-seasonally adjusted figures, using standard statistical programs.  The model parameters for this are re-estimated once the new non-seasonally adjusted employment figures are determined, and the BLS then goes back and revises the seasonally adjusted monthly employment estimates for a full five years.  Hence, once the January jobs report is released (on February 7 next year), one will find that the seasonally adjusted employment figures for the most recent five years (available online) will have also changed.

The January jobs report also has a section, in the interest of full transparency, showing what the new seasonally adjusted employment estimates are for each month of the past year, what the BLS had previously published, the difference, and the month-to-month employment changes (number of “new jobs”) as revised, as published before, and the difference.  All of this is routine.

The process is well-established and has been followed for at least 46 years (I have not looked farther back).  While the methods constantly evolve and are improved over time, there is no basis for Trump’s attack on the integrity of the BLS.

C.  How Much of an Impact?

The BLS was clear in its announcement that the new benchmark estimate for total employment in March 2024 is preliminary.  It is making this initial estimate available to the public in the interest of transparency, even though it has yet to work out the implications for the month-to-month employment figures.

But while preliminary with month-to-month specifics yet to be estimated, it is possible to get a sense of how significant a change this will likely entail to the pattern of employment growth under Biden.  And the answer is not much.  Furthermore, the change is in the direction one should have expected.  As discussed in my recent post on the economic record of Trump compared to that of Biden and Obama, employment growth during Biden’s term has been extremely fast.  This growth (whether based on the prior estimates or the preliminary revised estimates) has continued at a pace over the last year that is well in excess of separate estimates of growth in the labor force.  Over time, and at a constant unemployment rate, employment can only grow as fast as the labor force does.  In the past year the labor force participation rate rose slightly (from 62.6% of the adult population to 62.7%), which led to somewhat faster growth in the labor force than would be the case with a constant participation rate.  But the longer-term trend has been for the participation rate to drift downwards, as an aging population is leading to a higher share of adults in the usual retirement years.

The current estimate for the period of March 2023 to March 2024 – prior to any benchmark change – has been that total employment grew by 2.90 million.  This is based on the seasonally adjusted figures.  Growth over this period in the non-seasonally adjusted figures was a similar 2.96 million.  The preliminary benchmark change in total employment in March 2024 is 818,000, and formally this is the change in the non-seasonally adjusted figure for employment.  But it makes little difference whether one uses this to adjust the seasonally adjusted figures on employment or the non-seasonally adjusted figures.  With either, one ends up with a new figure for total employment in March 2024 of 2.1 million within round-off.

The month-by-month changes in the total employment estimates have yet to be worked out by the BLS, as noted before, but one can make a very rough estimate of what those might be.  The aim here is simply to give a sense of what the magnitudes are so that one can see – as in the chart at the top of this post – what the path of employment under Biden might then look like in comparison to the paths under Trump and Obama.

A number of assumptions are needed.  First, while the 818,000 adjustment in the benchmark employment total is formally a non-seasonally adjusted figure, I will assume the seasonally adjusted estimate will be similar.  The chart at the top of this post uses seasonally adjusted figures throughout, and the adjusted path for employment growth under Biden will be as well.

Second, for the period from April 2023 to March 2024 I adjusted the month-by-month employment estimates linearly, as the BLS does (although the BLS does this with the non-seasonally adjusted figures for the monthly employment estimates; I am assuming the changes in the seasonally adjusted figures will be similar).  That is, the April 2023 employment total was reduced by 68,167 (one-twelfth of 818,000), the May 2023 total by 136,333 (two-twelfths), and so on to March 2024.

Third, adjusting the figures going forward from March 2024 is more difficult as the BLS will use its updated models to make the revisions to the estimates from April.  Note that while the revised BLS estimates – when they are released as part of the January Employment Situation report – will cover the months through to December, all that we need now are estimates for the months of April, May, June, and July.

While very rough, for this I assumed the revisions for these four months will follow a pattern similar to what was found in the 2019 revision.  This was relatively recent but also pre-Covid (with all of the disruptions of patterns associated with that), and in that year the benchmark employment estimate was reduced by 0.3%.  While less than the 0.5% preliminary revision in the 2024 benchmark estimate, it was a still major revision downward (and during the Trump administration, although I do not recall ever seeing a reference by Trump to that reduction in the job totals).  I then used the month-by-month revisions in the seasonally adjusted employment estimates in 2019 for April through July, rescaled the percentage changes of each by the ratio of 0.5%/0.3% (in fact using the more precise figures of 0.517%/0.341%) and then applied those adjusted percentage changes to the current estimates of total employment in those four months.

The new path for total employment for the period of March 2023 to July 2024 is then shown as the orange line in the chart at the top of this post.  While below the current employment estimates (the line in red), the difference is not large.

The basic story remains the same.  Employment growth has been exceptionally strong under Biden, and has continued.  A downward revision in the benchmark total for March 2024 of 818,000 does not change this.

Strong Employment Growth Has Continued, But Must Eventually Level Off

Cumul Private Job Growth from Inauguration to June 2016

Cumul Govt Job Growth from Inauguration to June 2016

A.  Introduction

A pair of recent news releases on the job market underscore what has been a strong record on job growth during Obama’s tenure as president.  On July 8, the Bureau of Labor Statistics released its monthly employment report, while on July 14, the Department of Labor issued its regular weekly report on initial claims for unemployment insurance.  The reports show continued strong growth in employment, an unemployment rate that remains below 5%, and initial claims for unemployment insurance that are at a record low as a ratio to total employment.

This blog post will review these developments, with comparisons to the outcomes seen under recent Republican presidents.  Obama’s policies have been criticized as harmful to labor by “killing” jobs through over-regulation or by the extension of health insurance under the Affordable Care Act (Obamacare), but this is simply not true.  Employment growth has been strong, and the unemployment rate is now at a level which is at, or close to, full employment levels.  It might be able to go a bit lower, but not by much.

And because unemployment cannot go much lower, job growth going forward will necessarily slow down.  When one is at full employment, job growth cannot be greater than growth in the labor force, and growth in the labor force is primarily determined by demographic factors.  While there can be month to month fluctuations, as the number choosing to enter or remain in the labor force can fluctuate (and there will be statistical variation as well, as these figures are all based on surveys), these fluctuations will even out over time as they are fluctuations around a relatively steady long-term trend (see this earlier blog post for a discussion).

This blog post will review these figures on employment growth during Obama’s tenure, and what might now be expected going forward.

B.  Job Growth, the Unemployment Rate, and Initial Claims for Unemployment Insurance

The charts at the top of this post show growth in the number of jobs, separately for private jobs and for government jobs, cumulatively from the month of inauguration for Obama and similarly for George W. Bush.

Private job growth has been strong and remarkably steady under Obama since the trough reached at start of 2010, one year after he took office.  During his first year in office, Obama’s stimulus program plus aggressive Fed actions succeeded in turning around an economy that was in full collapse as he took office.  There have been 14.8 million new private jobs gained since that turnaround.  The contrast with Bush is stark.  Private job growth under Bush was not only less in absolute amount, but also collapsed in his final year in office as the economy went into free fall following the bursting of the housing bubble.

Also in contrast to Bush (and every other recent president), government jobs have fallen during Obama’s tenure, with 460,000 less now than when he took office.  Total jobs have not grown because of additions to the public sector payroll:  There are fewer government jobs now than when Obama was inaugurated.

With the overall job growth, unemployment has fallen steadily, from a peak of 10.0% in October 2009 to just 4.9% now:

Unemployment Rates - Obama vs Reagan, up to June 2016Furthermore the unemployment rate has been at 5.0% or below since October 2015. With full employment traditionally viewed as an unemployment rate of around 5% (there is always some friction in the market), the unemployment rate cannot go much below where it is now.  And the unemployment rate is well below what it was when Reagan was in office, at the same point in their respective administrations.

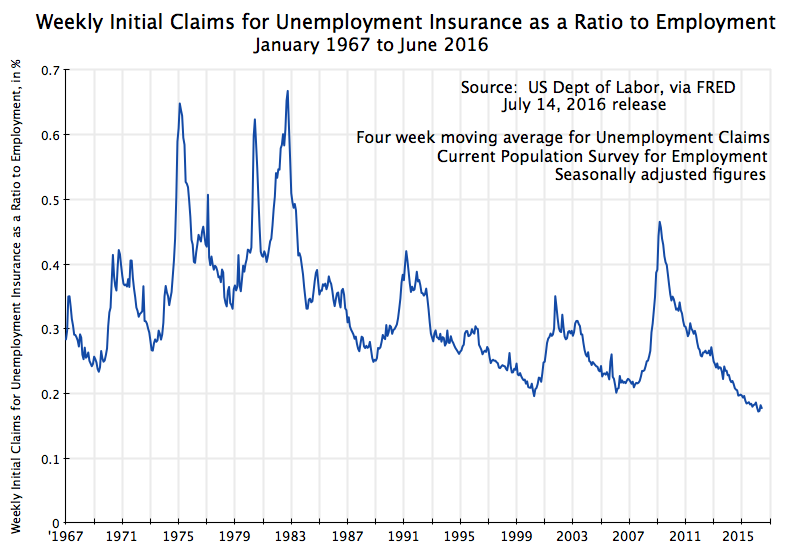
Finally, the weekly report on initial claims for unemployment insurance (issued by a different unit within the Department of Labor) shows claims are now at a record low level when measured as a ratio to number employed:

Weekly Initial Claims for Unemployment Insurance as a Ratio to Employment, January 1967 to June 2016

Initial claims for unemployment insurance as a ratio to employment has never been so low since at least 1967, when the data series first began to be collected.  Indeed, it has been at a record low since late 2014.  Workers are not being laid off.

This employment record is therefore strong.  Had Mitt Romney been elected president in 2012, one can imagine what he and his party would now be saying of such a record.  In May 2012 during the campaign, Romney said that his policies would get unemployment down to 6% by the end of his first term (i.e. by January 2017).  And this was viewed as a stretch.  But it was achieved under Obama by September 2014, less than half way through his term.  And unemployment under Obama has now been at 5.0% or less since October 2015.

C.  What to Expect Going Forward

While job growth has been strong under Obama, one must also be aware that this cannot go on forever.  A slowdown has to occur.  While jobs can be (and should be) added quickly when unemployment is high, so that the unemployed can gain jobs, once one is at or close to full employment, this has to slow down.  When this happens, it should not be a surprise.

When an economy is at full employment, the growth in the number of those employed can only rise with growth in the labor force.  And this depends primarily on demographic factors.  While there can be short term fluctuations (including fluctuations in the figures arising from the statistical estimates, as they are based on surveys of households), these will even out over time.

Since the trough reached in February 2010, total employment has increased by 14.4 million, while private employment has increased by 14.8 million (government jobs have been reduced).  The average increase per month over this period was 190,000 for total employment and close to 195,000 per month for private employment.  These are also not far different for the monthly averages of just the past 12 months, of 204,000 for total employment and 194,000 for private employment.

But this cannot continue.  The labor force is growing at a pace of only 0.5% per year, based on the growth over the decade of June 2006 (when unemployment was 4.6%) to June 2016 (when unemployment was 4.9%).  Applied to the current labor force of 158.9 million, growth of 0.5% per year comes to 66,200 additional workers per month.  The pace of job growth will have to fall at some point in the not too distant future to about one-third the pace it has averaged over the last year.

A couple of caveats should be noted.  First, the rate of unemployment compatible with full employment is not known with certainty, and may well have varied over time.  The unemployment rate might fall below 5%, and was indeed in the range of 3.8 to 4.1% during the last year of the Clinton administration.  Should it be possible to bring the “full employment” rate of unemployment down by a further 1% point over the course of, say, one year (i.e. from the current 4.9% to 3.9%), then monthly job growth over that year could average 200,000 per month.  An additional 1% of the current labor force of 159 million would obtain jobs (1% of 159 million equals 1.6 million, or 133,333 per month over 12 months, plus the trend growth of the labor force of 0.5% per year adds 66,200).  But there is still a limit, and while it might not be reached immediately, it is not far off.

Separately, the number in the population that choose to participate in the labor force has varied over time, and could conceivably go higher.  Some analysts have indeed argued that it is exceptionally low right now, and can be expected to go higher as the economy returns to full employment and “discouraged workers” start again to seek jobs.  But again, there are limits to this, and as I argued in an earlier blog post, I do not see that one should expect a sharp increase.  Indeed, the long term trend has followed a steady and predictable path in recent decades (when one separates out the male and female rates), and the male and female rates have both been going downward since the late 1990s.  On top of this, the aging of the baby boomers into their normal retirement age means one should expect even slower growth in the labor force over the next ten years than over the last ten years.

Finally, this slowdown in the pace of job growth is what one should expect under ideal conditions, of an economy that is at, and then remains at, full employment levels.  Under such conditions, the pace of job growth could average only around 66,000 per month. But the economic expansion under Obama has now been underway for seven full years.  Only three other business cycle expansions have lasted so long in US history.  Eventually, every expansion has come to an end, and when it does, jobs will decline.  The expansion under Obama has continued, but who knows what will happen once a new president takes office next January.

D.  Conclusion

The jobs record under Obama has been exceptionally strong.  There is no basis for the assertions made by political opponents that his regulatory and other policies have harmed job growth.  Faced with an economy in free fall when he took office, Obama was able to engineer a stabilization and then recovery that has brought employment back to full employment levels.

This is not to deny that there are important economic issues.  Most importantly, wages have been flat and income distribution has continued to worsen.  Furthermore, with the economy now at or close to full employment, the pace of job growth up to now will have to slow in the not too distant future.  When it does, one should not be surprised.