

Initial claims for unemployment insurance are now at their lowest level, in terms of absolute numbers, in forty years, and the lowest ever when measured relative to employment (although the series goes back only to 1967). There has been a steady improvement in the job market since soon after Barack Obama took office in January 2009, with (as discussed in a recent post on this blog) a steady increase in private sector jobs and an unemployment rate now at just 5.0%. Yet the general discussion still fails to recognize this. I will discuss some of the possible reasons for this perception later in this post.
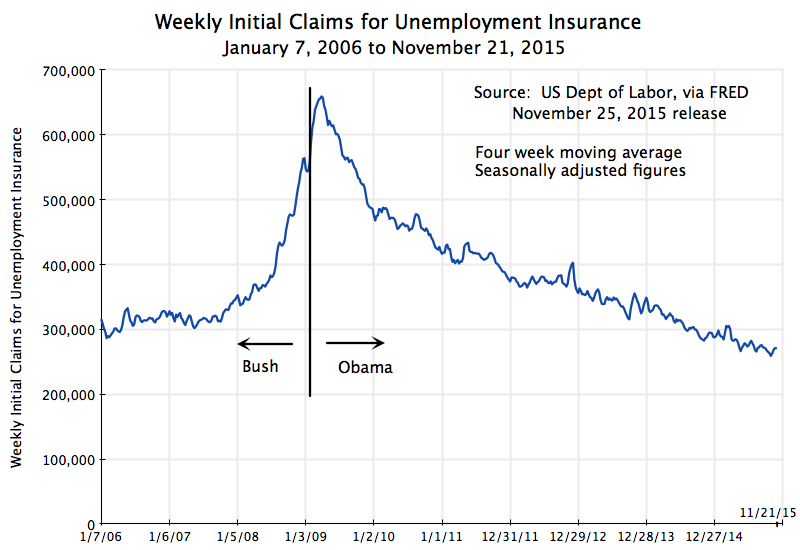
Initial claims for unemployment insurance provides a good measure of the strength of the labor market, as it shows how many workers have been involuntarily laid off from a job and who are then thus eligible for unemployment insurance. The US Department of Labor reports the figure weekly, where the numbers in the chart above are those updated through the release of November 25, 2015 (with data through November 21). While there is a good deal of noise in the weekly figures due to various special factors (and hence most of the focus is on the four week moving average), it does provide a high frequency “yardstick” of the state of the labor market. The charts above are for the four week moving averages.
The measure has been falling steadily (abstracting from the noise) since soon after President Obama took office. News reports have noted that the weekly figures have been below 300,000 for some time now (close to a year). This is a good number. Even in the best year of the Bush administration (2006, at the height of the housing bubble), weekly initial claims for unemployment insurance averaged 312,000. So far in 2015 (through November 21) it has averaged 279,000, and the lowest figure was just 259,250 for the week of October 24. Initial claims for unemployment have not been so low in absolute numbers since December 1973.
But the population and labor force have grown over time. When measured as a ratio to the number of those employed, initial claims for unemployment insurance have never been so low, although the series only begins in January 1967. It is now well below the lowest points ever reached in the George W. Bush administration, in the Reagan administration, and even in the Clinton administration, under which the economy enjoyed the longest period of economic expansion ever recorded in the US (back to at least 1854, when the recession dating of the NBER begins).
Why then has the job market been seen by many as being especially weak under Obama? It should not be because of the unemployment rate, which has fallen steadily to 5.0% and is now well below where it was at a similar point during the Reagan administration. Private job creation has also been steady and strong (although government jobs have been cut, for the first time in an economic downturn in at least a half century). There has also been no increase in the share of part time employment, despite assertions from Republican politicians that Obamacare would have led to this. And growth in GDP, while it would have been faster without the fiscal drag of government spending cuts seen 2010, has at least been steady.
What has hurt? While no one can say for sure as the issue is some sense of the general perception of the economy, the steady criticism by Republican officials and pundits has probably been a factor. The Obama administration has not been good at answering this.
But also important, and substantive, is that wages have remained stagnant. While this stagnation in wages has been underway since about 1980, increased attention is being paid to it now (which is certainly a good thing). In part due to this stagnation, the recovery that we have seen in the economy since the trough in mid-2009 has mostly been for the benefit of the very rich. Professor Emmanuel Saez of UC Berkeley has calculated, based on US tax return data, that the top 1% have captured 58% of US income growth over the period 2009 to 2014. The top 1% have seen their real incomes rise over this period by a total of 27% in real terms, while the bottom 99% have seen income growth over the period of only 4.3%. Furthermore, most of this income growth for the bottom 99% only started in 2013. For the period from 2009 through 2012, the top 1% captured 91% of the growth in national income. The bottom 99% saw their real incomes rise by only 0.8% total over that period.
The issue then is not really one of jobs or overall growth. Rather it is primarily a distribution problem. The recovery has not felt like a recovery not because jobs or growth have been poor (although they would have been better without the fiscal drag), but rather because most of the gains of the growth have accrued to the top 1%. It has not felt like a recovery for the other 99%, and for an understandable reason.

You must be logged in to post a comment.