
Chart 1
A. Introduction
This is the third in a series of posts on wealth inequality in the US. The first two examined the trends in recent decades in the distribution of wealth across households, with households ranked by their wealth (i.e. net worth – the terms will be used interchangeably) or ranked by their income. This post will use the same data set to examine how per household wealth has changed over time for those at the same age but in different post-war generations (based on the year of birth of the head of the household): the Silent Generation (those born before 1946), the Baby Boomers (born 1946 – 1964), Gen X (born 1965 – 1980), and the Millennials (born 1981 or later).
The data are from the Distributional Financial Accounts (DFA), which is prepared by staff of the Federal Reserve Board. The DFA data set was discussed in the first post in this series. The DFA estimates are derived from the triennial Survey of Consumer Finances (SCF) of the Fed combined with the quarterly estimates of the nationwide totals for the various categories of assets and liabilities from the Fed’s Financial Accounts of the United States. The triennial SCF is a survey of households, and as part of the survey they record household characteristics – including the age of the head of the household. Using this, they can provide the data broken down into various groups, including by generation.
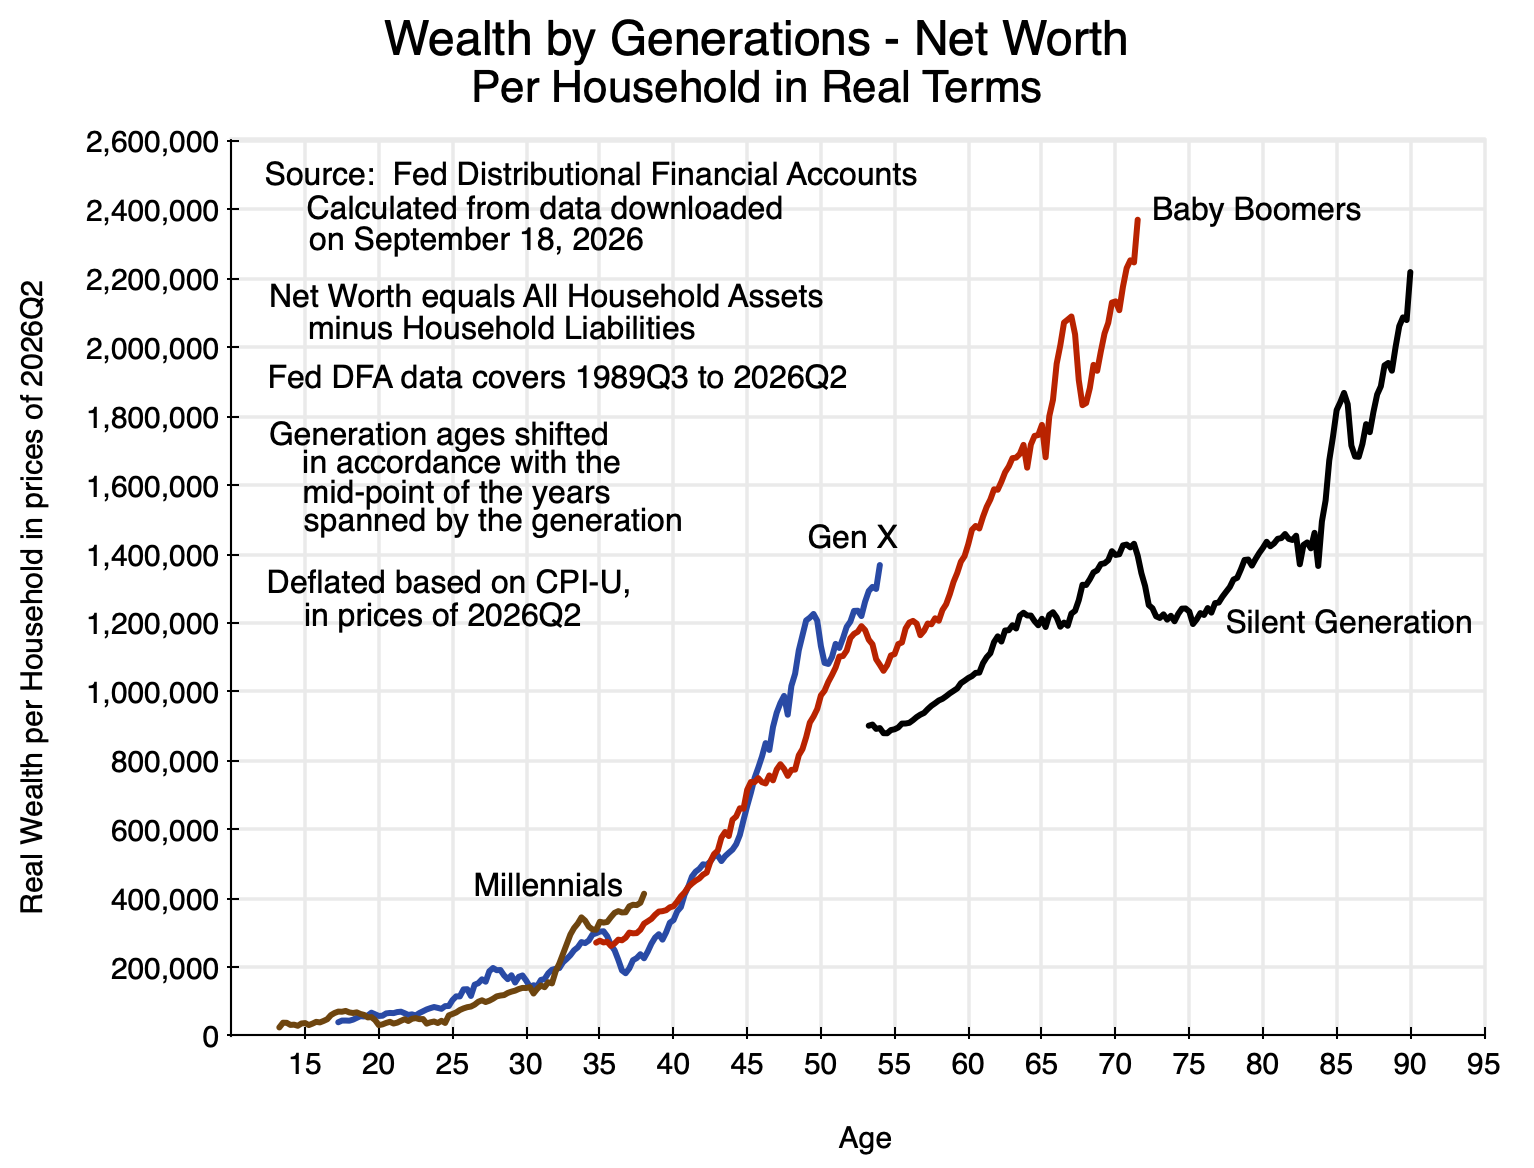
The DFA data provide estimates of the assets and liabilities – and hence net worth – of households in each of the calendar quarters starting from the third quarter of 1989. The figures by generation can be put on a per household basis, adjusted for inflation (using the CPI), and then shifted to reflect the age of each generation in the given year (based on the midpoint of the age range for that generation, e.g. 1955 for the Baby Boomers, as they were born from 1946 to 1964). Since the data start in 1989Q3, the youngest age available for the Silent Generation (those born before 1946, with a mid-point of 1936.5) is age 53 (or 53.25 to be precise). The earliest age for the Baby Boomers is 34.75. And with the data ending in 2026Q2, the oldest age for the Millennials is 38.
While not complete, the bands overlap sufficiently for the story to be clear. This post will first look at the growth in net worth of each generation as they aged and how the generations compare when at the same age. It will then look at similar charts for the value of just their net holdings of real estate and for the value of the assets in their pensions (including annuities). The final section will look at the implications of the fact that the distribution of wealth grew increasingly unequal over time. The consequence is that while the figures on net worth (or real estate or pensions) were in some cases similar on average between one generation and the next, this does not mean that a similar number of households were wealthier than their parents (when at the same age) as the number who were less wealthy. The distribution has changed. With the increase in inequality in wealth over time, similar holdings on average will lead instead to a higher number of households holding less wealth than their parents at the same age than the number who had more. The mean is not the median.
B. Net Worth by Generation
The chart at the top of this post shows the average net worth of households in each generation at any given age, with all per household and in real terms as noted above. The average real net worth of the Baby Boomers is clearly substantially higher than what it was for the Silent Generation at the same age.
For the most recent period (2026Q2), with the Baby Boomers at age 71.5 (based on the year at the midpoint of that generation), the real net worth of a Baby Boomer household was on average almost $2.4 million. For a member of the Silent Generation at age 71.5, the per household net worth (in prices of 2026Q2) was $1.4 million – more than 40% less. Furthermore, and as seen in the chart, the net worth of the Silent Generation was soon to fall to just $1.2 million. They were age 71.5 in 2008, just before the crash when the real estate financing bubble burst.
In contrast to the substantial growth in average real net worth of the Baby Boomer generation compared to the prior Silent Generation, the net worth of both the Gen X and Millennial generations follows a path broadly similar to the path of the Baby Boomers. What this implies is that greater wealth from one generation to the next came to a halt after the Baby Boomers. The more recent generations are not worse off, on average, but nor are they better off.
As will be discussed later in this post, figures based on the averages do not take into account that the distribution of wealth has become more unequal. The change in the median net worth will then be less than the change in the average, and a larger share of households were less wealthy than their parents at the same age than were wealthier.
C. Net Real Estate and Pension Wealth
A similar chart can be drawn for the net real estate assets of each generation at any given age:
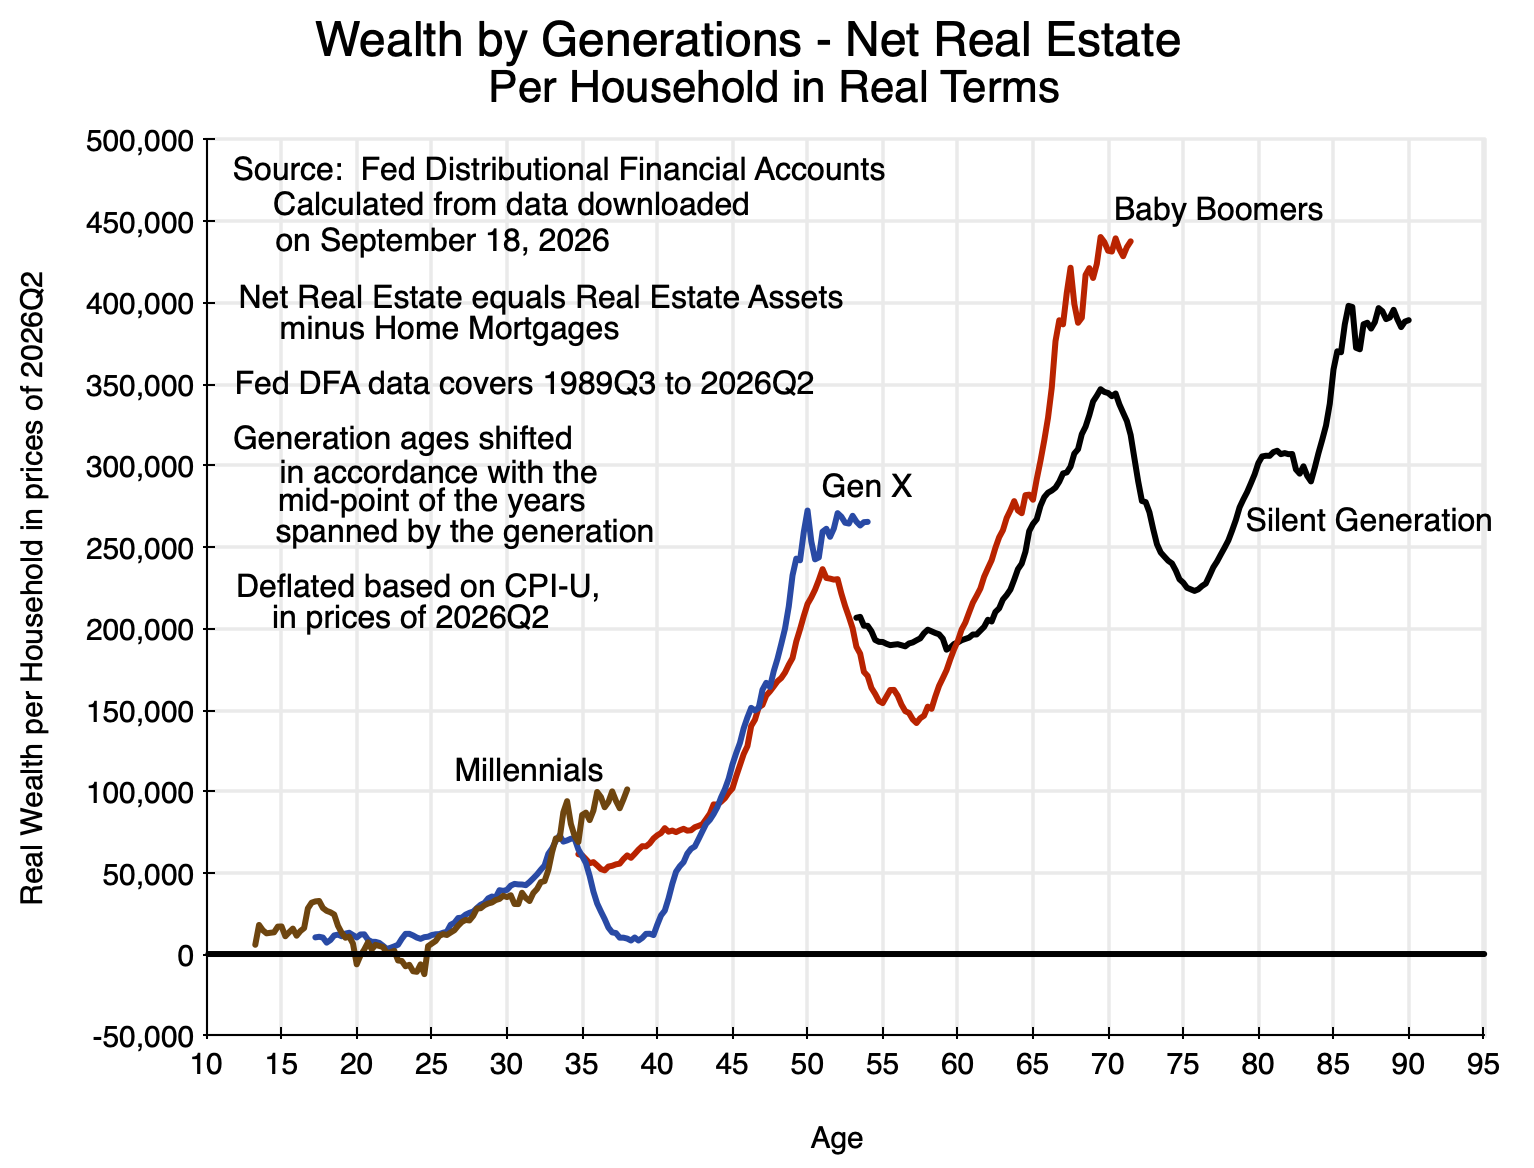
Chart 2
There is greater volatility here – driven by swings in the housing market – but a similar pattern holds. Note that the swings are amplified as net real estate values subtract mortgage obligations from the value of the real estate assets held, thus leveraging swings in housing prices.
The downturns are especially sharp from the start of the housing crash in 2008, when those in the Silent Generation were (on average) age 72, the Baby Boomers were 53, and those in Gen X were 36.
Starting at around age 65, Baby Boomers were wealthier in terms of net real estate than those in the Silent Generation. They were similar before that age. Gen X and Millennials have so far followed a path that is on average similar to that of the Baby Boomers at the same age.
And a similar chart for pension and annuity assets held by each generation:
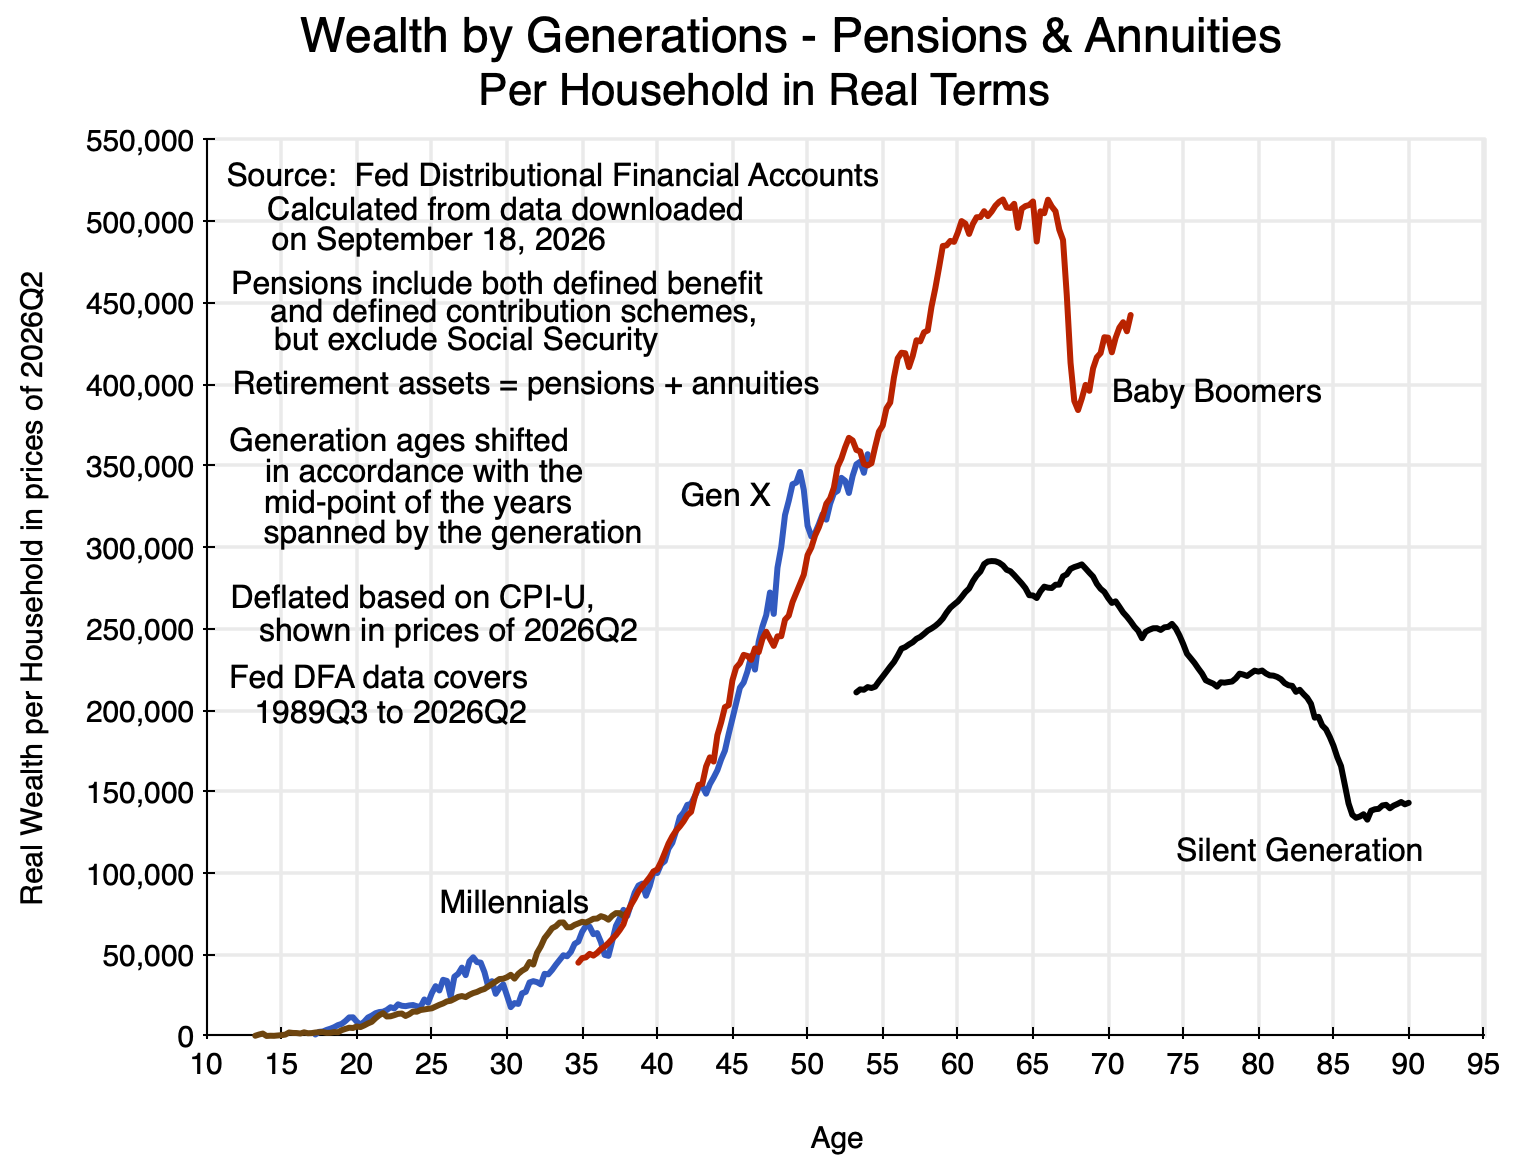
Chart 3
The net assets held in pension accounts (including annuities) by those in the Baby Boomer generation have been substantially higher than at the same age for the Silent Generation – on average more than 70% higher at ages when data are available on each. Not surprisingly, the holdings fell (by roughly half) as the Silent Generation approached the age of 90. Pension assets are accumulated to be used in retirement.
The pension account holdings of the Gen X and Millennial generations once again closely followed the path of that for the Baby Boomers. They were not worse, on average, but nor were they better.
D. The Mean is Not the Median
As noted above, the averages (the means) will be affected by increases in inequality in the distribution of wealth across households. That increase in inequality was documented in the first post in this series. As noted in Chart 4 of that post, the wealth of the top 0.1% of households ranked by their wealth rose by 2026Q2 to be 4.5 times what it was in 1989Q3 (in real terms and per household). In contrast, the wealth of the bottom 50% of households (i.e. those up to the median) rose to be just 1.5 times as high, with this roughly similar to real per household GDP growth over the period. The wealth of those ranked between 50% and 99.9% also rose by substantially more than it did for the bottom 50%, although not as much as for the top 0.1%.
Given the disparity in wealth at any given time between the half with the greatest and the half with the least, as well as the much greater proportional increase over time in the wealth of the wealthy, the share of the wealth held by the bottom 50% not only started at a low share of the total but that low share also fell over time:
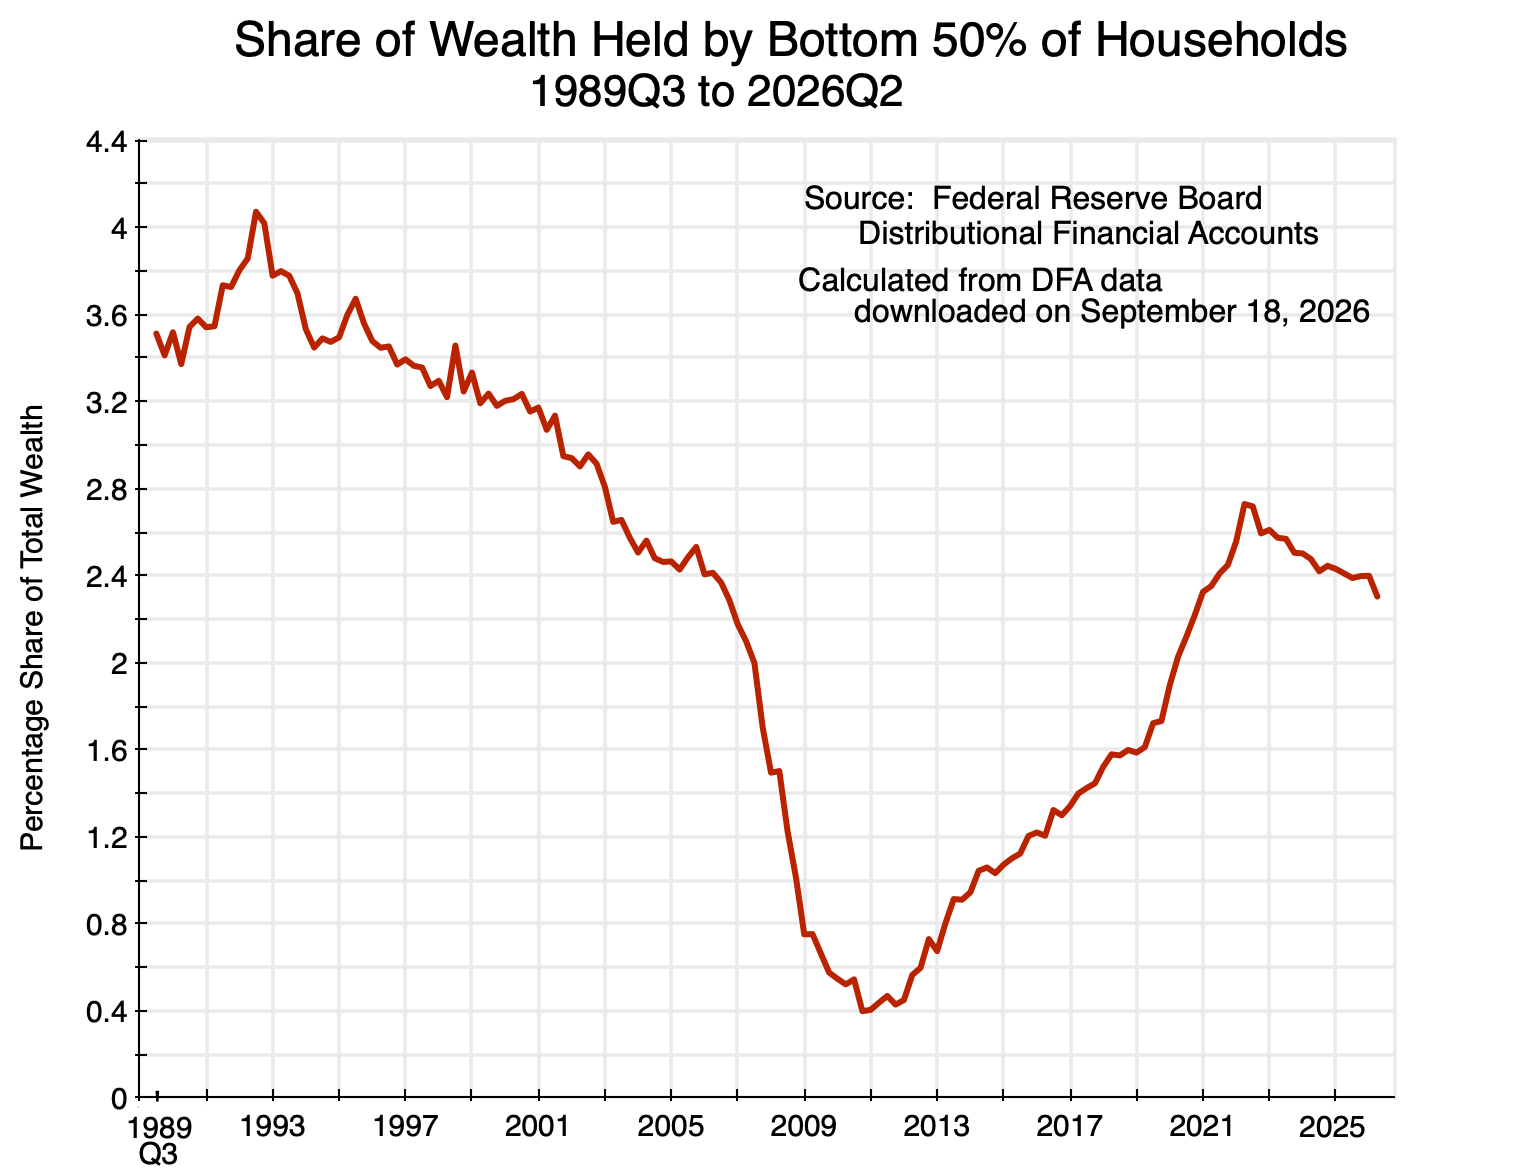
Chart 4
The bottom 50% of households (when ranked by their net worth) held 3.5% of the total wealth in the nation in 1989. This grew to just over 4% by 1992. But it then fell, reaching a low of 0.4% in 2010 due to the housing crash (when many households were in a net negative position on real estate as well as overall due to their mortgage liabilities). Their share of overall wealth rose as housing recovered, and the share as of 2026Q2 was 2.3% of the nation’s total wealth.
The final share of the bottom 50% was one-third below their initial share, and for substantial periods in the middle it was far less than this. Disparity grew. That means that even if the average net worth at any given age was the same between the Baby Boomer, Gen X, and Millennial generations, it would not mean that roughly half of the households enjoyed greater wealth than their parents and half less. With a balanced and unchanged relative distribution, it would.
But because the distribution became even more unequal over time, a similar average wealth at the same age between a generation and a later one implies that more than half of the households (in number) had less wealth than their parents and less than half had more. Even though average wealth was unchanged (at the same age) between the two generations, a larger number of households saw a decrease in wealth relative to their parents than the number who saw an increase, as the distribution grew more highly skewed in favor of those with greater wealth.
As other studies have found, recent generations have found that they can no longer expect normally to do better than their parents – at least as measured by wealth. The data here indicate that while the Baby Boomers have grown wealthier on average than their parents, this ceased to be true for Gen X and the Millennials. And while the average wealth of the later generations has been roughly similar to that of the Baby Boomer generation when at the same age, the greater share of this wealth going to those at the top end of the distribution meant that in terms of household numbers, more than half of the households in the more recent generations are worse off than their parents were at the same age.
The policy implications, and in particular issues on the possible taxation of wealth, will be discussed in a subsequent post.


You must be logged in to post a comment.