
Chart 1
A. Introduction
This is the second in a series of posts on the extreme, and growing, inequality in the distribution of wealth in the US. The first post discussed the basic figures on the distribution of wealth – from households with the least to those with the most – and how the inequality in that distribution has grown over time. It also discussed the source of the data used – the Distributional Financial Accounts (DFA) of the Federal Reserve Board – and some of the unavoidable limitations in that data.
The distribution examined in that post was that of wealth across households, with the households ranked by their level of wealth (more precisely their net worth, but the terms will be used interchangeably). In what was publicly released, the DFA provided figures on assets and liabilities held by the bottom 50% of households ranked by their net worth, the 50 to 90%, the 90 to 99%, the 99.0 to 99.9%, and the top 0.1%.
The DFA data also provides estimates on the net worth of households grouped by other characteristics. One – which will be examined in this post – is the net worth of households when ranked by their level of income rather than by their level of wealth. There are similarities between the two, but also some interesting differences. The household groups in the data released by the Fed provide the assets and liabilities held by the poorest 20% by income, the 20 to 40%, the 40 to 60%, the 60 to 80%, the 80 to 99%, and the top 1%. This corresponds to the categories of households often provided in government statistics and used by analysts when reviewing the distribution of income.
By construction, the distribution of wealth will be most extreme when households are ranked by their wealth. The distribution will be less extreme when households are ranked by any other criterion, including income. But it is interesting to see how closely they correspond to each other, as conventional thinking typically assumes lower-income households will also have low wealth, while the most wealthy households have the highest incomes. We will see that while this is basically true for high-income households (at least for the top 1%), there are significant differences for the bottom half of households.
Section B below will first review the basic story on the distribution of wealth across households when households are ranked by income. The pattern is broadly similar to that discussed in the earlier post for the distribution when households are ranked by their net worth. That is, the distributions in both are highly unequal and have become more so over time. But there are also some differences.
Section C examines the top 1%, comparing those households when ranked by their net worth to the households in the top 1% when ranked by their income. While the wealth of the top 1% when households are ranked by income is lower than when ranked by wealth (necessarily so, by construction), the difference was about 20 to 30% less throughout the period. They moved together over time and were broadly similar. The richest households by income were – not surprisingly – generally the richest households in terms of wealth.
Section D then examines the distribution at the other end of the distribution. Unfortunately, the closest comparison that can be made is of the net worth of the bottom 40% when households are ranked by their income to the net worth of the bottom 50% when households are ranked by their net worth. But even in such a comparison, we will see that the average net worth of the bottom 40% by income is three to four times higher than the average net worth of the bottom 50% by wealth – and by more during the years surrounding the economic and financial collapse of 2008/09. Again, by construction, it will always be higher. What is surprising is that it was so much higher. This has some important policy implications. The bottom half of the population by income will – in many cases – hold a significant amount of wealth. While substantially less than the wealth held by richer households, the assets of those in the bottom half (by income) are primarily equity in owner-occupied homes and investments that they likely intend to use for retirement. This is wealth that, in most cases, one would likely not want to make subject to significant taxation.
B. Real Net Worth per Household, When Households are Ranked by Income
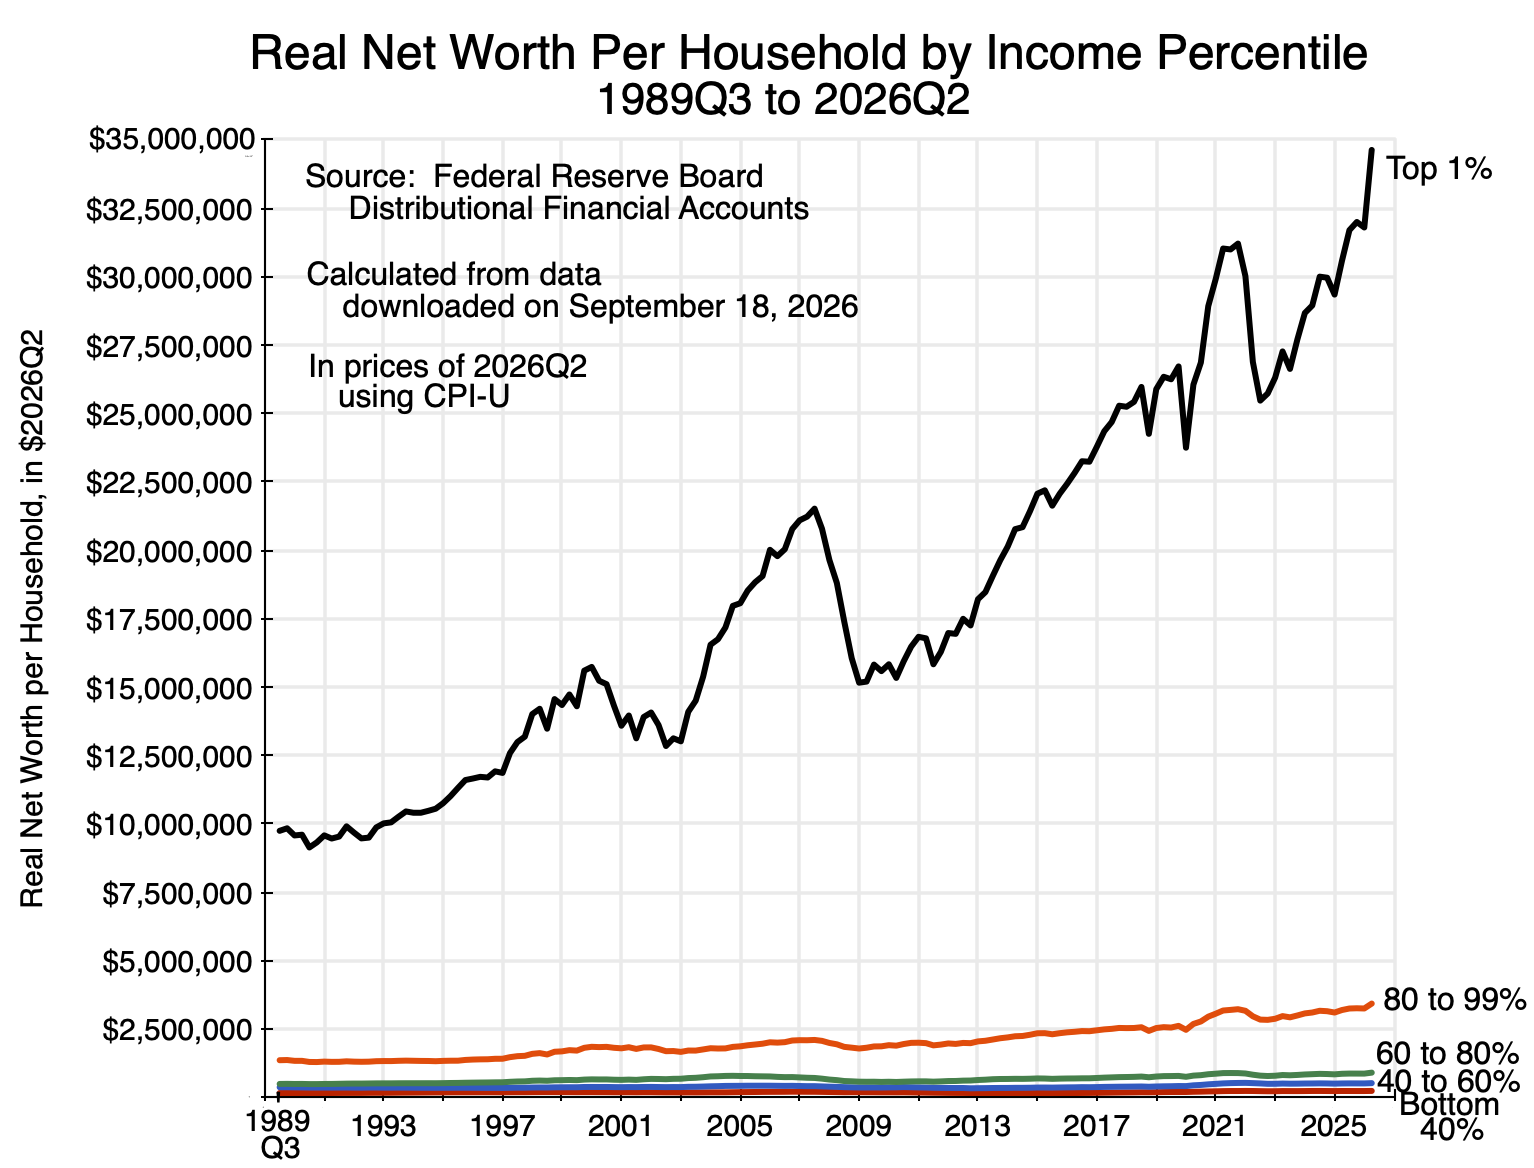
The chart at the top of this post shows how real wealth per household has grown over time for household groups ranked by income. It is broadly similar in nature to the charts in the earlier post in that they show the rich grew far richer while growth was far more modest for those not in the top 1%. Keep in mind in any comparison to the charts in the earlier post that the DFA data had figures on the wealth of the top 0.1% when households are ranked by their wealth, while the top group for households when ranked by income was only the top 1%. The top 0.1% were far richer than the “merely” top 1%. Section C below will focus on a comparison of the top 1% in both.
As before, given the scale required to show how net worth has grown for the richest group (the top 1% here), it is hard to see what the change was for the other groups. Leaving out the top 1%, the figures for the bottom 99% grew as follows:
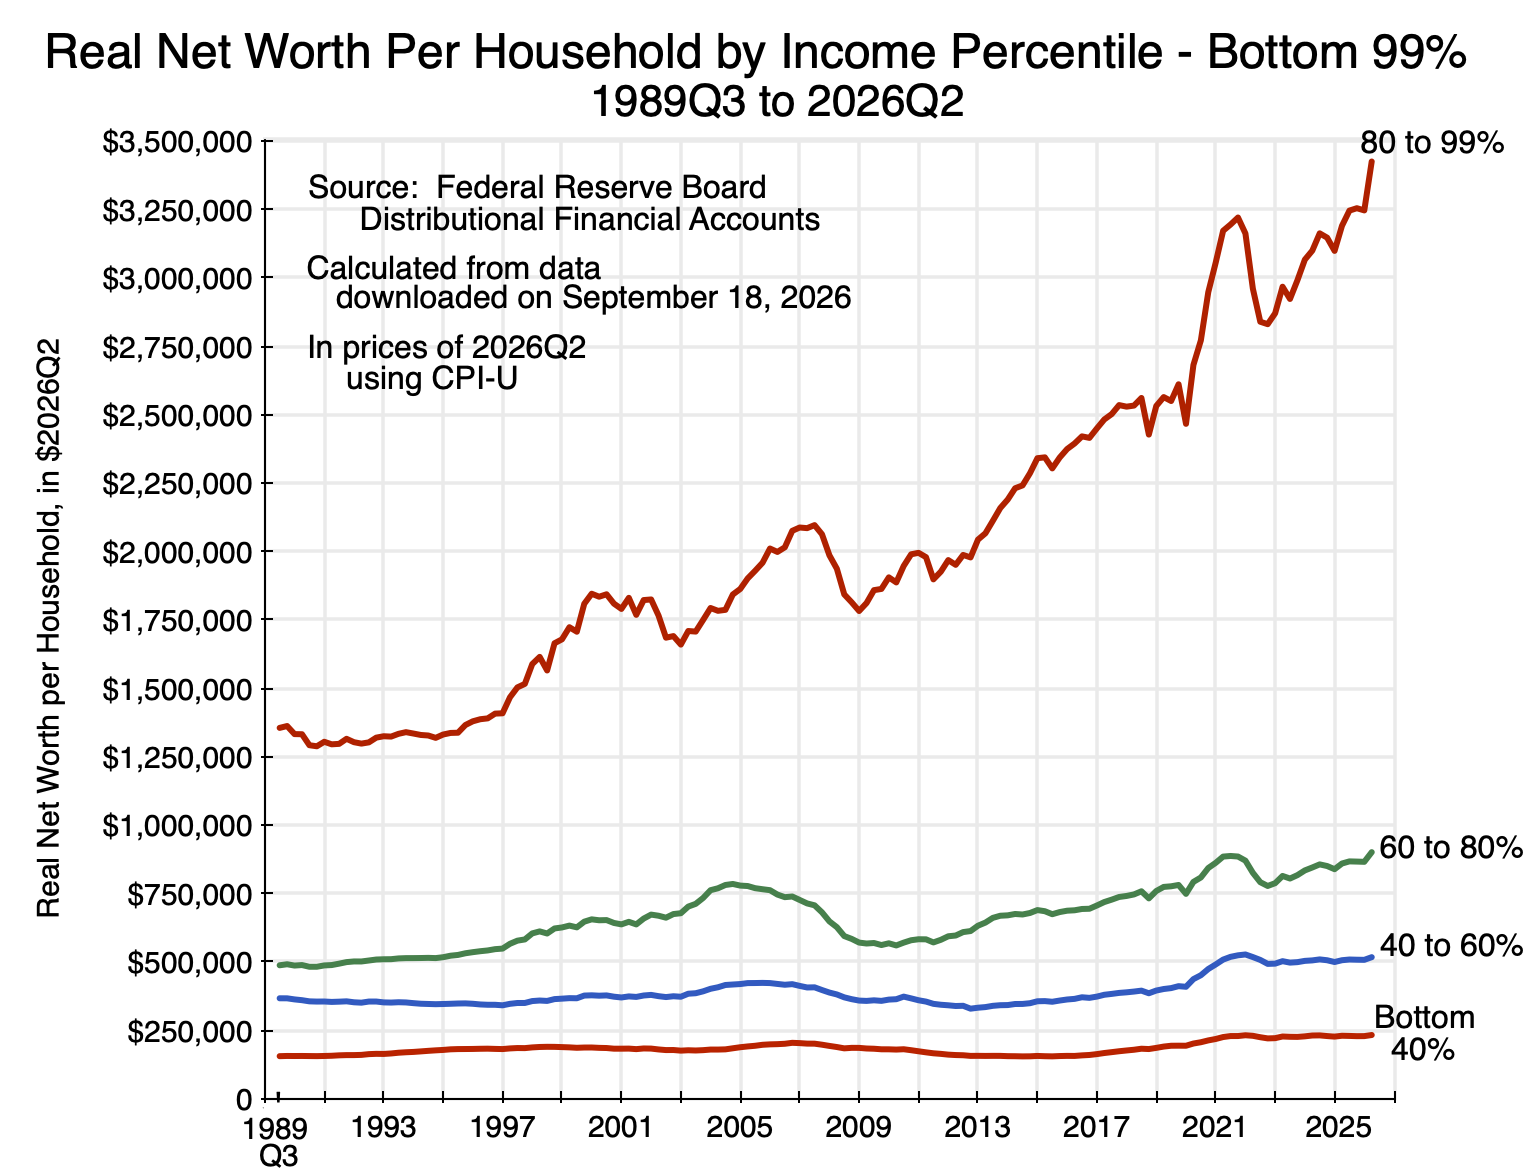
Chart 2
There was substantial growth for the 80 to 99% group, but growth was much more modest for the bottom 80%.
Looking at the growth in real net worth per household of each group relative to their respective levels at the start of the data series in the third quarter of 1989, we have:
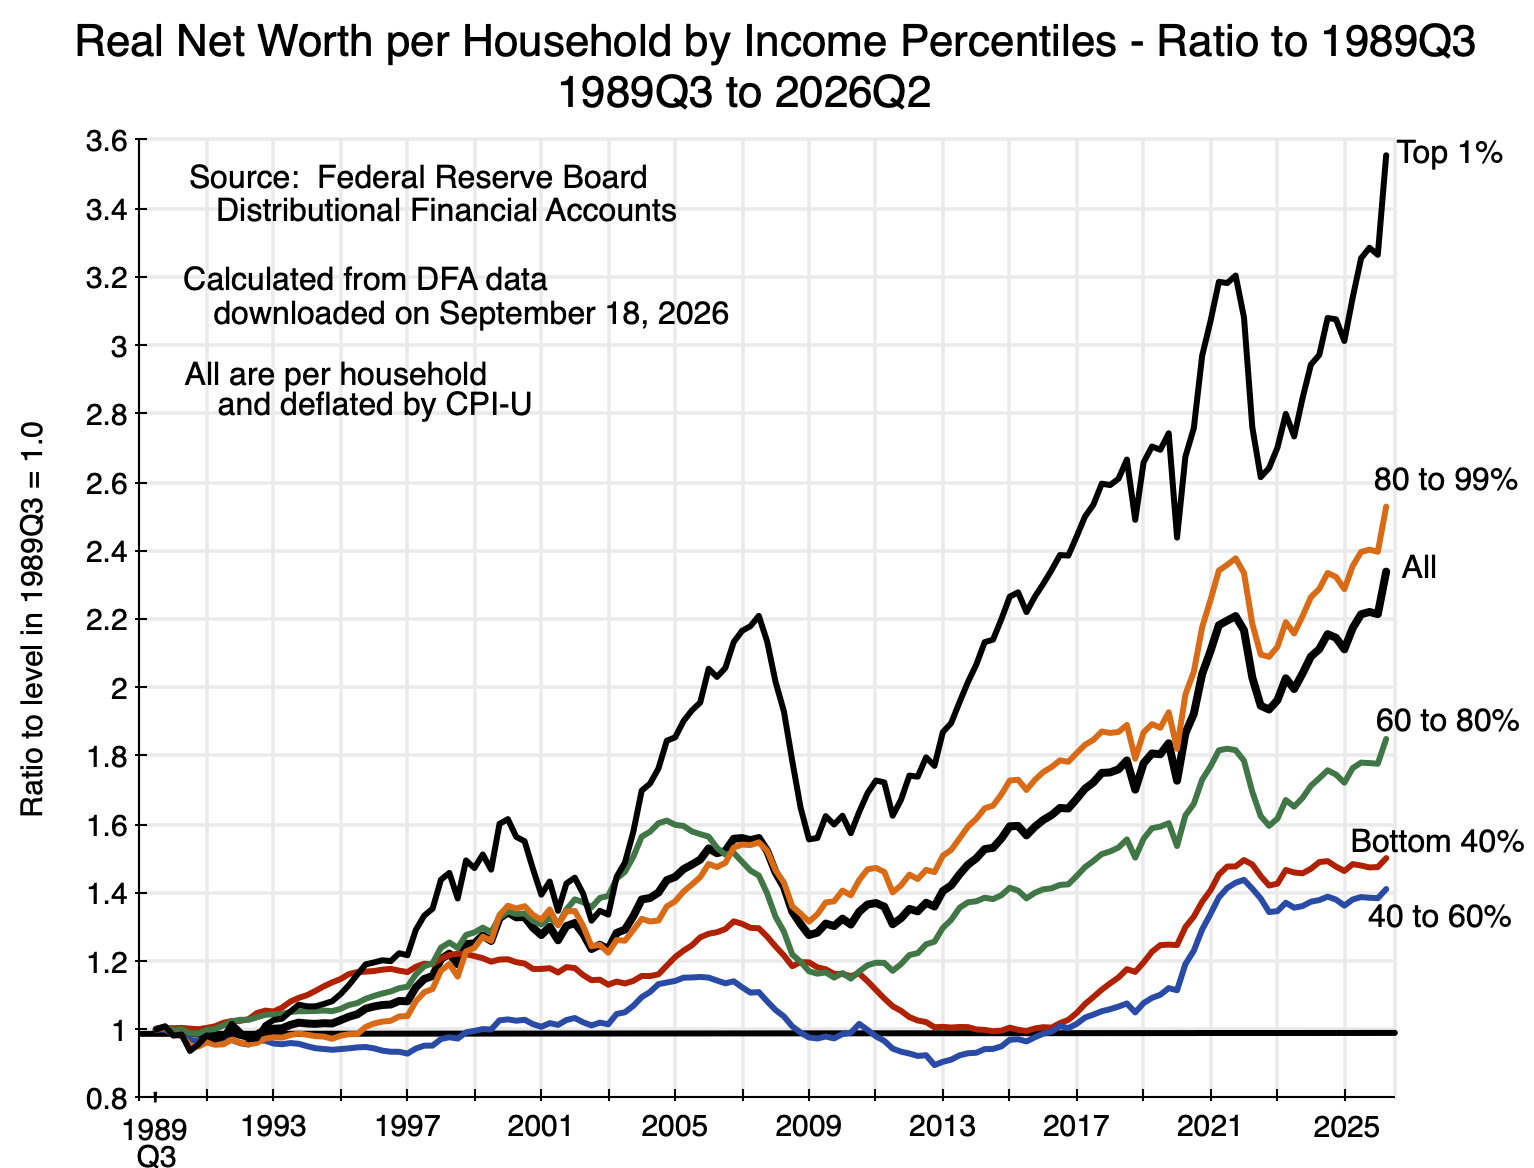
Chart 3
As was the case for households ranked by their net worth, those at the top of the distribution (the top 1% here) saw the greatest gains, with still substantial – but less – gains for the next group below (the 80 to 99% here). Real net worth grew, but by less than the overall average, for those in the bottom 80% by income.
On average across all of the households (the thick black line in the chart), real net worth per household was 2.3 times higher in 2026Q2 than what it was in 1989Q3. This is, of course, the same as that shown in Chart 4 of the earlier post, as the average across all households will be the same regardless of how the households are ranked.
Around this average, the real net worth of households in the top 1% grew to almost 3.6 times as high as what it was for that group in 1989Q3. The 80 to 99% group saw their real net worth grow to be about 2.5 times as high. But the bottom 80% did less well than the overall average. The growth in real net worth of the bottom 40% and the 40 to 60% grew to be only about 1.4 to 1.5 times as high as initially. This is similar to the growth in real GDP per household over the period, which by 2026Q2 was 1.47 times as high as its level in 1989Q3. That is, the wealth of the bottom 60% grew broadly in line with GDP growth. For the top 1%, it grew by much more.
C. The Top 1%
To no one’s surprise, the rich have done well. The DFA data unfortunately does not present estimates for the wealth of the top 0.1% for households ranked by income – unlike what they provided for households ranked by their wealth. But one can combine categories, and calculate the figures for the top 1% for both rankings. That is, one can combine the nominal wealth figures of the top 0.1% and the 99.0 to 99.9% groups when ranked by wealth, divide by the total households in the two groups, and then adjust for inflation.
The figures on the real net worth per household for the top 1% of households when ranked by wealth or when ranked by income are then:
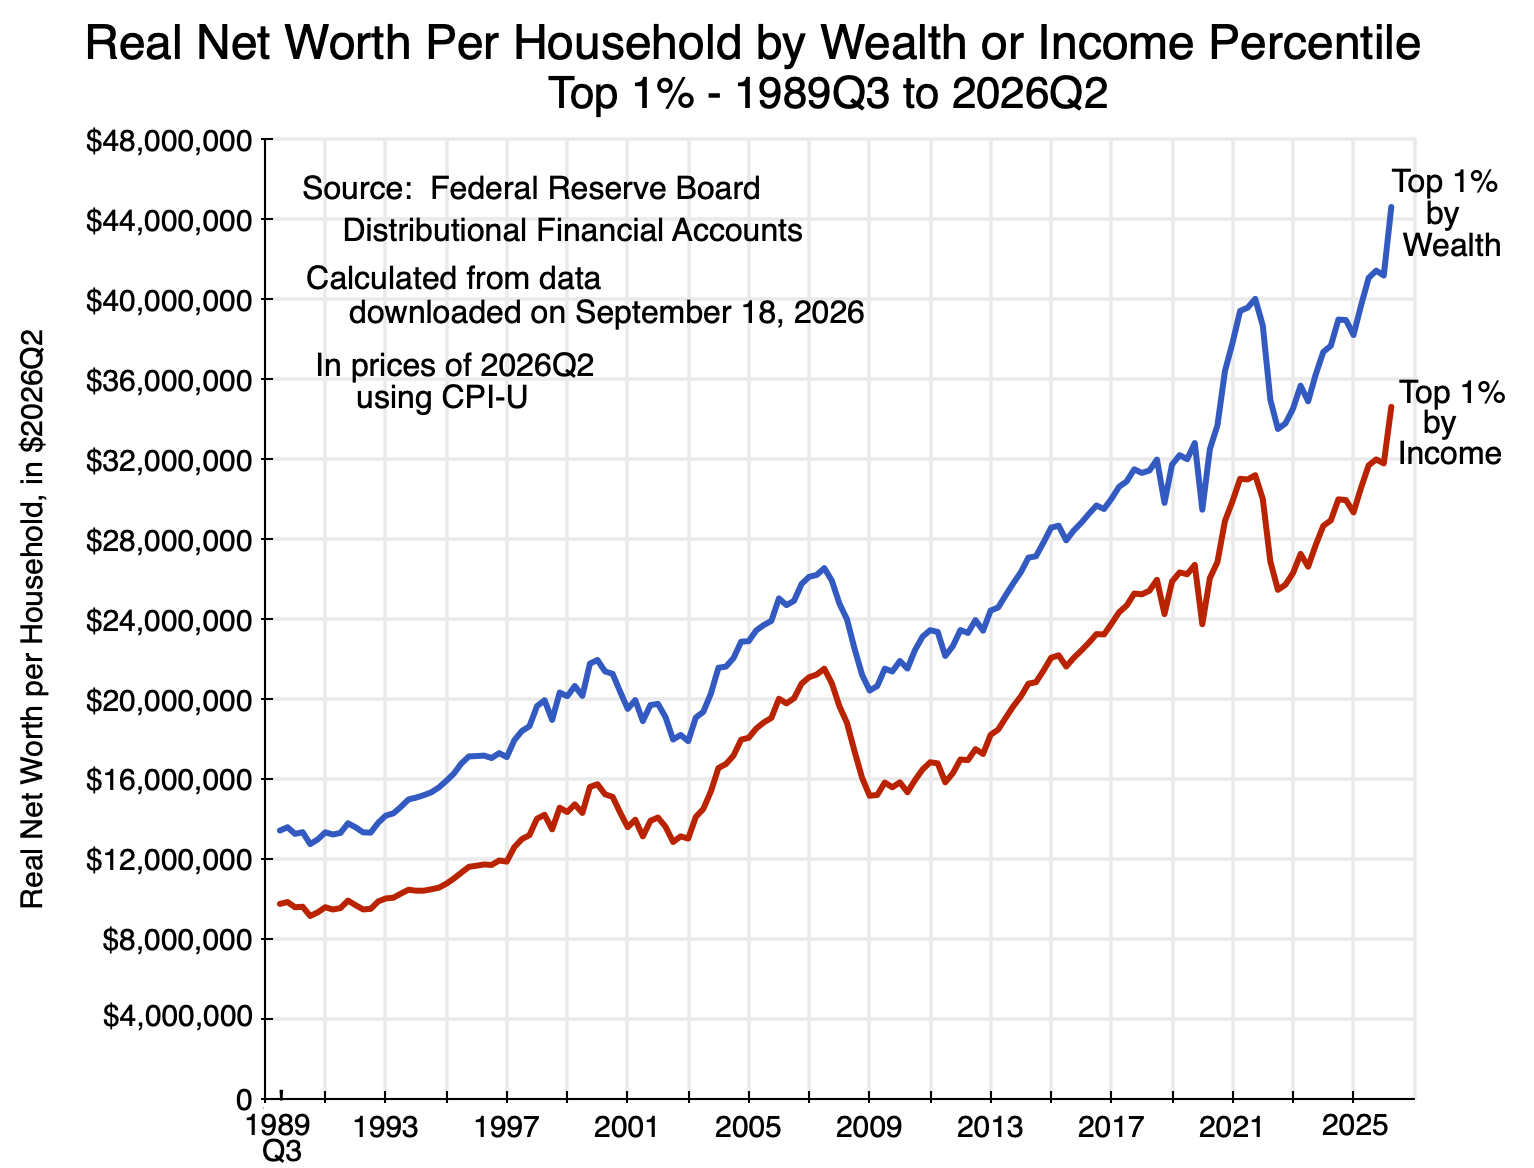
Chart 4
As noted before, by construction the figures on the wealth of the top 1% will always be higher when households are ranked by wealth than when they are ranked by any other criterion, including income. One sees that in the chart above. But it is striking that the wealth of the top 1% of households when ranked by income closely follows the pattern seen for the wealth of the top 1% when households are ranked by wealth, and is uniformly about 20 to 30% below.
The similarity is also clear in more detailed figures available in the DFA on the major assets, liabilities, and hence net worth of the two groups (where this table reflects some aggregation of a more detailed breakdown in the data the DFA makes available):
| 2026Q2 per Household – in $thousands |
Top 1% by Income |
Top 1% by Wealth |
| A. Total Assets |
$35,763 |
$45,524 |
| 1) Real Estate |
$4,675 |
$4,939 |
| 2) Consumer durables |
$686 |
$860 |
| 3) Bank deposits & Money Mkt |
$2,984 |
$3,909 |
| 4) Bonds/Loans |
$1,489 |
$1,912 |
| 5) Equities |
$23,732 |
$30,922 |
| 6) Retirement Accts |
$1,755 |
$2,400 |
| 7) Other |
$440 |
$582 |
| B. Total Liabilities |
$1,128 |
$881 |
| 1) Home mortgages |
$791 |
$422 |
| 2) Consumer credit |
$130 |
$121 |
| 3) Other |
$207 |
$338 |
| C. Net Worth |
$34,635 |
$44,643 |
| o/w Net Real Estate |
$3,884 |
$4,517 |
| Minimum Income/Wealth per Household (in 2022Q3) |
$1,198 |
$11,007 |
The similarities here, and the correlation seen in Chart 4 above, suggest they are close to the same groups. They are not exactly the same – if they were, then the two curves in Chart 4 would be on top of each other and the assets and liability figures in the table would be the same. But they are similar, and there is clearly substantial overlap in households whether ranked by highest income or by greatest wealth.
This is not the case, however, for households in the bottom half of the distribution.
D. The Bottom Half
Those in the lower income strata have not fared so well. The DFA figures for the real net worth per household of the bottom 20% when ranked by income, the 20 to 40%, and all in the bottom 40% are:
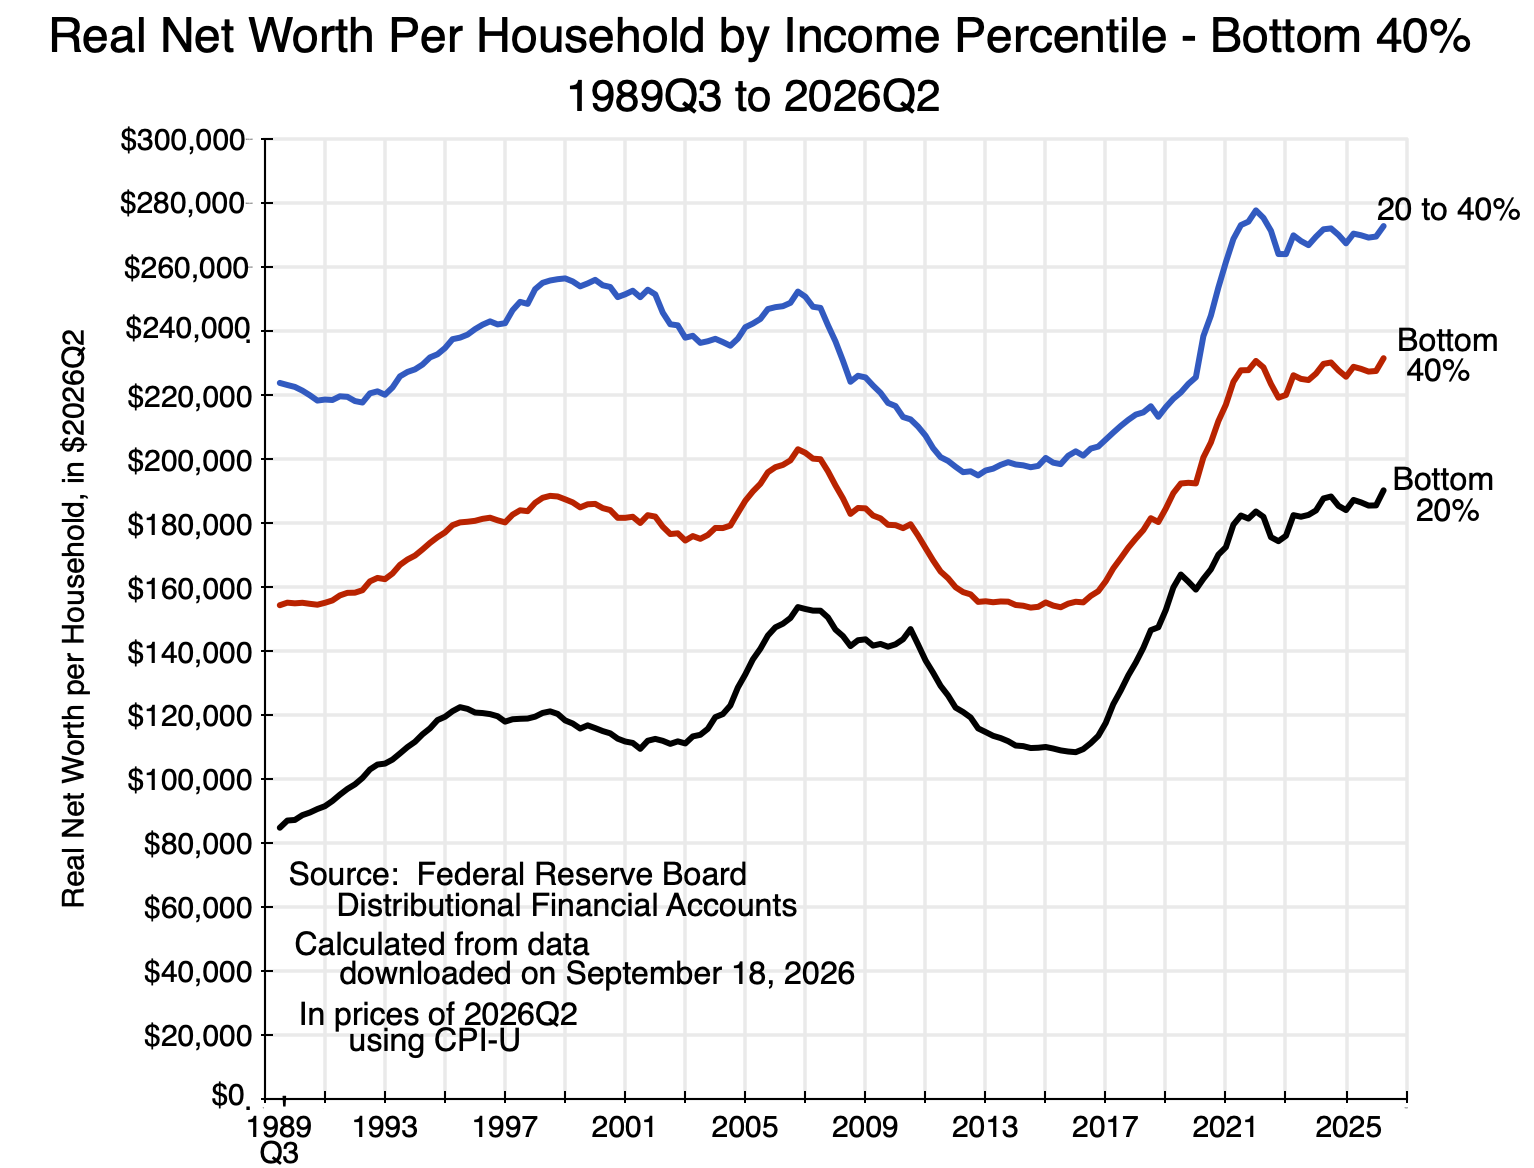
Chart 5
The growth has been limited as well as volatile. There was in particular a substantial plunge from a peak in 2007 due to the collapse that began in 2008 in both home and equity prices. The economic recovery was then slow as a Republican Congress forced through budget cuts despite an economy that had not yet fully recovered.
Chart 5 shows average real net worth per household for all those in the bottom 40% when ranked by income in addition to those in the bottom 20% or in the 20 to 40%. The bottom 40% is, of course, midway between the two. The bottom 40% when ranked by income is the closest we can get for a comparison to the bottom 50% when households are ranked by their wealth. It is not ideal, as the bottom 40% will leave out those in the 40 to 50%, but those figures are not provided separately in the DFA data released. If they were added in, they would raise the average net worth of the group, as one would expect the wealth of those in the 40 to 50% bracket (by income) would be higher than that of those in the bottom 40%.
But a comparison of the bottom 40% by income to the bottom 50% by wealth is still of interest:
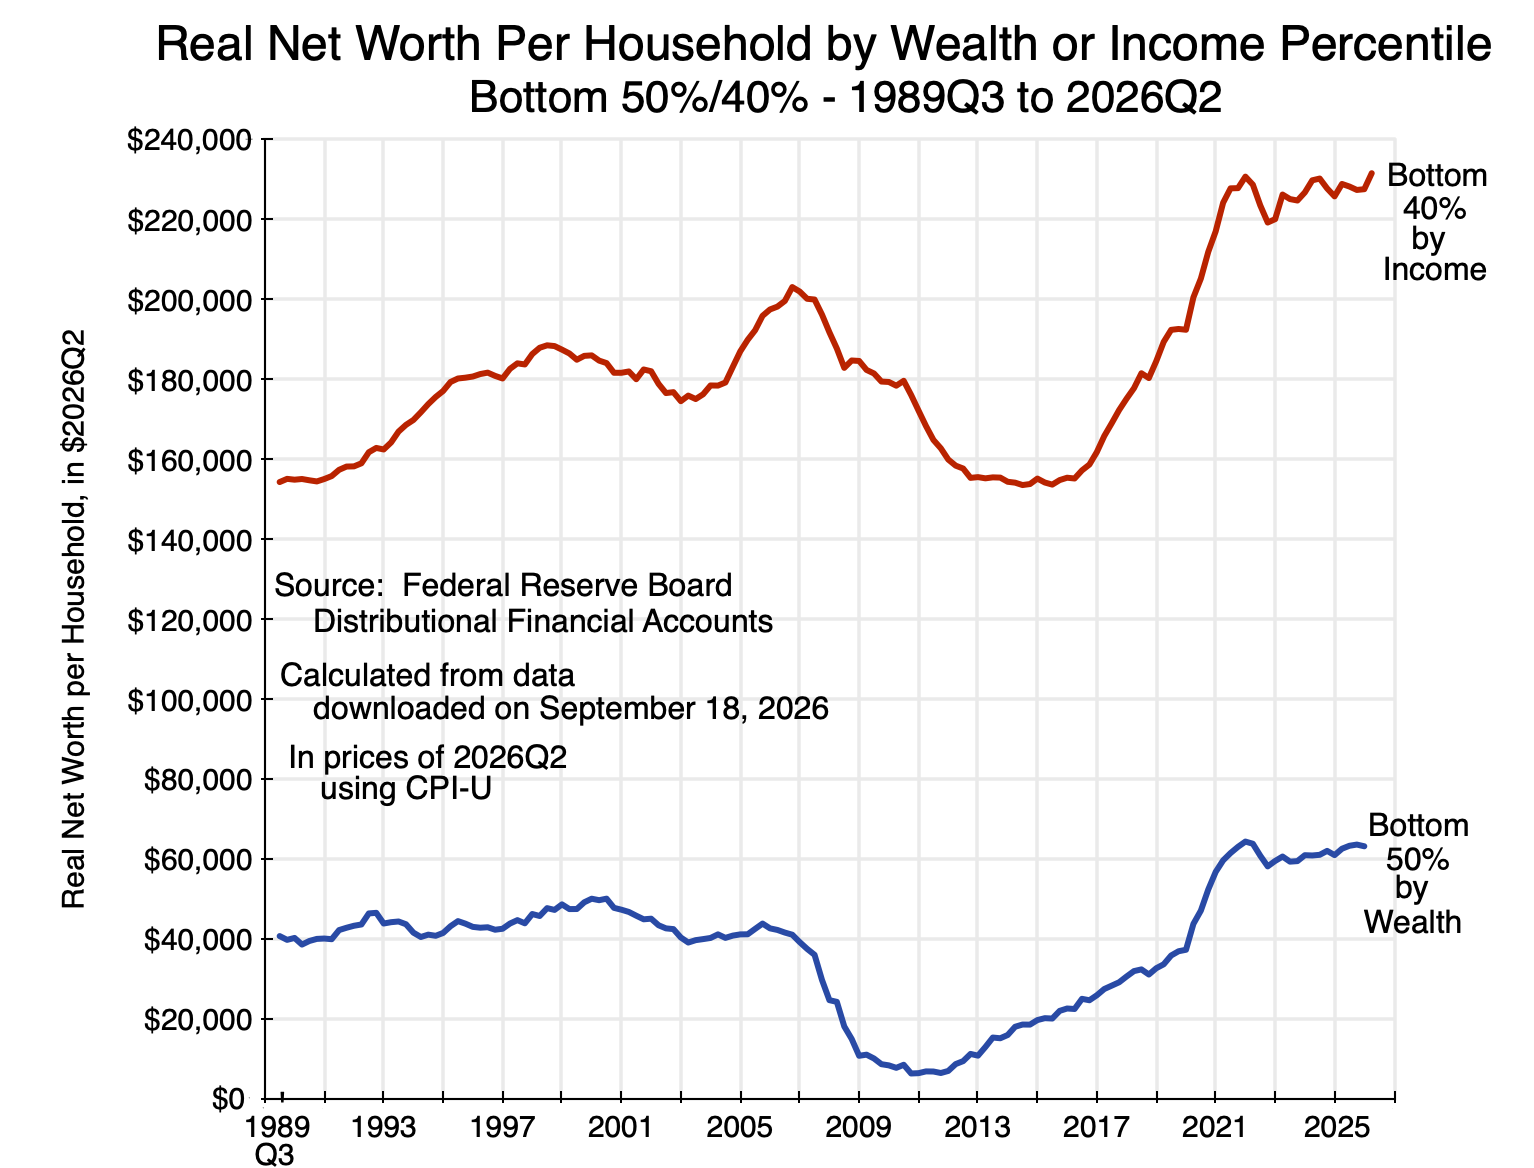
Chart 6
The average net worth of the bottom 40% of households ranked by income is always far above the average net worth of the bottom 50% when ranked by wealth: typically three to four times as high (and much more, as a ratio, in the years following the 2008/09 economic and financial collapse). The most recent figures (for the second quarter of 2026) are that the average net worth of the bottom 40% of households ranked by income was about $232,000, versus an average of just $63,000 when ranked by wealth.
Breaking this down into the average holdings of each group of the major categories of assets and liabilities (and hence net worth), one has:
| 2026Q2 per Household – in $thousands |
Bottom 40% by Income |
Bottom 50% by Wealth |
| A. Total Assets |
$276 |
$152 |
| 1) Real Estate |
$114 |
$71 |
| 2) Consumer durables |
$29 |
$32 |
| 3) Bank deposits & Money Mkt |
$30 |
$12 |
| 4) Bonds/Loans |
$7 |
$1 |
| 5) Equities |
$47 |
$8 |
| 6) Retirement Accts |
$40 |
$19 |
| 7) Other |
$9 |
$8 |
|
|
|
|
| B. Total Liabilities |
$45 |
$89 |
| 1) Home mortgages |
$24 |
$47 |
| 2) Consumer credit |
$19 |
$39 |
| 3) Other |
$2 |
$3 |
| C. Net Worth |
$232 |
$63 |
| o/w Net Real Estate |
$91 |
$25 |
| Household count |
54.1 million |
67.6 million |
| Maximum Income/Wealth per Household (in 2022Q3) |
$54 |
$241 |
The bottom 40% by income hold significantly more real estate (especially net of mortgages), as well as funds invested in equities, in retirement accounts, and in short-term money market assets and bank deposits. The holdings of consumer durables are similar, and the bottom 50% ranked by wealth have greater mortgage obligations on their real estate assets. They also owe a good deal more in consumer credit obligations.
The picture that emerges is that a substantial share of the households with limited net worth (as ranked by their net worth) may be relatively young households with well-paying jobs who have not yet accumulated significant wealth. They own real estate but have a high mortgage, and they borrow significantly against consumer credit. (Note that consumer credit includes student loans as well as car loans and credit card debt.)
The bottom 40% of households ranked by income, in contrast, hold more in real estate (particularly net of mortgages), more in retirement accounts, and more in other investment assets. This would be consistent with those households being older on average and possibly already in retirement. Their income is relatively modest, but they hold significant wealth that they are using in their retirement (or expect to use, if not yet retired).
This will be discussed further in a later post on policy implications. The aim here is to focus on the data. But it indicates the need to be careful in designing any policy where wealth might be taxed. One would want to ensure that households of modest income are not unintentionally burdened.
E. Conclusion
The distribution of wealth is not the same as the distribution of income. One cannot casually assume a one-to-one correspondence between income and wealth holdings. While it is not too much out of line at the upper end of the respective distributions, for the bottom half of the population there is significant divergence. For the bottom half, there are substantial effects possibly resulting from the normal process where one starts out with few assets and a low net worth, but where net worth is then built up over one’s working years to be used when retired.
The upper end is different. The average wealth of those in the top 1% of households when ranked by their net worth overlaps substantially with the average wealth of the top 1% of households when ranked by income. Taxation of income or of wealth for such groups will then have a similar incidence.
The policy implications will be discussed in an upcoming post.


You must be logged in to post a comment.