The Impact of the Budget Sequester: There Are Better Ways to Cut the Debt

Alternative Budget Scenarios, FY13-23

A.  Introduction – The Impact of the Bush Tax Cuts

The budget sequester, the across the board budget cuts that Republicans in Congress insisted on in August 2011 as a condition for allowing the public debt ceiling to be raised, entered into effect on March 1.  While there were some immediate impacts, the primary effects will start a month to two later as government employee furloughs begin to go into effect and public procurement contracts are cancelled or are not signed when they otherwise would have.  Fiscal drag will grow, aggregate demand in the economy will be reduced, and growth in both output and employment will be less than they otherwise would have been.  And this hit is coming when there have been signs that the US had started to enter into a more robust recovery, with the housing market starting to recover and consumer demand growing.  The sequester will now slow this down, and possibly reverse it.

The argument for the sequester was that such budget cuts were necessary to bring down the public debt.  Public debt as a share of GDP has indeed grown sharply in recent years.  But as was discussed and analyzed in a posting on this blog from more than a year ago, this issue arose not because of government spending under Obama, but rather because of the Bush tax cuts, the spending on the Afghan and Iraq Wars (the first wars in US history which were not paid for at least in part by tax hikes, but rather purely by borrowing), and the economic and financial collapse that began in 2008, in the last year of the Bush Administration.  That blog shows that without the Bush tax cuts and without the unfunded wars, but still assuming the 2008 downturn happened (thus reducing public revenues while increasing expenditures that rise in a downturn such as for unemployment compensation) and including all the spending of the Obama years (other than for the wars), public debt at the end of FY2012 would have been only 32% of GDP instead of 73%.

The difference between a public debt ratio of 32% of GDP and a ratio of 73% of GDP is not small.  The Bush tax cuts (mostly) and the unfunded wars (to a still significant, but lesser, extent) certainly weakened the US fiscal position.  Without that increase in the debt due to those two decisions, there might have been less pressure on Obama to cut back on government spending, with the resulting fiscal drag that has slowed the recovery.

Looking forward, that blog post also showed that even with the history of the Bush tax cuts, the unfunded wars, and the effects of the 2008 downturn, a phasing out of the Bush tax cuts (thus returning to the rates of the Clinton years) would have led to a steady fall in the public debt to GDP ratio from FY2014 to at least FY2022.

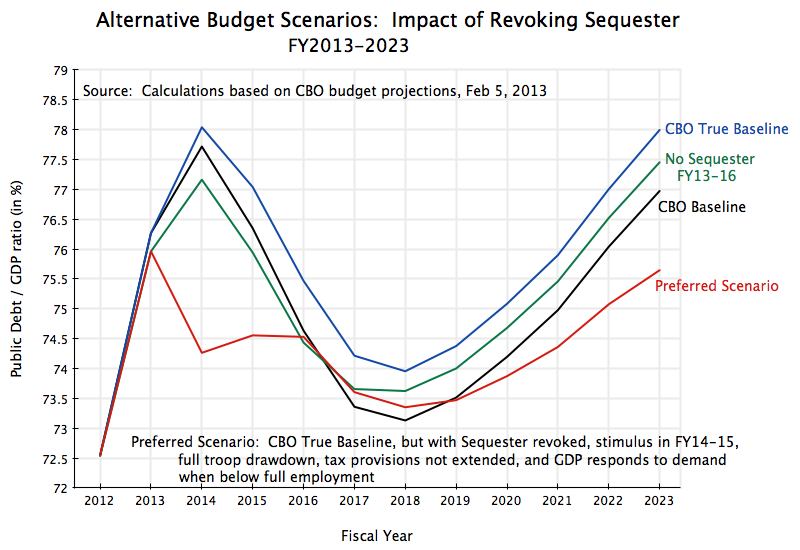
Unfortunately, the Bush tax cuts have now been made permanent for all but the richest 1% of the population.  As a direct consequence of this, the public debt to GDP ratio will not now see a steady fall (to at least FY2022) as it otherwise would have.  The graph above shows what the CBO now projects the public debt to GDP ratio will be under its baseline scenario, along with calculations I did (based on numbers provided in the CBO report and its accompanying data files) under several alternative scenarios.

B.  CBO Baseline and CBO True Baseline

The CBO Baseline scenario presents, as the CBO is required to do, its projections of what the budget and debt will be assuming current law is followed.  In this scenario, the CBO projects that the public debt to GDP ratio will peak at 77.7% of GDP in FY2014, and then fall to a trough of 73% of GDP in FY2018 before starting to rise again.  It would reach 77% of GDP in FY2023.

This longer term dynamic, with its renewed rise in the public debt to GDP ratio after FY2018, is primarily driven by two factors:

  1. The permanent extension of the Bush tax cuts for 99% of the population, which reduces sharply government revenues (by 2 1/2% of GDP now, rising to 3% of GDP in the 2020s and more beyond, for the full Bush tax cuts, as discussed in this blog post).  As noted above and discussed in the cited blog post from a year ago, if the Bush tax cuts had been phased out, the public debt to GDP ratio would have been falling to at least FY2022.
  2. The CBO’s projection that government health care costs (primarily for Medicare and Medicaid) will continue to rise as a share of GDP as general health care costs rise in the US, and (to a lesser extent) due to the aging of the population.  The reforms achieved through ObamaCare will reduce Medicare expenses by a significant amount as more of the currently uninsured become insured (since the uninsured cannot cover the full cost at hospitals of their treatment, so hospitals must shift a portion of those costs onto what they charge Medicare, as discussed in this blog post).  But there is a need for more such savings, which reduce costs while they maintain delivery of currently covered services.

As noted, the CBO is required to present in its Baseline scenario the consequences of current law, including that certain expenditures will continue beyond FY2013 as the law provided for in FY2013 (although adjusted for inflation).  This can lead to some perverse assumptions, which the CBO recognizes but is not allowed to change its Baseline to reflect.  However, the CBO does provide the data needed so one can make such adjustments.  Specifically, the scenario labeled “CBO True Baseline” in the graph above reflects:

  1. The assumption that a portion of the special appropriation enacted in January for Hurricane Sandy relief will not be repeated each year going forward.  This will lead to $353 billion in lower federal expenditures than CBO had to assume in its Baseline over the ten year period of FY2014-23 (including lower debt service following from the consequent lower debt).
  2. The assumption that overseas troops (primarily in Afghanistan) will continue to be drawn down, from 115,000 in FY2012 and 85,000 in FY2013, to a projected 60,000 in FY2014 and 45,000 in FY2015 and after.  The CBO assumes there will still be a significant number of such special combat troops overseas after FY2015, but not as many as now.  This will lead to savings of $693 billion over ten years.
  3. But increasing costs is the assumption that the so-called “Medicare Doc Fix” will continue.  Under a law originally passed in 1997, Medicare payments to doctors would be cut according to a formula.  But that law has been overridden each year since 2002, and everyone expects that will continue.  If it were not, payments to doctors would be slashed by 27% this year.  Continuing the override, the ten year cost to the budget would be $167 billion.
  4. Also increasing the deficit, by reducing revenues, is CBO’s assumption that a large set of 75 different corporate tax “provisions” (others might call them loopholes) will continue to be extended, rather than allowed to expire as per current law.  The cost of extending these tax provisions over the ten years is an estimated $1,142 billion.

Making these four changes, will have the net effect of adding $263 billion to the ten year deficit.  This is, however, a more realistic estimate of the baseline.  The resulting public debt to GDP ratio would be 78% of GDP in FY2023, rather than 77%.

C.  Impact of Revoking the Sequester in FY2013-16

There are many scenarios one could run against these baselines.  For the graph above I have shown two.

The first alternative scenario looks at the impact of revoking the sequester in fiscal years 2013 to 2016.  The rest is as in the CBO Baseline.  While not a primary focus of the CBO budget work, the CBO forecasts that the economy will recover only slowly from the current downturn (in part precisely because of the fiscal drag from the budget cuts that have been and are being implemented), and will only reach full employment production in FY2017.  The CBO then assumes the economy will grow from that point forward at the rate of growth of potential GDP (what GDP would be at full employment), which it projects based on its projections of growth in the labor supply and productivity.

The No Sequester FY13-16 scenario revokes the sequester in those four fiscal years, and includes the impact of such extra spending in creating demand for production, assuming a multiplier of two.   With this modest boost to GDP (higher growth rates of 0.6% points in FY13 again in FY14, and then about the same as in the CBO Baseline), tax revenues will also rise.  The projection also assumes that 33% of this additional GDP growth will provide resources to reduce the deficit, either through additional tax revenues (mainly) or by reducing certain government expenditures such as for unemployment compensation (to a lesser extent).  The 33% is a rough estimate of the impact of these two together.  They will offset part of the impact on the deficit of the cost of the extra expenditures if the sequester is revoked.

Due to the modestly faster recovery of GDP if the sequester is revoked in those years when the economy is operating at less than full employment, the debt to GDP ratio is in fact lower in fiscal years 2013 to 2016 than it is in the CBO Baseline, despite the higher government spending.  It hits 77.2% of GDP in FY2014 rather than the 77.7% of GDP in the CBO Baseline.  This illustrates how austerity policies (the sequester) have a perverse impact on the public debt to GDP ratio in the near term when an economy is functioning at less than full employment, due to a lack of demand.

The revocation of the sequester in FY13-16 will, however, lead to a somewhat higher debt than in the baseline, under the stated assumptions.  And from FY2017 onwards GDP is already at its potential level at full employment and cannot go higher.  Hence the debt to GDP ratio will be higher from FY2017 onwards, by about a half percentage point of GDP.  But that would then be the time to cut back on government spending if one is concerned about the public debt to GDP ratio.  That is, do not cut back further on demand when it is already insufficient, leading to higher unemployment.  Rather, the time to reduce government demand, if the debt ratio is of concern, is when the resources in the economy are fully employed and will be used for other purposes and not left idle.  Cutting back on such demand for workers when resources are idle, with unemployment high, simply leads to even higher unemployment.

D.  Preferred Scenario

Many alternative scenarios could be constructed.  I will just show one here, based on the CBO numbers and without looking at more fundamental changes.  This scenario starts with the CBO True Baseline, but makes the following changes:

  1. The sequester is revoked in all years.  This will increase expenditures by $1,223 billion over ten years (including the impact on debt service).
  2. Rather than cutting spending, as in the sequester, one instead boosts government spending in fiscal years FY2014 (by $400 billion) and FY2015 (by $250 billion).  These levels were chosen as such extra spending will, under the stated assumptions, boost growth sufficiently to bring the economy back to full employment and then keep it there, in the years when there would otherwise be high unemployment.
  3. Rather than draw down overseas troops only to 45,000 from FY2015 and after, as in the CBO True Baseline, the Preferred Scenario brings down troops faster and further, to only 5,000 from FY2015 and after.  This will save a further $702 billion over ten years, above the savings of $693 billion CBO estimates will be achieved by bringing overseas troops down to 45,000.
  4. The CBO True Baseline assumes that the 75 different corporate tax provisions will be extended when they would otherwise expire under current law (mostly this year and next), at a budgetary cost of $1,142 billion over ten years.  The Preferred Scenario assumes these will not be extended.

Under the Preferred Scenario, the public debt to GDP ratio falls sharply in FY2014, despite the extra spending and indeed a higher fiscal deficit, because of the boost to GDP bringing it to full employment levels.  Commentators often forget that the debt to GDP ratio depends not only on what the debt is, but also what GDP is.  The sharp fall in the debt to GDP ratio also holds in FY2015 (compared to the Baseline scenarios), because of the boost to GDP, but by FY2016 and FY2017 the ratio is close to that in the Baseline scenarios as GDP approaches the ceiling of its potential level in the CBO projections, and cannot go higher.

Going forward, with GDP at the ceiling of its potential level, the debt to GDP ratio follows a lower path than it does under the CBO Baseline (or True Baseline) scenarios.  The reason is that in those years the savings from the lower troops deployed overseas in combat, plus the additional revenues from not extending the 75 corporate tax provisions, leads to lower deficits and lower debt growth.  It is in such periods, when the economy is operating at full employment (by CBO assumption), that one should focus on reducing deficits if the debt to GDP ratio is of concern.

The debt to GDP ratio nevertheless starts to rise again after FY2018 in the Preferred Scenario, as it does in all the scenarios.  The blog post from last year cited above noted that phasing out the Bush tax cuts would have led to a declining debt to GDP ratio until at least FY2022.  But with the extension of the Bush tax cuts for 99% of the population this will now no longer hold from FY2018.

The primary reason these debt to GDP ratios ultimately turn up is the continuing rising cost of health care unless something is done.  And note this is not because government provided health care through Medicare is more expensive than health care provided through private insurance.  For similar risk populations, Medicare is indeed more efficient and cheaper to provide than private health insurance.  The CBO estimated that in 2007, private insurance of Medicare beneficiaries cost the government 12% more than traditional Medicare would have.

The problem rather is that health care costs are rising, and while there are savings through government programs such as Medicare, these savings are not enough to offset the expected long term rise in health care costs unless something further is done to reduce the costs.

E.  Conclusion

The debt to GDP ratio has risen in recent years as a consequence of the Bush tax cuts, the unfunded wars in Iraq and Afghanistan, and the economic collapse of 2008 with the subsequent slow recovery.  But as high as it has risen, it is now foolish to follow austerity programs, such as the sequester, with unemployment still excessively high.  These austerity measures serve just to hold back the economy, and will increase, not decrease, the near term debt to GDP ratio over what it would have been without such fiscal drag holding back growth.  A program of fiscal stimulus sufficient to bring the economy back to full employment would indeed lead to a sharp reduction in the debt to GDP ratio over the next few years.

Longer term, there is a rise in the debt to GDP ratio in all the scenarios after FY2018, due to a rise in health care costs unless something is done to reduce these costs.  The problem is not that government supported health care funded through Medicare or Medicaid is more expensive or less efficient than private insurance funded health care – the government programs are indeed cheaper and more efficient.  The problem is health care cost itself in the United States.  But that is an issue I hope to address in future posts on this blog.

The Republican Campaign to Shift the Blame for the Sequester To Obama: If You Don’t Want It, Pass a Simple Bill To End It

John Boehner Obamaquester

It appears increasingly likely that the Congressionally mandated severe and across-the-board budget cuts, known as the sequester, will begin on March 1.  Serious negotiations are not underway, Congress is only back in session now after having been gone for most of the past two weeks, and public statements are not focused on negotiating an agreement but rather on shifting blame.  Should the sequestration budget cuts go into effect, not only will critical federal functions be suspended, but the sudden cuts in spending levels will likely push the country back into recession.  As was noted in an earlier posting on this blog, cuts in Government spending were already the primary cause for a fall in GDP in the fourth quarter of 2012 (according to the initial estimate, which may be revised).  More broadly, had government spending been allowed to rise following the 2008 downturn as it had during the Reagan presidency following the 1981 downturn, we would now likely be at full employment.

The situation is serious, but the new assertion by the Republican leadership that the sequester is there only at the insistence of Obama is almost farcical.  As part of this campaign, Speaker Boehner has staged events for the cameras such as that pictured above, behind a podium labeled with the hashtag “#Obamaquester”, and in front of a clock marked as “Countdown to #Obamaquester”.  Boehner is now asserting that the sequester is only there due to “the president’s demand”, and he refers to the cuts as “the president’s sequester”.

Even some of Boehner’s Republican colleagues find it absurd to try to blame Obama for the sequester.  For example, Representative Justin Amash, a conservative Republican from Michigan (who voted against the bill that set up the sequester mechanism) said:  “I think it’s a mistake on the part of Republicans to try to pin the sequester on Obama.  It’s totally disingenuous.  The debt ceiling deal in 2011 was agreed to by Republicans and Democrats, and regardless of who came up with the sequester, they all voted for it.  So, you can’t vote for something and, with a straight face, go blame the other guy for its existence in law.”

With these new assertions from Boehner and similar assertions from colleagues such as Congressman Paul Ryan (the Republican Chair of the Budget Committee in the House), it may be of interest to review briefly the history of how the sequester mechanism came to be:

  1. The sequester’s origin came from the strategic decision by the key Republicans in Congress in early 2011 to use the routinely required authorization to raise the public debt ceiling as leverage to force through drastic cuts in the budget.  Eric Cantor, the then new Republican House Majority Leader, was the principal architect and proponent of the strategy, which he proposed in January 2011 at a closed-door retreat of Republican congressional members in Baltimore.  He was soon stating publicly that the Republican controlled Congress should not approve an increase in the debt ceiling without drastic spending cuts.  
  2. What this meant was that they would hold the economy hostage to their budget demands, as a refusal to raise the debt ceiling would force the US to default on its debt.  While speeches and pontificating are routine whenever Congress has had to approve an increase in the nominal public debt ceiling, never before had such demands been attached to this approval.
  3. And default on the US public debt would be serious.  US Treasury Bonds are held as risk-free assets both in the US and around the world, and are indeed the foundation of the modern international monetary system.  The impact of default on such assets cannot be predicted with certainty, as it has never happened before, but the consequences could quite possibly throw the global economy into a downturn that would make the 2008 collapse look mild. 
  4. [As an aside:  While I am not a lawyer, the constitutionality of a refusal by Congress to raise the debt ceiling (and hence force a default on the public debt) looks to me to be questionable.  The Fourteenth Amendment to the Constitution (passed in 1866, following the American Civil War) reads in its Section 4:  “The validity of the public debt of the United States, authorized by law, including debts incurred for payment of pensions and bounties for services in suppressing insurrection or rebellion, shall not be questioned.”  In their oath of office, Congressmen pledge to uphold the Constitution.  They cannot then take actions (or defer taking action) which would violate the Constitution by forcing a direct default on the public debt.  However, as noted above, I am not a lawyer, and obtaining such Congressional approval for increases in the debt ceiling has been customary since substantial borrowing needs developed during World War I.]
  5. As the country was coming increasingly close to breaching the existing debt ceiling in July 2011, negotiations were underway at many levels in Washington.  I will not try to review them all here, but the most senior were direct negotiations between Obama and Speaker Boehner.  These talks broke up when Boehner was not able to convince his Republican congressional colleagues to support an approach that included even a relatively small share of revenue increases along with larger expenditure cuts.  In fact, Boehner had to reverse himself twice from tentative agreements he had reached with the President, as he could not get backing from sufficient numbers of his Republican colleagues in Congress.  At the time, Boehner stated publicly that the President had negotiated in good faith.  But in his op-ed piece in the Wall Street Journal this month, Boehner now says the opposite, and asserts the talks failed because the President had reversed his position.
  6. As the deadlines approached and it became clear that agreement would not be possible on a specific set of spending cuts and revenue increases, Jack Lew, then the head of the Office of Management and Budget in the White House (and soon likely to be US Treasury Secretary), suggested consideration of a mechanism that had been used in the 1980s, in budgetary negotiations during the Reagan term.  In its final form and as passed by Congress, the mechanism established a Joint Committee made up of 12 members of the Senate and Congress (split evenly between Republicans and Democrats), who would by a certain date (November 21, 2011) develop a plan to achieve $1.2 trillion in deficit reduction (over 9 years) through a combination of spending cuts and revenue increases.  If the Joint Committee could not reach agreement, an automatic cut in spending of $109 billion per year over nine fiscal years (FY2013-21) would be required, split evenly between Defense and non-Defense programs.  These automatic across-the-board cuts were known as the “sequester”, and were deliberately crude and draconian to serve as an inducement to the Joint Committee to reach an agreement on more palatable means to achieve a similar reduction in the deficit.
  7. The mandate of the Joint Committee was to reach agreement on measures that would reduce the deficit by $1.2 trillion over ten years.  Such measures could include both spending reductions and revenue increases.  And the revenue increases could be achieved not only by raising tax rates, but also by closing tax loopholes, cutting expenditures that are implemented via tax subsidies, and/or broadening the tax base.  But the Joint Committee never reached an agreement, as Republicans refused to agree to any revenue measures at all.
  8. At the time, Boehner, Paul Ryan, and other Republicans praised the sequester mechanism as a means to force what they were seeking.  Boehner famously said in a CBS interview on August 1, 2011, that he had gotten “98%” of what he wanted.  Ryan emphasized and praised the sequester mechanism in an interview on Fox News on August 1.  Following his recent reversal now to criticize the sequester, a YouTube video was even put together showing a series of Ryan statements over the years in favor of sequester mechanisms (including this one specifically) and statutory spending caps.  And a Power Point presentation put together by Boehner when he made the case to his Republican colleagues to vote in favor of the bill that established the sequestration mechanism, makes clear his approval of it at the time.
  9. Obama, in sharp contrast, had always wanted a clean bill authorizing an increase in the public debt ceiling, without additional conditions added on.  It is indeed rather absurd to think that Obama would want to see a bill passed that would deliberately tie his hands.  Obama had proposed alternative approaches to reducing the deficit, including in his FY2013 budget (in great detail) and during the negotiations with Boehner.  Obama still stands by these proposals.  But while the Republicans assert that Obama has not offered any such plans, the issue is rather that the Republicans have rejected the plans Obama has offered.
  10. Jack Lew only suggested the option of the sequester mechanism as a fallback if no agreement is reached, late in the negotiations when it became clear that agreement on a specific set of spending cuts and revenue increases would not be possible.  But Obama and Lew would have greatly preferred a clean bill without any such conditions.  It is absurd to say, as Boehner now does, that the sequester mechanism is there only because it was something Obama “insisted upon in August 2011”.

The automatic sequester will cut government expenditures by $85.3 billion over the remainder of the fiscal year, from March 1 to September 30, 2013.  If nothing is done, there would be further cuts of $109.3 billion in each of the next eight fiscal years to FY2021.  The $85.3 billion cut over seven months would be equal to roughly 1% of the seven month GDP.  With a multiplier of two, this would by itself drive down GDP by 2% from what it would be otherwise.  The Congressional Budget Office estimates that the US economy is producing at about 5 1/2% below what it potentially could be producing at full employment.  An additional 2% reduction would be significant.

Agreement is difficult in Washington, particularly in the current political environment.  But if Boehner, Ryan, and others now hold to the view that the sequester is a bad idea, there is a simple solution.  All that they would need to do would be to pass a simple bill which revokes it.  Obama would certainly sign it.  The budgetary mechanism would then revert to the standard process, and that standard process could be followed to determine whether certain public expenditures should be cut and by how much, and whether revenues should be increased by closing loopholes, cutting tax subsidies, raising rates, or some other approach.

But there is nothing that requires the sequester mechanism.  If Boehner, Ryan, and the others do not want it, they can pass a simple bill to end it.

Government Spending During Obama’s First Term – The Facts

Govt 2 During Presidential Terms - Cons & Invest, 1953-2012

A.  Introduction

Republicans continue to assert that government spending has exploded under Obama.  It is a myth.  Depending on which specific measure of government spending is used, such expenditures have either fallen during Obama’s presidency or have increased at one of the lowest rates in the last six decades.

This myth is unfortunately important as conservative politicians continue to use it aggressively to push for drastic cuts in government spending, despite the damage such cuts have done to the economic recovery.  And drastic government spending cuts loom with the rapidly approaching deadline of March 1 when the automatic across-the-board sequester budget cuts will enter into force, unless Congress pulls back from the brink before then with new legislation.  Yet as of this writing, Congress is on vacation, and there is little sign that any agreement will be reached by March 1.  An already weak economy (GDP fell by 0.1% in the fourth quarter of 2012 largely due to government spending cuts in that quarter), will almost certainly be driven into decline if the sequester spending cuts happen.

Yet Republican leaders continue to assert big increases in government spending during Obama’s presidential term are the source of the economy’s problems.  A recent example was in the formal Republican response (by Senator Rubio of Florida) to Obama’s State of the Union address.  Rubio asserts that the rise in government under Obama is the cause of our weak economy, and that our problems would be solved by cutting government spending.  But government spending has not risen as he asserts.

B.  Government Consumption and Investment Expenditures

Government consumption and investment expenditures have in fact fallen during Obama’s presidential term.  It is the first such fall in 40 years.  And such government spending rose fastest in this period during the presidential terms of Reagan and George W. Bush.

The graph above shows the growth rates for government spending on consumption and investment as recorded in the National Income and Product Accounts (often referred to as the GDP accounts) published by the Bureau of Economic Analysis of the Department of Commerce.  Such government spending accounts for one component of GDP (along with private consumption, private investment, and exports less imports).  It encompasses all direct spending by government on goods and services, and does not include government transfer payments (which will be considered below).  We now have such data for the full four calendar years of Obama’s presidential term, and can compare the record during Obama’s term to that during previous presidential terms.

Earlier posts on this blog have noted that such fiscal spending has in fact been falling for much of Obama’s term, and that this has acted as a drag on the recovery (see here, here, here, and here).  The now complete data for the full four years of Obama’s first presidential term shows that such government spending fell sharply in both 2011 and 2012, and that while there was growth in 2009 with the stimulus package, the average rate of growth over the full four years of Obama’s term has been negative.  Such government spending is now less than when he took office.

This government spending (all figures in real, inflation adjusted, terms) fell at an average annual rate of 0.2% during Obama’s term.  This fall can be contrasted with the substantial increases during George W. Bush’s two terms, and the even larger increases during Reagan two terms.  (See the graph above, and the table at the bottom of this post provides the specific numbers.)  The only comparable performance to Obama in recent decades was the growth of close to zero during Clinton’s first term.  One would have to go back 40 years, to Nixon’s 1969-72 presidential term, before one again sees a fall in government spending as one had under Obama.  There was also a fall during Eisenhower’s first term, as spending fell sharply in 1954 and 1955 following the end of the Korean War in 1953.

It should be noted that there is certainly no reason to aim for zero growth of government spending over the long term.  Over the sixty years from 1952 to 2012, real GDP grew at a 3.0% annual rate, so real government spending could also grow at a 3.0% annual rate and leave the spending we do as a society for public goods such as infrastructure, education, defense, and so on, at a constant share of GDP.  And it is interesting to note that despite the Republican complaints on government spending, the only periods when government spending grew at a 3% rate or faster over the last 60 years were during the first George W. Bush term, the second Reagan term, the Kennedy/Johnson and Johnson terms, and almost the second Eisenhower term (growth then at a 2.8% annual rate).

The average rate of growth of government spending for goods and services over the full 60 year period was indeed only 1.9% a year in real terms, and hence such government spending as a share of GDP has fallen.  This is the fundamental reason our infrastructure is falling apart and our public services are so poor compared to that found elsewhere among the richer countries of the world.

C.  Total Government Spending, including Transfers

One can reasonably argue that a better measure of government spending is not simply that which enters directly into the GDP accounts (expenditures by government directly on goods and services), but which includes also expenditures by government on transfer payments.  Transfer payments are made by government to others, without goods or services provided in return.  They are mostly to households (such as for Social Security, Medicare and Medicaid, unemployment insurance, and similarly), but include also subsidies to corporate and business entities (such as for agricultural subsidies, energy subsidies, and similarly) as well as interest payments on public debt.  There are also significant transfer payments between levels of government (e.g. federal to state, federal to local, and state to local), but these are netted out for spending at all government levels (but federal transfers will be included when federal spending alone is discussed below).

By this measure as well, the rate of growth of government spending during the Obama term has been one of the lowest in decades:

Govt During Presidential Terms - Total Spending, 1953-2012The rate of growth of such government spending during Obama’s first term was just 1.5% a year, with absolute falls in 2011 and 2012.  This is well below the growth during the two terms of George W. Bush, the term of George H. W. Bush, and the two terms of Reagan.  And it is noteworthy that this slow overall growth in total government expenditures during Obama’s term was achieved despite the collapsing economy and resulting high unemployment that Obama inherited on taking office.  The collapsing economy Obama confronted automatically drove up expenditures on unemployment insurance, food stamps, and other safety net programs, all of which count as government transfer programs.  Hence (and along with spending from the stimulus package) there was a sharp peak in 2009, with this increase critical to stopping and then reversing the economic collapse.  But this was then followed by a sharp fall in government spending soon thereafter, which slowed the recovery.

The only comparable periods of such slow growth in total government spending in the last 60 years were during the two Clinton terms and the Nixon term, while such spending was flat during the first Eisenhower term, when Korean War spending ended.

D.  Federal Government Spending Only

The analysis so far has covered expenditures at all levels of government – federal, state, and local.  It is such expenditures which matter in terms of impact on the economy.  And consolidation makes sense as transfers from the federal level cover a substantial share of expenditures that are then carried out by state and local governments.  However, if one wants to focus more narrowly on government expenditures where the role of the president is more direct, then a case can be made to focus exclusively on expenditures at the federal level.  The president is still not omnipotent, as expenditures will depend on budgets passed by the Congress as well as on laws that established programs many years before (such as Social Security or Medicare) .  But the influence of the president will be more direct when focused on federal only expenditures.

Here again, growth in government expenditures during Obama’s term in office has been one of the lower ones of recent decades, and in particular well below the growth seen under Bush or Reagan.  First, for government direct spending on goods and services:

Govt During Presidential Terms - Fed only Cons & Invest, 1953-2012Such expenditures grew at an annual rate of 1.3% over Obama’s term, with out right reductions in 2011 and 2012.  In contrast, such expenditures grew at rates of 5.5% in George W. Bush’s first term and 2.9% in his second, and at rates of 4.6% in Reagan’s first term and 3.8% in his second.  Yet Republicans assert that Obama must be blamed for a rapid expansion in government spending over his term, while Reagan and Bush are praised for their promises to cut government.

In sharp contrast to the increases under Reagan and George W. Bush, federal government expenditures on consumption and investment were cut sharply during Clinton’s first term (at a rate of -2.9% a year), and were basically flat during Clinton’s second term.  There is no basis for the attack that such spending increases at explosive rates under Democrats.

One can similarly look at federal government total spending, including transfers (to households and businesses, and also here transfers from the federal level to the state or local levels):

Govt During Presidential Terms - Fed only Total Spending, 1953-2012

Here again, the growth under Obama has been moderate, with growth at a rate of just 2.7% a year, despite the consequences for mandated expenditures in programs such as unemployment insurance and food stamps that resulted from the economic collapse that Obama inherited.  And despite the weak economy (and indeed contributing importantly to that weakness), federal government total expenditures fell in 2011 and 2012.

Furthermore, growth in such expenditures were higher during the the two terms of George W. Bush, during the term of George H. W. Bush, and during the two terms of Reagan.  They were significantly slower during the two Clinton terms.  Here again, there is no basis for the assertion made by Republicans that Democrats are responsible for sharp growth in government spending, while the Republican presidents have kept it low.

E.  Conclusion

It is important to know the facts when making statements asserting that government spending has exploded under Obama, with this then asserted as the cause of the slow recovery.  In fact, the opposite is true, with government spending either falling during the term of Obama’s presidency or rising at a slower rate than seen in recent Republican presidential terms.  This has then diminished demand for goods and services, and hence has slowed a recovery where the problem is lack of demand to make use of currently underemployed resources (with high unemployment as well as low capital utilization rates).

What has been high in recent years is not government spending, but rather the fiscal deficits.  But these have been high due both to the 2008 economic collapse and slow recovery (which diminished tax revenues and raised certain government expenditures, such as for unemployment insurance), but more importantly to lower tax rates stemming from a series of tax cuts enacted over the last decade (starting with the Bush tax cuts of 2001 and 2003) and continuing into the Obama term.  The size and impact of these tax cuts were discussed in a previous posting on this blog.  These tax cuts reduced government revenues and, along with the impact of the downturn, account for most of the resulting fiscal deficit.  The problem is not high government spending, as government spending has either not grown or has grown only slowly.  The problem, rather, is low government revenue.

=====================================================

Table of Data, and Technical Notes

The specific numbers on four-year growth rates by presidential terms going back to Reagan are presented in the following table:

real average annual growth rates Obama Bush II Bush  I Clinton II Clinton I Bush Reagan II Reagan I
2009-12 2005-08 2001-04 1997-00 1993-96 1989-92 1985-88 1981-85
A)  All Levels of Govt
  1)  Direct Spending -0.2% 1.4% 3.0% 2.4% 0.2% 1.9% 4.2% 2.4%
  2)  Total Spending 1.5% 2.9% 3.1% 1.8% 1.2% 3.2% 3.7% 3.9%
B)  Federal Govt only
  1)  Direct Spending 1.3% 2.9% 5.5% 0.1% -2.9% 0.4% 3.8% 4.6%
  2)  Total Spending 2.7% 4.0% 4.0% 0.9% 0.8% 3.0% 3.0% 4.5%

Direct spending is all government spending directly on the purchases of goods and services.  Such spending is for either government consumption or for government investment, and is the government spending presented in the standard GDP accounts.  Government investment is in gross investment terms (i.e. estimated depreciation is not subtracted).  The price deflator used is as estimated by the BEA in the GDP accounts.

Total spending is direct spending by government on goods or services plus transfer payments.  Inter-governmental transfers (e.g. from the federal to the state level, state to local, or federal to local) are netted out in the figures for spending at all government levels together, but federal transfers to state or local governments are counted when federal only spending is calculated.  Transfer payments are mostly to households (such as for Social Security, Medicare, unemployment compensation, food stamps, and so on), but also include transfers to businesses (such as for agricultural subsidies and energy subsidies) and interest payments on public debt.  Since most are to households, these transfer payments were deflated using the personal consumption deflator estimated by the BEA in the GDP accounts.