

A. Introduction
The Washington region’s primary transit authority (WMATA, for Washington Metropolitan Area Transit Authority, which operates both the Metrorail system and the primary bus system in the region) desperately needs additional funding. While there are critical issues with management and governance which also need to be resolved, everyone agrees that additional funding is a necessary, albeit not sufficient, element of any recovery program. This post will address only the funding issue. While important, I have nothing to contribute here on the management and governance issues.
WMATA has until now been funded, aside from fares, by a complex set of financial contributions from a disparate set of political jurisdictions in the Washington metropolitan region (four counties, three municipalities, plus Washington, DC, the states of Maryland and Virginia, and the federal government, for a total of 11 separate political jurisdictions). Like for governments everywhere, budgets are limited. Not surprisingly, the decisions on how to share out the costs of WMATA are politically difficult, and especially so as a higher contribution by one jurisdiction, if not matched by others, will lead to a lower share in the costs by those others. And unlike most large transit systems in the US, WMATA depends entirely (aside from fares) on funding from political jurisdictions. It has no dedicated source of tax revenues.
This is clearly not working. Everyone agrees that additional funding is needed, and most agree that a dedicated funding source needs to be created to supplement the funds available to WMATA. But there is no agreement on what that additional funding source should be. There have been several proposals, including an increase in the sales tax rate in the region or a special additional tax on properties located near Metro stations, but each has difficulties and there is no consensus. As I will discuss below, there are indeed issues with each. They would not provide a good basis for funding transit.
The recommendation developed here is that a fee on commuter parking spaces would provide the best approach to providing the additional funding needed by the Washington region’s transit system. This alternative has not figured prominently in the recent discussion, and it is not clear why. It might be because of an unfounded perception that such a fee would be difficult to implement. As discussed below, this is not the case at all. It could be easily implemented as part of the property tax system that is used throughout the Washington region. It should be considered as an approach to raising the funds needed, and would perhaps serve as an alternative that could break the current impasse resulting from a lack of consensus for any of the other alternatives that have been put forward thus far.
Four factors need to be considered in any assessment of possible options to fund the transit systems. These are:
- Feasibility: Would it be possible to implement the option in practical terms? If it cannot be implemented, there is no point in considering it further.
- Effectiveness: Would the option be able to raise the amount of funds needed, with the parameters (such as the tax rates) at reasonable levels that would not be so high as to create problems themselves?
- Efficiency: Would the economic incentives created by the option work in the direction one wants, or the opposite?
- Fairness: Would the tax or option be fair in terms of who would pay for it? Would it be disproportionately paid for by the poor, for example?
This blog post will assess to what degree these four tests are met by each of several major options that have been proposed to provide additional funding to WMATA. A mandatory fee on parking spaces will be considered first, and in most detail. Many will call this a tax on parking, and that is OK. It is just a label. But I would suggest it should be seen as a fee on rush hour drivers, who make use of our roads and fill them up to the point of congestion. It can be considered similar to the fees we pay on our water bills – one would be paying a fee for using our roads at the times when their capacity is strained. But one should not get caught up in the polemics: Whether tax or mandatory fee, they would be a charge on the parking spaces used by those commuters who drive.
Other options then considered are an increase in the bus and rail fares charged, an increase in the sales tax rate on all goods purchased in the region, and enactment of a special or additional property tax on land and development close to the Metrorail stations in the region.
No one disputes that enactment of any of these taxes or fees or higher fares will be politically difficult. But the Washington region would collapse if its Metrorail system collapsed. Metrorail was until recently the second busiest rail transit system in the US in terms of ridership (after New York). However, Metrorail ridership declined in recent years, to the point that it was 17% lower in FY2016 than what it was in FY2010. The decline is commonly attributed to a combination of relatively high fares, lack of reliability, and the increased safety concerns of recent years, combined most recently with periodic shutdowns on line segments in order to carry out urgent repairs and maintenance. Despite this, Metrorail in 2016 was still the third busiest rail system in the country (just after Chicago).
But the Washington region cannot afford this decline in transit use. Its traffic congestion, even with Metro operating, is by various measures either the worst in the nation or one of the worst. Furthermore, the traffic congestion is not just in or near the downtown area. As offices have migrated to suburban centers over the last several decades, traffic during rush hour is now horrendous not simply close to the city center, but throughout the region. See, for example, this screen shot from a Google Maps image I took at typical weekday afternoon during rush hour (5:30 pm on Tuesday, April 18):
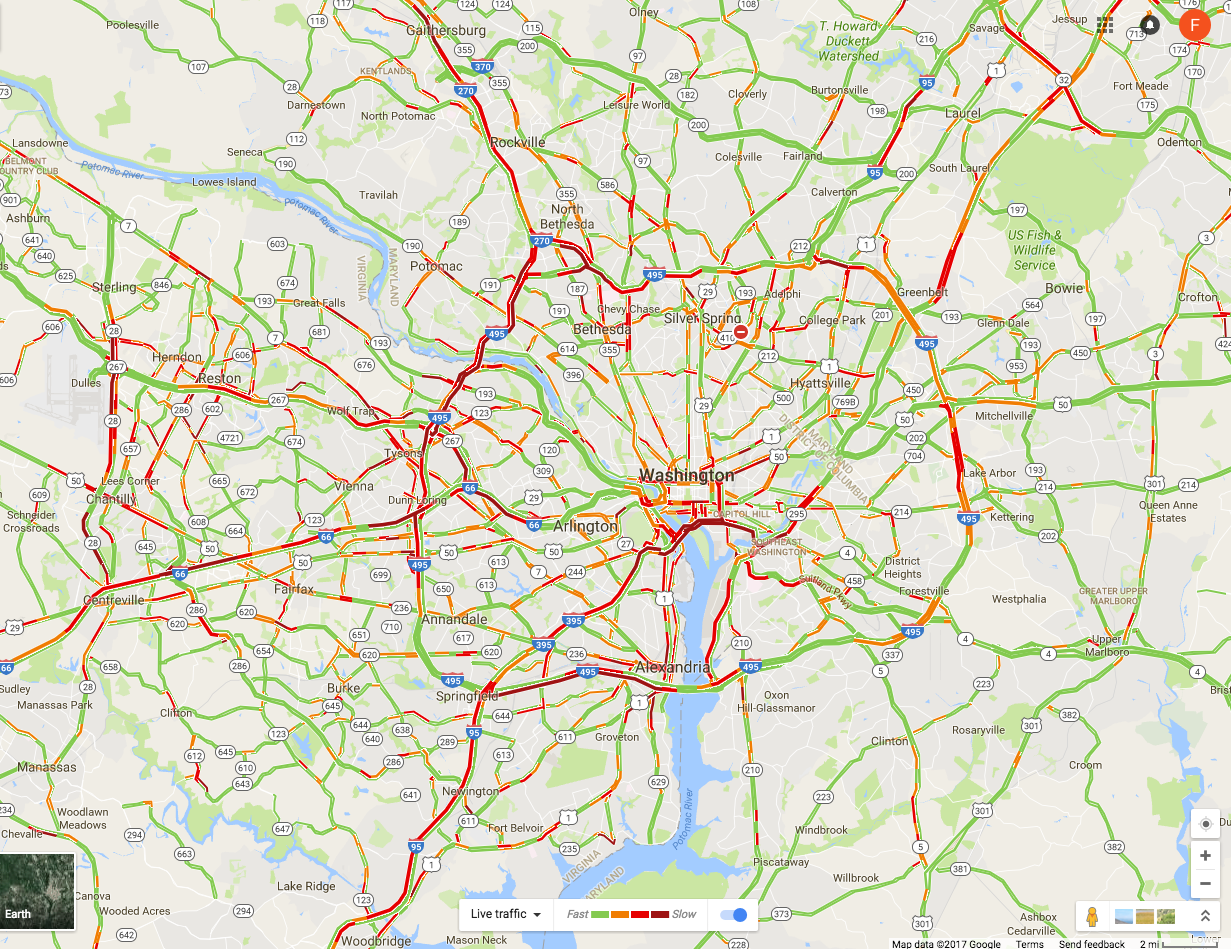
The roads shown in red have traffic backed up. The congestion is bad not simply around downtown, nor simply on the notoriously congested Capital Beltway as well, but also on roads at the very outer reaches of the suburbs. The problem is region-wide, and it is in the interest of everyone in the region that it be addressed.
A good and well-run transit system will be a necessary component of what will be needed to fix this, although this is just the minimum. And for this, it will be fundamental that there be a change in approach from a short-term focus on resolving the immediate crisis by some patch, to a perspective that focuses on how best to utilize, and over time enhance, the overall transportation system assets of the Washington region. This includes both the Metro system assets (where a value of $40 billion has been commonly cited, presumably based on its historical cost) but also the value of the highways and bridges and parking facilities of the region, with a cost and a value that would add up to far more. These assets are not well utilized now. A proper funding system for WMATA should take this into account. If it is not, one can end up with empty seats on transit while the roads are even more congested.
The first question, however, is how much additional funding is required for WMATA. The next section will examine that.
B. WMATA’s Additional Funding Needs
How much is needed in additional funding for WMATA? There is not a simple answer, and any answer will depend not only on the time frame considered but also on what the objective is.
To start, the FY18 budget for WMATA as originally drawn up in the fall of 2016 found there to be a $290 million gap between expenditures it considered to be necessary based on the current plans, and the revenues it forecast it would receive from fares (and other revenue generating activities such as parking fees at the stations and from advertising) and what would be provided under existing formulae from the political jurisdictions. This gap was broadly similar in magnitude to the gaps found in recent years at a similar stage in the process. And as in earlier years, this $290 million gap was largely closed by one-off measures that one could not (or at least should not) be used again. In particular, funds were shifted from planned expenditures to maintain or build up the capital assets of the system, to cover current operating costs instead.
Looking forward, all the estimates of the additional funding needs are far higher. To start, an analysis by Jeffrey DeWitt, the CFO of Washington, DC, released in October 2016 as part of a Metropolitan Washington Council of Governments (COG) report, estimated that at a minimum, WMATA faced a shortfall over the next ten years averaging $212 million per year on current operations and maintenance, and $330 million per year for capital needs, for a total of $542 million a year. This estimate was based on an assumption of a capital investment program summing to $12 billion over the ten years.
But the “10-Year Capital Needs” report issued by WMATA a short time later estimated that the 10-year capital needs of WMATA would be $17.4 billion simply to bring Metro assets up to a “state of good repair” and maintain them there. It estimated an additional $8 billion would be needed for modest new investments – needed in part to address certain safety issues. But even if one limited the ten-year capital program to the $17.4 billion to get assets to a state of good repair, there would be a need for an additional $540 million a year over the October 2016 DeWitt estimates, i.e. a doubling of the earlier figure to almost $1.1 billion a year.
A more recent, and conservative, figure has been provided by Paul Wiedefeld, the General Manager of WMATA, in a report released on April 19. He recommended that while Metro has capital needs totaling $25 billion over the next ten years, he would propose that a minimum of $15.5 billion be covered for the system “to remain safe and reliable”. Even with this reduced capital investment program, he estimated that if funding from the jurisdictions remained at historical levels, there would be a 10-year funding gap of $7.5 billion remaining. If jurisdictional funding were to rise at 3% a year in nominal terms, then he estimated that $500 million a year would still be necessary from some new funding source.
But this was just for the capital budget, and a highly constrained one at that. There would, in addition, be a $100 million a year gap in the operating budget, even with the funding from the jurisdictions for operations rising also at 3% a year. Wiedefeld suggested that it might be possible to reduce operating costs by that amount. However, this would require cutting primarily labor expenditures, as direct labor costs account for 74% of operating expenditures. Not surprisingly, the WMATA labor union is strongly opposed.
Even more recently, the Metropolitan Washington Council of Governments issued on April 26 the final report of a panel it convened (hereafter COG Panel or COG Panel Report) that examined Metro funding options. The panel was made up of senior local administrative and budget officials. While the focus of the report was an examination of different funding options (and will be discussed further below), it took as a basis of its estimated needs that WMATA would need to cover a ten-year capital investment program of $15.6 billion (to reach and maintain a “state of good repair” standard). After assuming a 3% annual increase in what the political jurisdictions would provide, it estimated the funding gap for the capital budget would sum to $6.2 billion. Assuming also a 3% annual increase in funding from the political jurisdictions for operations and maintenance (O&M), it estimated a remaining funding gap of $1.3 billion for O&M. The total gap for both capital and O&M expenses would thus sum to $7.5 billion over the period.
But while these COG estimates were referred to as 10-year funding gaps (thus averaging $750 billion per year), the table in its PowerPoint presentation on the report on page 13 makes clear that these are actually the funding gaps for the eight year period of FY19 to FY26. FY17 is already almost over, and the FY18 budget has already been settled. For the eight year period from FY19 going forward, the additional funding needed averages $930 million per year. The COG Panel recommended, however, a dedicated funding source that would generate less, at $650 million per year to start (which it assumes would be in 2019). But the reason for this difference is that the COG Panel recommended also that WMATA borrow additional funds in the early years against that new funding stream, so as to cover together the higher figure ($930 million on average per year over FY19-26) for what is in fact needed. While such borrowing would supplement what could be funded in the early years, the resulting debt service would then subtract from what one could fund later. While prudent borrowing certainly has a proper role, future funding needs will certainly be higher than what they are right now, and thus this will not provide a long-term solution to the funding issue. More funding will eventually (and soon) be required.
All these figures reviewed thus far assume capital investment programs only just suffice to bring existing assets up to a “state of good repair”, with nothing done to add to these assets. It also appears that the estimates were influenced at least to some extent by what the analysts thought might be politically feasible. Yet additional capacity will be needed if the Washington region is to continue to grow. While these additional amounts are much more speculative, there is no doubt that they are large, indeed huge.
The most careful recent study of long-term expansion needs is summarized in a series of reports released by WMATA in early 2016. A number of rail options were examined (mostly extensions of existing rail lines), with the conclusion that the highest priority for a 2040 time horizon was to enhance the capacity at the center of the system. Portions of these lines are already strained or at full capacity, including in particular the segment for the tunnel under the Potomac from Rosslyn. Under this plan, there would be a new circular underground loop for the Metro lines around downtown Washington and extending across the Potomac to Rosslyn and the Pentagon. It is not clear that a good estimate has yet been done on what this would cost, but the Washington Post gave a figure of $26 billion for an earlier variant (along with certain other expenditures). This would clearly be a multi-decade project, and if anything like it is to be done by 2040, work would need to begin within the current 10-year WMATA planning horizon. Yet given WMATA’s current difficulties, there has been little focus on these long-term needs. And nothing has been provided for them.
To sum up, how much in additional funding is needed? While there is no precise number, in part because the focus has been on the immediate crisis and on what might be considered politically feasible, for the purposes of this post we will use the following. At a minimum, we will look at what would be needed to generate $650 million per year, the same figure arrived at in the COG Panel Report. But this figure is clearly at the low end of the range of what will be needed. At best, it will suffice only for a few years. Our political leaders in the region should recognize that this will need to rise to at least $1 billion per year within a few years if necessary investments are to be made to ensure the system not only reaches a “state of good repair” but also sustains it. Furthermore, it will need to rise further to perhaps $2.0 billion a year by around 2030 if anything close to the system capacity that will be needed by 2040 is to be achieved.
For the analysis below, we will therefore look at what the rates will need to be to generate $650 million a year at the low end and roughly three times this ($2.0 billion a year in nominal terms, by the year 2030) at the high end. These figures are of course only illustrative of what might be required. And for the forecast figures for 2030, I will assume (consistent with what the COG Panel did) that inflation from now to then will rise at 2% a year while real growth in the region will rise, conservatively, at 1% a year. Note that $2.0 billion in 2030 in nominal terms would be equivalent to $1.55 billion in terms of dollars of today (2017) if inflation rises at 2% a year.
It is important to recognize that providing just the low-end figure of $650 million a year will not suffice for more than a few years. It does provide a starting point, and while that is important, when considering such a major reform as moving to a dedicated funding source to supplement government funding sources, one should really be thinking longer term. Not much would be gained by moving to a funding source which would prove insufficient after just a few years, leading to yet another crisis.
C. A Mandatory Fee on Commuter Parking Spaces
A fee would be assessed (generally through the property tax system) on all parking spaces used by office and other commuting employees. It would not be assessed on residential parking, nor on customer parking linked to retail or other such commercial space, but would be limited to the all-day parking spots that commuters use.
It would be straightforward to implement. The owners of the property with the parking spaces would be assessed a fee for each parking space provided. For example, if the fee is set at $1 per day per space, a fee of $250 per year would be assessed (based on 250 work-days a year, of 52 weeks at 5 days per week less 10 days for holidays). It would be paid through the regular property tax system, and collected from the owners of that land along with their regular property taxes on the semi-annual (or quarterly or whatever) basis that they pay their property taxes. The owners of the spaces would be encouraged to pass along the costs to those employees who drive and use the spaces (and owners of commercial parking lots will presumably adjust their monthly fees to reflect this), but it would be the owners of the parking spaces themselves who would be immediately liable to pay the fees.
Property records will generally have the number of parking spaces provided on those plots of land. This will certainly be so in the cases of underground parking provided in modern office buildings and in multi-story commercial parking garages. And I suspect there will similarly be such a record of the number of spaces in surface parking lots. But even if not, it would be straightforward to determine their number. Property owners could be required to declare them, subject to spot-checks and fines if they did not declare them honestly. One can now even use satellite images available on Google Maps to count such spaces. And a few years ago my water bills started to include a monthly fee for the square footage of impermeable space on my land (from roofs and driveways primarily), as drainage from such surfaces feed into stormwater drains and must ultimately be treated before being discharged into the Potomac river. They determined through the property records system and from satellite images the square footage of such spaces on all individual properties. If that can be done, one certainly determine the number of parking spaces on open lots.
There are, however, a few special cases where property taxes are not collected and where different arrangements will need to be made. But this can be done. Specifically:
- Properties owned by federal, state, and local governments will generally not pay property taxes. But the mandatory fees on parking spaces could still be collected by these government entities and paid into the system just as by private property owners. Presumably, the governments support the reform as it is supplementing the funds they already provide to WMATA.
- Similarly, international organizations located in the Washington region, such as the World Bank, the IMF, the Inter-American Development Bank, and others (mostly much smaller) operate under international treaties which provide that they do not owe property taxes on properties they own. But as with governments, they could collect such fees on parking spaces made available to their employees who drive to work. They already charge their employees monthly fees for the spaces, and the new fee could be added on. And while I am not a lawyer, it might well be the case that such a fee on parking spots could be made mandatory. The institutions do pay the fees charged for the water they use, and employees do pay sales taxes on the food they purchase in their cafeterias. Finally, these institutions advise governments to apply good policy. The same should apply here.
- There are also non-profit hospitals, universities, and similar institutions, which are major employers in the region but which may not be charged property taxes. However, the fee on parking spaces, while collected for most through the property tax system, can be seen as separate from regular property taxes. It is a fee on commuters who make use of our road system and add to its congestion. The parking fees could still be collected and paid in, even if no regular property taxes are due.
- Finally, the Washington region has a large number of embassies and other properties with strict internationally recognized immunities. It might well be the case that it will not be possible to collect such a mandatory fee on parking spots for their employees (although again, presumably the embassies pay the fees on their water bills). But the total number employed through such embassies is tiny as a share of total employment in the DC region. And some embassies might well pay voluntarily, recognizing that they too are members of the local community, making use of the same roads. Finally, note that embassy employees with diplomatic status also do not pay sales tax on their day-to-day purchases, while the embassy compounds themselves do not pay property taxes. Proposals to fund WMATA through new or higher property taxes or sales taxes (discussed below) will face similar issues. But as noted above, the amounts involved are tiny.
How, then, would such a mandatory fee on commuter parking spaces stand up under the four criteria noted above?:
a) Feasibility: As just discussed, such a fee on commuter parking spaces, implemented generally through the regular property tax system, would certainly be feasible. It could be done. It may well be that a lack of recognition of this which explains why such an option has typically not been much considered when alternatives are reviewed for how to fund a transit system such as WMATA. It appears that most believe that it would require some system to be set up which would mandate a payment each day as commuters enter their parking lots. But there is no need for that. Rather, the fee could be imposed on the owner of the parking space, and collected as part of their property tax payments. It would be up to the owner of that space to decide whether to pass along that cost to the commuters making use of those spaces (although passing along the cost should certainly be encouraged, so that the commuters face the cost of their decision to drive).
b) Effectiveness: The next question is whether such a fee, at reasonable rates, would generate the funds needed. To determine this, one first needs to know how many such parking spots there are in the Washington region. While more precise figures can be generated later, all that is needed at this point is a rough estimate.
As of January 2017, the Bureau of Labor Statistics estimated there were 3,217,400 employees in the Washington region’s Metropolitan Statistical Area (MSA). While this MSA area is slightly larger than the jurisdictions that participate in the WMATA regional compact, the additional counties at the fringes of the region are relatively small in population and employment. This figure on regional employment can then be coupled with the estimate from the most recent (2016) Metropolitan Washington COG “State of the Commute” survey, which concluded that 61.0% of commuters drive alone to work, while an additional 5.4% drive in either car-pools or van-pools. Assuming an average of 2.5 riders in car-pools and van-pools (van-pools are relatively minor in number), this would work out to 63.2% as the number of cars (as a share of total employment) that carry commuters to their jobs. Applying the 63.2% to the 3,217,400 figure for the number employed, an estimated 2,033,400 cars are used to carry commuters. The total number of parking spaces will be somewhat more, as the parking lots will normally have some degree of excess capacity, but this can be ignored for the estimate here. Rounding down, there are roughly 2 million parking spaces for these cars in the DC region. And this number can be expected to grow over time.
With 2 million parking spaces, a daily fee of $1 would generate $500 million per year (based on 250 work-days per year). A fee of $1.30 per day would generate $650 million. And assuming commuter parking spots grow at 1% a year (along with the rest of the regional economy) to 2030, a $3.50 fee in 2030 would generate $2.0 billion in the prices of that year (equivalent to $2.70 per day in the prices of 2017, assuming 2% annual inflation for the period).
Compared to the cost of driving, fees of $1.30 per day or even $3.50 per day are modest. While many workers do not pay for their parking (or for the full cost of their parking), the actual cost can be estimated by what commercial parking firms charge for their monthly parking contracts. For the 33 parking garages listed as “downtown DC” on the Parking Panda website, the average monthly fee (showing on April 29, 2017) was a bit over $270. This would come to $13 per work day (based on 250 work days per year). While the charges will be less in the suburbs, there will still be a cost. But the full cost to commuters to drive to work is in fact much more. Assuming the average cost of the cars driven is $36,000, and with simple straight line depreciation over 10 years, the average monthly cost will be $300. To this one should add the cost of car insurance (on the order of $50 to $100 per month), of expected repair costs (probably of similar magnitude), and of gas. The full cost of driving would on average then total over $600 per month, or about $29 per work day. Even if one ignores the cost of the parking spot itself (as drivers will if their employers provide the spots for free), the cost to the driver would still average about $16 per work day. An added $1.30 per day to cover the funding needs of the public transit system is minor compared to any of these cost estimates, and would still be modest at $3.50 per day (equal to $2.70 in the prices of today).
Thus at reasonable rates on commuter parking spots, it would be possible to collect the $650 million to $2.0 billion a year needed to help fund WMATA.
c) Efficiency: Another consideration when choosing how best to provide additional funds to WMATA is the impact on efficiency of that option. A fee on parking spaces would be a positive for this. The Washington region stands out for its severe congestion, including not only in the city center but also in the suburbs (and often even more so in the suburbs). A fee on parking spots, if passed along to the commuters who drive, would serve as an incentive to take transit, and might have some impact on those at the margin. The impact is likely to be modest, as a $1.30 to $3.50 fee per day would not be much. As just discussed above, given the current cost of driving (even when commuters who drive are not charged for their parking spots), an additional $1.30 to $3.50 would be only a small additional cost, even when it is passed along. But at least it would operate in the direction one wants to alleviate traffic congestion.
d) Fairness: Finally, the fee would be fair relative to the other options being considered in terms of who would be impacted. Those who drive to work (over 90% of whom drive alone) are generally of higher income. They can afford the high cost of driving, which is high (as noted above) even in those cases when they are provided free parking spaces by their employer.
Some would argue that since the drivers are not taking transit, they should not help pay for that transit. But that is not correct. First of all, they have a direct interest in reducing road congestion, and only a well-functioning transit system can help with that. Drivers benefit directly (by reduced congestion) for every would-be driver who decides instead to take transit. Second, all the other feasible funding options being considered for WMATA will be paid for in large part by drivers as well. This is true whether a higher sales tax is imposed on the region, higher property taxes, or just higher government funding from their budgets (with this funding coming from the income taxes as well as sales taxes and property taxes these governments receive). And as discussed below, higher fares on WMATA passengers to raise the amounts needed is simply not a feasible option.
Some drivers will likely also argue that they have no choice but to drive. While they would still gain by any reduction in congestion (and would lose in a big way due to extreme congestion if WMATA service collapses due to inadequate funding), it is no doubt true that at least some commuters have no alternative but to drive. However, the number is quite modest. The 2016 survey of commuters undertaken by the Metropolitan Washington COG, referred to also above, asked their sample of commuters whether there was either bus service or train service “near” their homes (“near” as they would themselves consider it), and separately, “near” their place of work. The response was 89% who said there were such transit services near their homes, and 86% who said there were such transit services near their places of work. But note also that the 11% and 14%, respectively, who did not respond that there was such nearby transit, included those who responded that they did not know. Many of those who drive to work might not know, as they never had a need to look into it.
The share of the Washington region’s population who do not have access to transit services is therefore relatively small, probably well less than 10% of commuters. The transit options might not be convenient, and probably take longer than driving in many if not most cases given the current service provision, but transit alternatives exist for the overwhelming share of the regional population. The issue is that those who can afford the high cost will drive, while the poorer workers who cannot will have no choice but to take transit. Setting a fee on parking spaces for commuters in order to support the maintenance of decent transit services in the region is socially as well as economically fair.
D. Alternative Funding Options That Have Been Proposed
1) Higher Fares: The first alternative that many would suggest for raising additional funds for the transit system is to charge higher fares. While certainly feasible in a mechanical sense, such an alternative would fail the effectiveness test. The fares are already high. Any increase in fares will lead to yet more transit users choosing to drive instead (for those for whom this is an option). The increase in fare revenues collected will be less than in proportion to the increase in fare rates set. And at some point, so many transit users will switch that total fare revenue would in fact decrease.
In the recently passed FY18 budget for WMATA, the forecast revenues to be collected from fares is $709 million. This is down from an expected $792 million in FY17 despite a fare increase averaging 4%. Transit users are leaving as fares have increased and service has deteriorated. To increase the fares to try to raise an additional $650 million would require an increase of over 90% if no riders then leave. But more riders would of course leave, and it is not clear if anything additional (much less an extra $650 million) would be raised. And this would of course be even more so if one tried to raise an extra $2.0 billion.
So as all recognize, it will not be possible to resolve the WMATA funding issues by means of higher fares. Any increase in fares will instead lead to more riders leaving the system for their cars, leading to even greater road congestion.
2) Increase the Sales Tax Rate: Mayor Muriel Bowser of Washington has pushed for this alternative, and the recent COG Technical Panel concluded with the recommendation that “the best revenue solution is an addition to the general sales tax in all localities in the WMATA Compact area in the National Capital Region” (page 4). This alternative has drawn support from some others in the region as well, but is also opposed by some. There is as yet no consensus.
Sales taxes are already imposed across the region, and it would certainly be feasible to add an extra percentage point to what is now charged. But each jurisdiction sets the tax in somewhat different ways, in terms of what is covered and at what rates, and it is not clear to what the additional 1% rate would be applied. For example, Washington, DC, imposes a general rate of 5.75%, but nothing on food or medicines, while liquor and restaurants are charged a sales tax of 10% and hotels a rate of 14.5%. Would the additional 1% rate apply only to the general rate of 5.75%, or would there also be a 1% point increase in what is charged on liquor, restaurants, and the others? And would there still be a zero rate on food and medicines? Virginia, in contrast, has a general sales tax rate (in Northern Virginia) of 6.0%, but it charges a rate on food of 2.5%. Would the Virginia rate on food rise to 3.5%, or stay at 2.5%? There is also a higher sales tax rate on restaurant meals in certain of the local jurisdictions in Virginia (such as a 10% rate in Arlington County) but not in others (just the base 6% rate in Fairfax County). How would these be affected? And similar to DC, there are also special rates on hotels and certain other categories. Maryland also has its own set of rules, with a base rate of 6.0%, a rate of 9% on alcohol, and no sales tax on food.
Such specifics could presumably be worked out, but the distribution of the burden across individuals as well as the jurisdictions will depend on the specific choices made. Would food be subject to the tax in Virginia but not in Maryland or DC, for example? The COG Technical Panel must have made certain assumptions on this, but what they were was not explained in its report.
But it concluded that an additional 1% point on some base would generate $650 million in FY2019. This is higher than the estimate made last October as part of the COG Panel work, where it estimated that a 1% point increase in the sales tax rate would raise $500 million annually. It is not clear what the underlying reasons were for this difference, but the recent estimates might have been more thoroughly done. Or there might have been differing assumptions on what would be included in the base to be taxed, such as food.
A 1% point rise in the sales tax imposed in the region would, under these estimates, then suffice to raise the minimum $650 million needed now. But to raise $1.0 billion annually, rising to $2.0 billion a few years later, substantial further increases would soon be needed. The amount would of course depend on the extent to which local sales of taxable goods and services grew over time within the region. Assuming that sales of items subject to the sales tax were to rise at a 3% annual rate in nominal terms (2% for inflation and 1% for real growth), and that one would need to raise $2.0 billion by 2030 (in terms of the prices of 2030), then the base sales tax rate would need to rise by about 2.2% points. A 6% rate would need to rise to 8.2%. A rate that high would likely generate concerns.
Thus while a sales tax increase would be effective in raising the amounts needed to fund WMATA in the immediate future, with a 1% rise in the tax rate sufficing, the sales tax rate would need to rise further to quite high levels for it to raise the amounts needed a few years later. Whether such high rates would be politically possible is not clear.
Also likely to be a concern, as the COG Panel itself recognized in its report, is that the distribution of the increased tax burden across the local jurisdictions would differ substantially from what these jurisdictions contribute now to fund WMATA, as well as from what it estimates each jurisdiction would be called on to contribute (under the existing sharing rules) to cover the funding gap anticipated for FY17 – FY26:
|
Funding Shares: |
FY17 Actual |
FY17-26 Gap |
From Sales Tax |
|
DC |
37.3% |
35.8% |
22.8% |
|
Maryland |
38.4% |
33.5% |
26.5% |
|
Virginia |
24.3% |
30.7% |
50.8% |
Source: COG Panel Final Report, pages 9 and 15.
If an extra 1% point were added to the sales tax across the region, 50.8% of the revenues thus generated would come from the Northern Virginian jurisdictions that participate in the WMATA compact. This is substantially higher than the 24.3% share these jurisdictions contributed in WMATA funding in FY17, or the 30.7% share they would be called on to contribute to cover the anticipated FY17-26 gap (higher than in just FY17 primarily due to the opening of the second phase of the Silver Line). The mirror image of this is that DC and Maryland would gain, with much lower shares paid in through the sales tax increase than what they are funding now. Whether this would be politically acceptable remains to be seen.
Use of a higher sales tax to fund WMATA needs would also not lead to efficiency gains for the transportation system. The sales tax on goods and services sold in the region would not have an impact on incentives, positive or negative, on decisions on whether to drive for your commute or to take transit. It would be neutral in this regard, rather than beneficial.
Finally, and perhaps most importantly, sales taxes are regressive, costing the poor more as a share of their income than what they cost the well-off. A sales tax rise would not meet the fairness test. Even with exemptions granted for foods and medicines, poor households spend a high share of their incomes on items subject to sales taxes, while the well-off spend a lower share. The well-off are able to devote a higher share of their incomes to items not subject to the general sale tax, such as luxury housing, or vacations elsewhere, or services not subject to sales taxes, or can devote a higher share of their incomes to savings.
Aside from the regressive nature of a sales tax, an increase in the sales tax to fund transit (and through this to reduce road congestion) will be paid by all in the region, including those who do not commute to work. It would be paid, for example, also by retirees, by students, and by others who may not normally make use of transit or the road system to get to work during rush hour periods. But they would pay similarly to others, and some may question the fairness of this.
An increase in the sales tax rate would thus be feasible. And while a 1% point rise in the rate would be effective in raising the amounts needed in the immediate future, there is a question as to whether this approach would be effective in raising the amounts needed a few years later, given constraints (political and otherwise) on how high the sales tax rate could go. The region would likely then face another crisis and dilemma as to how WMATA can then be adequately funded. There are also political issues in the distribution of the sales tax burden across the jurisdictions of the region, with Northern Virginia paying a disproportionate share. This would be even more of a concern when the tax rate would need to be increased further to cover rising WMATA funding needs. There would also be no efficiency gains through the use of a sales tax. Finally and importantly, a higher sales tax is regressive and not fair as it taxes a higher share of the income of the poor than of the well-off, as well as of groups who do not use transit or the roads during the rush hour periods of peak congestion.
3) A Special Property Tax Rate on Properties Near Metro Stations
Some have argued for a special additional property tax to be imposed on properties that are located close to Metro stations. The largest trade union at WMATA has advocated for this, for example, and the COG Technical Panel looked at this as one option it considered.
The logic is that the value of such properties has been enhanced by their location close to transit, and that therefore the owners of these more valuable properties should pay a higher property tax rate on them. But while superficially this might look logical, in fact it is not, as we will discuss below. There are several issues, both practical and in terms of what would be good policy. I will start with the practical issues.
The special, higher, tax rate would be imposed on properties located “close” to Metro stations, but there is the immediate question of how one defines “close”. Most commonly, it appears that the proponents would set the higher tax on all properties, residential as well as commercial, that are within a half-mile of a station. That would mean, of course, that a property near the dividing line would see a sharply higher property tax rate than its neighbor across the street that lies on the other side of the line.
And the difference would be substantial. The COG Technical Panel estimated that the additional tax rate would need to be 0.43% of the assessed value of all properties within a half mile of the DC area Metro stations to raise the same $650 million that an extra 1% on the sales tax rate would generate. It was not clear from the COG Panel Report, however, whether the higher tax of 0.43% was determined based on the value of all properties within a half-mile of Metro stations, or only on the base of all such properties which currently pay property tax. Governmental entities (including international organizations such as the World Bank and IMF) and non-profits (such as hospitals and universities) do not pay this tax (as was discussed above), and such properties account for a substantial share of properties located close to Metro stations in the Washington region. If the 0.43% rate was estimated based on the value of all such properties, but if (just for the sake of illustration; I do not know what the share actually is) properties not subject to tax make up half of such properties, then the additional tax rate on taxable properties that would be needed to generate the $650 million would be twice as high, or 0.86%.
But even at just the 0.43% rate, the increase in taxes on such properties would be large. For Washington, DC, it would amount to an increase of 50% on the current general residential property tax rate of 0.85%, an increase of 26% on the 1.65% rate for commercial properties valued at less than $3 million, and an increase of 23% on the 1.85% rate for commercial properties valued at more than $3 million. Property tax rates vary by jurisdiction across the region, but this provides some sense of the magnitudes involved.
The higher tax rate paid would also be the same for properties sitting right on top of the Metro stations and those a half mile away. But the locational value is highest for those properties that are right at the Metro stations, and then tapers down with distance. One should in principle reflect this in such a tax, but in practice it would be difficult to do. What would the rate of tapering be? And would one apply the distance based on the direct geographic distance to the Metro station (i.e. “as the crow flies”), or based on the path that one would need to take to walk to the Metro station, which could be significantly different?
Thus while it would be feasible to implement the higher property tax as a fixed amount on all properties within a half-mile (at least on those properties which are not exempt from property tax), the half-mile mark is arbitrary and does not in fact reflect the locational advantages properly.
The rate would also have to be substantially higher if the goal is to ensure WMATA is funded adequately by the new revenue source beyond just the next few years. Assuming, as was done above for the other options, that property values rise at a 3% rate over time going forward (due both to growth and to price inflation), the 0.43% special tax rate would raise $900 million by 2030. If one needed, however, $2 billion by that year for WMATA funding needs, the rate would need to rise to 0.96%. This would mean that residential properties within a half mile would be paying more than double the property tax paid by neighbors just beyond the half-mile mark (assuming basic property tax rates are similar in the future to what they are now, and based on the current DC rates), while commercial rates would be over 50% more. The effectiveness in raising the amounts required is therefore not clear, given the political constraints on how high one could set such a special tax.
But the major drawback would be the impact on efficiency. With the severe congestion on Washington region roads, one should want to encourage, not discourage, concentrated development near Metro stations. Indeed, that is a core rationale for investing so much in building and sustaining the Metro system. To the extent a higher property tax discourages such development, the impact of such a special property tax on real estate near Metro stations would be to discourage precisely what the Metro system was built to encourage. This is perverse. One could indeed make the case that properties located close to Metro stations should pay a lower property tax rather than a higher one. I would not, as it would be complex to implement and difficult to explain. But technically it would have merit.
Finally, a special additional tax on the current owners of the properties near Metro stations would not meet the fairness test as the current owners, with very few if any exceptions, were not the owners of that land when the Metro system locations were first announced a half century ago. The owners of the land at that time, in the 1960s, would have enjoyed an increase in the value of their land due to the then newly announced locations of the Metro stations. And even if the higher values did not immediately materialize when the locations of the new Metro system stations were announced, those higher values certainly would have materialized in the subsequent many decades, as ownership turned over and the properties were sold and resold. One can be sure the prices they sold for reflected the choice locations.
But those who purchased that land or properties then or subsequently would not have enjoyed the windfall the original owners had. The current owners would have paid the higher prices following from the locational advantages near the Metro stations, and they are the ones who own those properties now. While they certainly can charge higher rents for space in properties close to the Metro stations, the prices they paid for the properties themselves would have reflected the fact they could charge such higher rents. They did not and do not enjoy a windfall from this locational advantage. Rather, the original owners did, and they have already pocketed those profits and left.
Note that while a special tax imposed now on properties close to Metro stations cannot be justified, this does not mean that such a tax would not have been justified at an earlier stage. That is, one could justify that or a similar tax that focused on the initial windfall gain on land or properties that would be close to a newly announced Metro line. When new such rail lines are being built (in the Washington region or elsewhere), part of the cost could be covered by a special tax (time-limited, or perhaps structured as a share of the windfall gain at the first subsequent arms-length sale of the property) that would capture a share of the windfall from the newly announced locations of the stations.
An example of this being done is the special tax assessments on properties close to where the Silver Line stations are being built. The Silver Line is a new line for the Washington region Metro system, where the first phase opened recently and the second phase is under construction. A special property tax assessment district was established, with a higher tax rate and with the funds generated used to help construct the line. One should also consider such a special tax for properties close to the stations on the proposed Purple Line (not part of the WMATA system, but connected to it), should that light rail line be built. The real estate developers with properties along that line have been strong proponents of building that line. This is understandable; they would enjoy major windfall gains on their properties if the line is built. But while the windfall gains could easily be in the hundreds of millions of dollars, there has been no discussion of their covering a portion of the cost, which will sum to $5.6 billion in payments to the private contractor to build and then operate the line for 30 years. Under current plans, the general taxpayer would be obliged to pay this full amount, with only a small share of this (less than one-fourth) recovered in forecast fares.
While setting a special (but temporary) tax for properties close to stations can be justified for new lines, such as the Silver Line or the Purple Line, the issues are quite different for the existing Metro lines. Such a special, additional, tax on properties close to the Metro stations is not warranted, would be unfair to the current owners, and could indeed have the perverse outcome of discouraging concentrated development near the Metro stations when one should want to do precisely the reverse.
4) Other Funding Options
There can, of course, be other approaches to raising the funds that WMATA needs. But there are issues with each, they in general have few advocates, and most agree that one of the options discussed above would be preferable.
The COG Technical Panel reviewed several, but rejected them in favor of its preference for a higher sales tax rate. For example, the COG Panel estimated that it would be possible to raise their target for WMATA funding of $650 million if all local jurisdictions raised their property tax rates by 0.08% of the assessed values on all properties located in the region. But general property taxes are used as the primary means local jurisdictions raise the funds they need for their local government operations, and it would be best to keep this separate from WMATA funding. The COG Panel also considered the possibility of creating a new Value-Added Tax (or VAT), a tax that is common elsewhere in the world but has never been instituted in the US. It is commonly described as similar to a sales tax, but is imposed only on the extra value created at each stage in the production and sale process. But it would be complicated to develop and implement any new tax such as this, and it also has never been imposed (as far as I am aware) on a regional rather than national basis. A regional VAT might be especially complicated. The COG Panel also noted the possibility of a “commuter tax”. Such a tax would have income taxes being imposed on a worker based on where they work rather than where they live. But since there would be an offset for any such taxes against what the worker would otherwise pay where they are resident, the overall revenues generated at the level of the region as a whole would be essentially nothing. It would be a wash. There is also the issue that Congress has by law prohibited Washington, DC, from imposing any such commuter tax.
The COG Panel also looked at the imposition of an additional tax on motor vehicle fuels (gasoline and diesel) sold in the region. This would in principle be more attractive as a means for funding transit, as it would affect the cost of commuting by car (by raising the cost of fuel) and thus might encourage, at the margin, more to take transit and thus reduce congestion. Fuel taxes in the US are also extremely low compared to the levels charged in most other developed countries around the world. And federal fuel taxes have not been changed since 1993, with a consequent fall in real, inflation-adjusted, terms. There is a strong case that the rates should be raised, as has been discussed in an earlier post on this blog. But such fuel taxes have been earmarked primarily for road construction and maintenance (the Highway Trust Fund at the federal level), and any such funds are desperately needed there. It would be best to keep such fuel taxes earmarked for that purpose, and separated from the funding needed to support WMATA.
E. Summary and Conclusion
All agree that there is a need to create a dedicated source of funds to provide additional funds to WMATA. While there are a number of issues with WMATA, including management and governance issues, no one disagrees that a necessary element in any solution is increased funding. WMATA has underinvested for decades, with the result that the current system cannot operate reliably or safely.
Estimates for the additional funding required by WMATA vary, but most agree that a minimum of an additional $650 million per annum is required now simply to bring the assets up to a minimum level of reliability and safety. But estimates of what will in fact be needed once the current most urgent rehabilitation investments are made are substantially higher. It is likely that the system will need on the order of $2 billion a year more than what would follow under current funding formulae by the end of the next decade, if the system’s capacity is to grow by what will be necessary to support the region’s growth.
A mandatory fee on parking spaces for all commuters in the region would work best to provide such funds. It would be feasible as it can be implemented largely through the existing property tax system. It would be effective in raising the amounts needed, as a fee equivalent to $1.30 per day would raise $650 million per year under current conditions, and a fee of $3.50 per day would raise $2 billion per year in the year 2030. These rates are modest or even low compared to what it costs now to drive.
A mandatory fee on parking spaces would also contribute to a more efficient use of the transportation assets in the region not only by helping to ensure the Metro system can function safely and reliably, but by also encouraging at least some who now drive instead to take transit and hence reduce road congestion. Finally, such a fee would be fair as it is those of higher income who most commonly drive (in part because driving is expensive), while it is the poor who are most likely to take transit.
An increase in the sales tax rate in the region would not have these advantages. While an increase in the rate by 1% point was estimated by the COG Panel to generate $650 million a year under current conditions, the rate would need to increase by substantially more to generate the funds that will be needed to support WMATA in the future. This could be politically difficult. The revenues generated would also come disproportionately from Northern Virginia, which itself will create political difficulties. It would also not lead to greater efficiencies in transport use, other than by keeping WMATA operational (as all the options would do). Most importantly, a sales tax is regressive (even when foods and medicine are not taxed), with the poor bearing a disproportionate share of the costs.
A special property tax on all properties located a half mile (or whatever specified distance) of existing Metro stations could also be imposed, although readily so only on such properties that are currently subject to property tax. But there would be arbitrariness with such a rigidly specified distance being imposed, with a sharp fall in the tax rate for properties just across that artificial border line. There is also a question as to whether it would be politically feasible to set the rates to such high rates as would be necessary as to address the WMATA funding needs of beyond just the next few years.
But most important, such a special tax on the current owners would not be a tax on those who gained a windfall when the locations of the Metro stations were announced many decades ago. Those original owners have already pocketed their windfall gains and have left. The current owners paid a high price for that land or the developments on them, and are not themselves enjoying a special windfall. And indeed, a new special property tax on developments near the Metro stations would have the effect of discouraging any such new investment. But that is the precise opposite of what we should want. The policy aim has long been to encourage, not discourage, concentrated development around the Metro stations.
This does not mean that some such special tax, if time-constrained, would not be a good choice when a new Metro line (or rail line such as the proposed Purple Line) is to be built. The owners of land near the planned future Metro stops would enjoy a windfall gain, and a special tax on that is warranted. Such a special tax district has been set for the new Silver Line, and would be warranted also if the Purple Line is to be built. Those who own that land will of course object, as they wish to keep their windfall in full.
To conclude, no one denies that any new tax or fee will be controversial and politically difficult. But the Metro system is critical to the Washington region, and cannot be allowed to continue to deteriorate. Increased funding (as well as other measures) will be necessary to fix this. Among the possible options, the best approach is to set a mandatory fee that would be collected on all commuter parking spaces in the region.


You must be logged in to post a comment.