
A. Introduction
This post will present a reform which would create an attractive, and wholly voluntary, new retirement savings option, which would also fund the US Social Security system for an additional generation. And it would do this without cuts in benefits or increases in Social Security or other taxes. While not a permanent fix for funding Social Security (where the issue is fundamentally a result of longer life expectancies but a largely unchanged work life), it could extend the lifetime of the Social Security Trust Fund without reducing benefits or increasing taxes by a further two decades or more.
Social Security is the most successful US social program of the last century. The poverty rate of the elderly was extremely high before Social Security. Because of Social Security it is now greatly reduced, to levels similar to that of other population groups. While the benefits Social Security pays are not generous, and are far below the support provided to the elderly among the other advanced economies of Europe, Japan, and elsewhere, Social Security benefits have been sufficient to provide a minimum safety net of income that has been adequate to keep most elderly out of poverty.
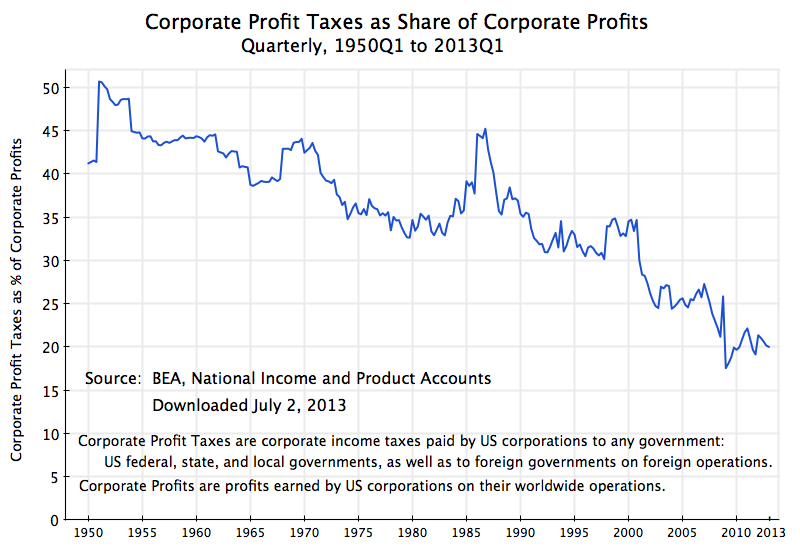
But there is a need to ensure Social Security will remain sustainable. As shown in the graph above, annual Social Security benefits paid exceed the inflow from Social Security taxes. While there is a Trust Fund, and it is currently a sizable 17% of GDP, the Congressional Budget Office projects that if nothing is done, this Trust Fund will run down to zero by 2035.
At that time, and if one restricts the options to the current structure, either Social Security tax revenues would need to be scaled up (by about 23%, raising the tax rate on wages from the current 12.4% to about 15.2%, if nothing is done prior to that point to prepare for it), or benefits would have to be scaled back (not to zero, but by about 19% in the CBO forecast). Raising the tax rate to 15.2% is not a disaster, and simply reflects the very desirable longer life expectancies we now enjoy. And such a wage tax would still be far less than the rates paid in Europe.
One could also cover the roughly 1% of GDP deficit in the flows (from the 2030s to about 2060) from general tax revenues. There is no requirement that all the support to the Social Security system has to come from wage taxes. And this 1% of GDP is only about one-third to one-quarter or less (the loss rises over time) of the revenues that have been lost as a result of extending the Bush tax cuts for all but the top 2% of Americans. If we can afford the Bush tax cuts being extended, we can afford one-third or one-quarter of it to save Social Security.
But any tax increases are anathema to Republicans. In this blog post, I will review a different type of approach, which would create an attractive and wholly voluntary new retirement savings option. As an additional benefit, it would provide funding for Social Security that would likely suffice to extend the life of the Social Security Trust Fund by a further two decades or more, without resorting to higher taxes or cuts in benefits.
B. The Impact of Investment Fees
Social Security is an extremely efficient program. Its administrative costs in the retirement program side (keeping the benefits for the disability program separate) are only 0.6% of the amount paid out annually in benefits (see 2012 Trustees Report, Table II.B.1.). This is tiny. Social Security is efficient for two primary reasons. The most important is that it is structured as a simple program. Revenues are collected through the tax system by a tax on wages, and these funds are then invested straight into (and only into) US Treasury bonds. Second, it operates on an enormous scale, and such a scale while keeping costs low is possible precisely because of the simplicity of the design.
In contrast, retirement accounts that are run through private fund managers are highly fragmented, are structured with multiple investment options where choices must then be made on how much to invest in each, where expensive financial professionals demand high fees to administer these funds and to make recommendations (and sometimes decisions) on the investment choices, and where the high fragmentation inhibits scale economies. Profits among the fund management companies can also be high.
As a consequence, the total fees on 401(k)’s, IRAs, and similar directed retirement investment programs (defined contribution schemes) can be extremely high. The fees are assessed at several levels, including (for 401(k)’s) at the level of the individual plan for some firm, and at the level of the investment management company (whether through a mutual fund, through investment vehicles sold by life insurance companies, or by direct investments in the markets). The fees add up, and can easily reach 2% of assets annually and beyond, depending on the size of the company one is working for, and the nature of the investments being made (whether equities, bonds, life insurance company products, money market funds, and so on).
These high fees have a dramatic impact on reducing the returns on the investments being made. Taking the example of a pure equity investment, the total return on investment in the S&P500 Equity Index over the 50 years 1962-2012 was 9.7% annually (in nominal terms). Adjusting for CPI inflation of 4.1% annually over this period, the real return was 5.4% (note that the 5.4% is not a simple subtraction of 4.1% from the 9.7% due to interaction effects: take my word for this, or review your High School algebra). But after a 2.0% annual fee on assets, the return would be reduced from 5.40% to only 3.31% for someone who starts saving for retirement at age 45 and lives to 92 (or 3.30% for someone who starts saving at age 22). In contrast, the Social Security administrative cost of 0.6% on benefit returns paid out would reduce a 5.40% pre-expense return to a 5.37% return after expenses for those who start saving at age 45 (or 5.38% for those who start at age 22). [The figures here come from a spreadsheet analysis by the author.]
The difference in returns after fees is huge. A 2% fee on assets is close to 100 times the equivalent cost (in terms of return on assets) of the Social Security cost of 0.6% on benefits paid out. Put another way, the 2% fee charged by the private fund managers reduces the return that would have been earned on equity investments by close to 40% (i.e. reducing a $100 return to only $60) while the Social Security charge would have reduced the return by only 0.5% (from $100 to $99.50).
The proposal set out here is to take advantage of this far greater efficiency of the Social Security system, by allowing Social Security to offer an optional retirement savings vehicle, into which Americans can invest a portion or even all of the investments now in their IRA, 401(k), or similar retirement savings plans. The savings accrued in this way would then provide an individual supplement to your regular Social Security check once you retire. Taking advantage of this would be completely voluntary. The funds would be invested, like all current Social Security funds are now invested, in long-term US Treasury bonds. Because of the inherent low costs in the Social Security system, the returns would be attractive.
C. The Proposal: A Supplemental Social Security Account
Most Americans (among those with any retirement plan coverage at their place of work) have seen their pension plans shift over recent decades from the traditional defined benefit plan to defined contribution schemes, mainly 401(k)’s. From almost nothing prior to the 1980s, over 80% of private sector workers now who have any pension plan coverage, only have a defined contribution plan. All workers may also have IRA’s, which are similar in magnitude (in terms of total assets) as what are held in 401(k)’s and similar plans, although the IRA assets primarily come from roll-over of 401(k) investments when a worker switches jobs.
In IRA’s, 401(k)’s, and similar defined contribution schemes, the workers must choose what investments to place their assets in. There may be restrictions on the choices (e.g. many companies will limit the investments to certain mutual funds with whom they have contracted), but the aim is generally to provide a reasonable range of choices to the individual. Unfortunately, all the choices come with high fees, which as discussed above, can severely reduce the investment returns.
The proposal here is to add the option of investing one’s IRA, 401(k), or similar plan assets into a supplemental Social Security account. An individual would be allowed to choose to invest some, or even all, of their existing assets or any new savings set aside annually (up to the limits set by tax law for retirement savings that benefit from specified tax advantages) into such a supplemental Social Security account. These funds would be invested, like all funds in the Social Security Trust Fund, in long-term US Treasury bonds. Social Security would keep track of the contributions so made, and of the earnings from the interest on the US Treasury bonds (it would be a simple computer code). Upon retirement and when the individual chooses to start to draw their regular Social Security benefit (normally at age 66 currently, although with this moving up to 67, and where there is some flexibility around these ages with the Social Security payments adjusted accordingly), Social Security would then increase the individual’s monthly Social Security benefit payment by an amount that would reflect the accumulated savings (including interest) in that supplemental Social Security account. The accumulated savings would be converted into an actuarially fair annuity, reflecting the then expected life expectancy for an individual at that retirement age.
Note that the interest which would be paid into these accounts would come from the US Treasury. But there would be no additional cost to the US Treasury since the bonds sold into these accounts would be offset by an equal number which would not then need to be sold to others, whether rich people who buy such bonds or the Chinese government, or whomever.
Set up on an actuarial fair basis, and with the relatively tiny Social Security administrative costs (of 0.6% of benefits paid) taken out, as for all Social Security payments, there would be no net cost to Social Security either. And each individual (on an actuarial basis) would receive back by the time they die an amount equal to what they saved under this scheme, plus the interest earned on these assets.
But while each individual would end up even, there would be a significant amount invested in and supplementing the traditional Social Security Trust Fund at any point in time. The Supplemental Social Security Fund would initially build up rapidly, as once the scheme is enacted, many people (all current workers) could begin to contribute to their new supplemental Social Security accounts, while only after such contributions have been made and with some time lag would there be retirees drawing down on their accounts. We will present some projections below, and see that the new Supplemental Fund would eventually stabilize as a share of GDP, and would not decline.
But first we will discuss whether individuals would find investing into such Supplemental Social Security accounts attractive, and then discuss what the scale of the investments into such accounts might be, given the size of total retirement savings going each year into IRA’s and 401(k)’s.
D. Investing Into Supplemental Social Security Accounts Would Be Attractive
It is of course impossible to predict what future returns will be. But what can look at what the returns have been for periods in the past, and it is reasonable to conclude that for sufficiently long periods, the returns will likely be similar (or at least the relative returns across different asset classes will be similar, and that is what is relevant to an individual’s decision on asset allocations).
For the numbers here, I have looked at the 50 year returns for 1962 to 2012, using the data assembled by Professor Aswath Damodaran of NYU. As noted above, adjusting for inflation (based on the CPI) over this fifty year period, an investment in the S&P 500 equity index would have yielded an annual real return of 5.4% (including dividends). An investment in 10-year US Treasury bonds over this period would have yielded an annual real return of 2.6%. And while it appears that data on actual returns people have achieved on average in their 401(k)’s or IRA’s do not exist (such data would be hard to collect, as most individuals do not even know what their actual returns, net of additions to their accounts, really were), one can calculate what an average 401(k) return might have been based on a weighted average of what returns might have been by asset classes held in these accounts currently. Using Investment Company Institute estimates of the 2011 weights, and applying these weights to the 50 year returns by asset classes, the weighted average 401(k) return would have been 3.7% in real terms.
Subtracting what fees could be on such investments, the net returns would have been:
| 1962-2012 |
S&P500 |
Avg 401(k) |
10-Year Treasury Bond |
| Gross Real Returns, before fees |
5.4% |
3.7% |
2.6% |
|
|
|
|
| Private Return after fee of: |
|
|
|
| 2.65% |
2.6% |
|
|
| 2.0% |
3.3% |
1.7% |
0.6% |
| 1.5% |
|
2.2% |
1.1% |
| 1.0% |
|
2.7% |
1.6% |
|
|
|
|
| Social Security Return: |
|
|
2.6% |
With the very low costs of the efficient Social Security system, one would have earned a real return of 2.6% a year over this period, equal (within round-off) to the returns on the 10-Year Treasury bonds these funds would have been invested in. The before fee return on equity investments would have been higher, at 5.4%, but with a 2% fee on assets incurred annually, the net return would have come down to 3.3%. With a 2.65% fee (and some 401(k) plans cost more than even this), the return would have been 2.6%. And while a 3.3% return is better than a 2.6% return, the equity return is much more volatile. One’s returns will depend on the luck of the period during which one was invested, which will depend on the year you were born. And there can be periods of a decade or more when the equity returns are even negative. This has happened three times in the US since the 1920s: during the 1930s in the Depression, in 1974/75 during Nixon/Ford, and following the 2008 economic and financial collapse at the end of the Bush administration.
Most people therefore do not hold solely equities in their 401(k)’s or IRA’s. In addition to equities, they hold bond funds, mixed bond and equity funds, money market funds, as well as contracts guaranteeing some stable return (usually issued by life insurance companies, and with normally very high fees). As discussed above, an estimate of what the weighted average return might have been yields 3.7% (based on 2011 weights, but 1962-2012 returns for the asset classes). The estimate can only be approximate. But based on it, the returns after fees would have been only 1.7% at a fee of 2.0%, 2.2% at a fee of 1.5%, and 2.7% at a fee of 1.0%. Most 401(k) plans will charge fees substantially higher than 1.0% (when all the layers of fees are accounted for), but it is only at this low rate that one would get a return similar to what one would get by investing into a supplemental account at Social Security.
The return on a supplemental account at Social Security therefore looks attractive. One should expect that if such an option were made available, Americans would choose to invest a significant portion of their retirement assets into such an account, and possibly even all of their retirement assets. The returns would be secure, relatively stable, and simple to manage.
E. What Might Be the Level of Such Investments in the Aggregate?
The next issue to address is how much such investments might add up to. One needs this in order to calculate what the impact might be on the size of the Social Security Trust Fund.
The truth is that one does not really know. An option might be attractive, but few then sign up, or many do. The numbers that will follow here are therefore speculative. But they will provide some sense of the magnitudes involved.
Due to tax and other reporting requirements, there are good numbers on the stock of assets in IRA’s, 401(k)’s, and similar defined contribution (and other) pension plans. These figures largely come from the US Federal Reserve Board Flow of Funds estimates, but are buried there with much other data, and a more convenient source of the retirement plan assets are provided by the Investment Company Institute. As of the end of 2012, the ICI estimates total assets held in IRA’s came to $5.4 trillion, and total assets in defined contribution plans (mainly 401(k)’s, but also others) came to $5.1 trillion. These two categories together thus came to $10.5 trillion of assets, 67% of 2012 GDP, that are invested according to the directions of individuals. Total pension fund assets, primarily in defined contribution plans (including plans for government workers) and annuities, but excluding Social Security, came to $19.5 trillion as of the end of 2012, or 124% of 2012 GDP.
But while good figures are available on total assets in these plans, they are more sparse on annual flows into the plans. Figures are available on IRA’s, where over the ten year period 1998 to 2008 (where 2008 is the most recent year available) gross new flows, including new contributions and from roll-overs, averaged a bit over $280 billion per year in the ICI numbers. Assuming similar flows into 401(k)’s and other such defined contribution plans, but scaled to reflect their slightly smaller size ($5.1 trillion vs. $5.4 trillion), it would be reasonable to assume about $270 billion is flowing annually into such plans. The two together would then be $550 billion a year, or about 3.5% of GDP.
One can only then guess what share of such flows might be attracted into the Supplemental Social Security accounts being discussed here. With roughly a third of 401(k) assets in bond funds, and a further 9% in short term investments (mainly money market funds), it might be reasonable to assume that perhaps 30% of new flows into IRA’s 401(k)’s, and similar plans, would be attracted to Supplemental Social Security accounts. Such accounts would be similar in nature to bond and money market investments, but with significantly greater returns due to the far lower investment fees of Social Security, combined with lower risk and greater security as these investments would be in US Treasuries.
While the 30% share is a guess, it is a reasonable bench-mark. The actual flows could turn out to be significantly higher (particularly as an attractive new low-cost retirement savings option such as this might well lead to higher savings going into IRA’s and 401(k)’s), but it could also be lower. A 30% share of $550 billion in annual flows would come to a little over 1% of GDP.
F. Impact on the Social Security Trust Fund
Rounding down, I calculated what the impact would be assuming initial flows equal to 1% of GDP, and with the new retirement savings option entering into effect in 2015. One then also needs, for the period of the projection (now to 2086), estimates of GDP growth, population growth, and real wage growth. I used the projections made by the CBO for their long term Social Security projections, cited above, where over this period real GDP would grow at an annual average rate of 2.25%, and population would grow at an annual average rate of 0.58%. I assumed real wages would on average grow at the rate of per capita GDP, or 1.66% annually. Real wages have grown at a slower rate than per capita GDP since the 1980s and the Reagan “revolution” (as was presented and discussed in this earlier post on this blog), but it is assumed this cannot go on forever. Finally one needs for the projections an assumption on the return to investments in long-term US Treasuries. For this I assumed that the returns going forward would match the 2.6% real return of the 50 year period 1962-2012.
The spreadsheet then calculated the savings going into the Supplemental Social Security accounts of each age group, changing over time based on real wage growth and population growth. I assumed workers would retire at 67, begin work at 22, and die at 92 (on average), with the savings converted into an annuity upon retirement at 67 with level payments (but reflecting accumulation at the real rate of interest of 2.6% on the assets in the accounts). Note that the life expectancy of an assumed 92 is the life expectancy of someone who has reached the age of 67, and not the life expectancy at birth. And while this life expectancy is less than 92 now, the projections are very long term, and were kept simple in part by not including variable life expectancies.
Each individual would then accumulate assets in the accounts, from savings plus the interest earned, until age 67, and would then draw down the accumulated assets through an actuarially fair annuity which would pay out a fixed amount (in real terms) each year until they die (which on average was assumed to be age 92). For each individual, the amount paid in, including accrued interest, would then match the amount paid out. But there would be a positive balance in the Supplemental Social Security Trust Fund accounts at any point in time, which would supplement the traditional Social Security Trust Fund. The traditional Social Security Trust Fund would remain unchanged.
The resulting path of the new Supplemental Fund would be as follows:

The Supplemental Fund would at first grow, both in real terms and as a share of GDP, as initially all the age groups would be paying into the accounts while no one would be taking out funds until time had passed. The amounts being taken out would then grow over time. With the constant growth rates being assumed for GDP, real wage growth, and population growth, and the return of 2.6% in real terms on the investments, it is perhaps not surprising that the Supplemental Fund rises as a share of GDP and then flattens out. From about 2055 onwards (40 years from the start), it would remain constant at about 24% of GDP. And it is important to note that the Supplemental Fund would not decline as a share of GDP, but remain flat.
The traditional Social Security Trust Fund is projected to decline, due to the annual negative net cash flows shown in the graph at the top of this post, and will reach zero in 2035 according to the CBO projections. It would continue to fall, and at an increasing rate over time (due to interest on what would then be negative assets) if nothing is done to make up for the annual shortfall. The Supplemental Fund would not affect this path. However, the Supplemental Fund would provide funding to the Social Security system, and when combined with the traditional Social Security Trust Fund, the overall fund would not now fall to zero until about 2058. That is, it would extend the life of the Social Security Trust Fund by about a generation (23 years) before Social Security taxes or some other taxes would need to be raised to provide the scheduled benefits to Social Security recipients.
G. Conclusion
The Supplemental Social Security accounts would be completely voluntary and would present an attractive option for retirement savings due to the low cost and high efficiency of the Social Security system. It would also provide funding to the Social Security system which would extend the life of the Social Security Trust Fund, before something would need to be done, by a generation. And the Supplemental Fund would not build up and then come down, putting additional stress on the Social Security system, but would rather build up to about 24% of GDP (under the assumptions made above) and then stay there.
The Supplemental Social Security accounts would also not be a Ponzi scheme. Each individual would get back (on an actuarial basis) exactly what they put in, with interest. For the economy as a whole, the fund would rise (to 24% of GDP under the particular assumptions made on growth) and then stay there. And the interest being paid would come from the US Treasury. Since the US Treasury would be paying the interest to others anyway, the shift to the Supplemental Social Security fund would not present any additional burden on the US Treasury, but would rather be neutral.
But it needs also to be recognized that a scheme such as this would not represent a permanent fix to the traditional Social Security system. It would provide significant funding to Social Security, which would extend the life of the Trust Fund, but would not solve the underlying deficit that has arisen due to longer life expectancies with an unchanged (since 1990) Social Security payroll tax rate. As noted above, the gap is not large, at about 1% of GDP, and is far less than the tax revenues lost as a result of the Bush tax cuts. But perhaps by 2058 the country will be mature enough to recognize that the most successful social program of the last century in the US is worth paying for.


You must be logged in to post a comment.