The Fiscal Multiplier: Econ 101

A.  Introduction

The “fiscal multiplier” (often referred to as just the “multiplier”) is simply the ratio of how much aggregate GDP will increase for a unit increase of fiscal spending.  Hence if fiscal spending increases by say $100 and aggregate GDP increases by $200 in response, the multiplier is equal to 2.  The concept is also often applied similarly to tax cuts of some dollar amount.

Under conditions where there is significant unemployment in an economy, an increase in government spending can be expected to have a multiple impact on GDP.  There will be a direct contribution to GDP from the increased production to provide for the demand from government, but also an indirect contribution as those being paid for the initial goods (whether newly employed workers or suppliers of inputs to the production of the good) will in turn spend at least some portion of their higher incomes on other goods or services in turn.  And this process will continue in further rounds.

While the concept is simple, the multiplier in practice is difficult to measure.  It is not a constant, but rather a definitional concept whose value will vary depending on the specific economic circumstances of the time and place.  It has also been controversial, as some economists both historically and even currently do not believe it is possible for an economy to be functioning at less than full employment.  For such economists, higher production from an increase in demand is not possible since the economy is already at full employment, and the multiplier must then always and everywhere be uniquely equal to zero.

But most economists recognize that it is possible for the economy to be at less than full employment.  This is especially clear today in most of the developed world, including in the US, Europe, and Japan, with unemployment high in each of these countries or regions.

The real debate, then, is about the size of the multiplier in a particular situation – whether it is low or high.  If low, then fiscal stimulus will not have much of an effect on increasing GDP, while fiscal austerity will not lead to a big reduction in GDP.  If high in contrast, fiscal stimulus will be quite effective in raising GDP, while fiscal austerity will lead to big reductions in GDP and consequent large increases in unemployment.

Recent work at the IMF, a conservative institution, on the size of the multiplier has brought this debate into the general news.  In particular, in June the IMF published a self-evaluation of the IMF supported (as well as EU and ECB supported) economic program in Greece.  It noted there (on page 21) that the fiscal multipliers assumed in that program turned out, based on actual experience, to have been too low.  This self-criticism was picked up in the general press, and many have questioned how the IMF (and the others) could have gotten this so wrong.

But judging the size of the multiplier in a particular place and in particular circumstances is not easy.  This Econ 101 blog post will discuss why the multiplier will vary in different countries and in different country circumstances.  And while it might be understandable how the multiplier might be misjudged ex ante in some concrete case, what is outrageous is not that initial misjudgment.  What is outrageous is that the policies that had been taken based on that earlier misjudgment were not then revised or reversed to reflect what had been learned.

B.  Why the Multiplier Will Vary

As noted above, the multiplier is not a constant, equal to the some particular value in all countries and under all circumstances.  Rather, it is a concept, expressing a relationship (between changes in GDP and changes in government spending) which will in general vary across different economies and across different circumstances in any particular economy.  Hence even if one had a good estimate of what it might be in one particular country under particular circumstances, one should not assume it would have that some value in another country or even in the same country under different circumstances.

Specifically, one should expect:

1)  The multiplier will vary across countries, depending on the size and structure of those countries:  In a large country such as the US, an increase in spending (both direct and indirect) will be met primarily by supplies originating in the US.  The multiplier will then be relatively large.  In contrast, higher spending in a small and open economy, such as Monaco to take an extreme example, will be met primarily by supplies originating elsewhere.  The multiplier will then be relatively small.   Most economies are in between these two in size, and one would expect the multiplier then also to be in between these two in size.

Note that this will depend not only on the size of the economy, but also its economic structure (the type of goods produced within that economy, as opposed to imported) and the nature of its trade regime.  Some economies are more open than others.

2)  The multiplier will vary depending on the current state of the economy – how far or close the economy is to full employment:  If unemployment is significant, an increase in demand can be met with an increased supply of goods, and an increase in employment of workers to produce those goods.  The multiplier will be relatively high.  In contrast, if the economy is at a time of close to full employment, an increase in demand for certain goods can only be met by reduced production of something else (with a shift in jobs from the latter to the former), so overall output might not rise by much.  In such circumstances the multiplier will be relatively low.

Hence if one had a good estimate of the multiplier in some particular economy at a point in time when the economy was close to full employment, one would greatly underestimate what the multiplier would be in that same economy at a different time when unemployment was high.

3)  The multiplier will vary depending on the form of the fiscal stimulus:  Fiscal stimulus programs can take the form of spending on newly produced goods (such as infrastructure), or on transfer programs to households (such as higher or extended unemployment benefits), or on tax cuts or tax rebates.  But while each might have a similar direct dollar impact on the fiscal deficit, the impact on GDP could vary widely.

Direct government expenditures on newly produced goods, such as new roads or school buildings, will likely have the largest impact on GDP.  The newly produced goods will, with certainty, be produced, and such product is a direct component of GDP (GDP stands for Gross Domestic Product).  And those newly employed to produce such goods (e.g. construction workers) will also then spend most or even all of their new earnings on goods they need.  The multiplier will be high.

The multiplier will also likely be relatively high on transfer programs that go to the unemployed and others who are relatively disadvantaged, as they will spend what they receive on goods that they and their family very much need. The multiplier will be less on transfer programs that benefit those who are better off (such as certain farm subsidies, for example, when they mostly benefit large and relatively well-off corporate farms), as such individuals or firms will likely save a higher share of such receipts.

And the multiplier might be quite small for tax cuts or tax rebates that go to upper income households, as they will likely save much of what they receive.

Hence the size of the multiplier will depend on the nature of the fiscal stimulus program.  Programs focussed on the direct production of goods, especially labor-intensive goods (such as the building and maintenance of much of infrastructure), or on transfers to the relatively less well off, can be expected to have a relatively high multiplier effect.  Programs focussed on transfers or subsidies going to the relatively well off, or tax cuts that accrue primarily to the relatively well off, can be expected to have a relatively low multiplier effect.

4)  The multiplier will vary depending on whether the stimulus (or austerity) programs are temporary or expected to be sustained:   Temporary tax cuts or tax rebates are a common component of stimulus programs, in part because they can be implemented quickly and easily.  However, households receiving a temporary tax cut or a one-time rebate will normally simply save a high share of what is distributed to them (or use the funds to pay down outstanding debt they might have).  The multiplier will then be relatively low or even negligible, as there would be little increased demand for goods to be produced.

5)  The multiplier will vary depending on the direction of change:  Many make the simplistic assumption that if the multiplier has some value for an increase in spending or for a tax cut, one will see the same value for the multiplier for a decrease in spending or a tax increase.  But there is no reason to assume this will be the case.  People will in general respond differently if facing an increase in income (such as from a tax cut) or a decrease (such as from an equal tax increase).  With a tax cut, the households might simply save most of what they receive, resulting in a low multiplier.  But with a tax increase (which one might see as part of an austerity program, for example), the households might be forced to scale back their consumption to pay the higher taxes, resulting in a relatively high multiplier when going in this downward direction.

Similarly, the multiplier impact when a worker is newly hired as a result of a stimulus program will likely be different than the multiplier impact when a worker is laid off as a result of an austerity program.  The multiplier impact is likely to be substantially greater (in the negative direction) when workers are laid off as such workers will likely be forced to scale back their consumption substantially.

6)  The multiplier will vary depending on the policy response of others:   While the government might launch a stimulus program, other economic actors might respond with policy changes of their own.  For example, a Central Bank might raise interest rates when the government launches a stimulus program, due perhaps to a concern on inflation (possibly a mis-guided concern, but nonetheless what they are acting on).  Raising interest rates would lead to a cut in investment, and hence the impact of the stimulus program on GDP might be constrained.  The multiplier would then be low.

Importantly, the ability of the Central Bank to respond by lowering interest rates to a cut-back in government spending, to offset what would otherwise be the contractionary effects of such a cut-back, is important to recognize and take into account.  In times like the present in the US, Europe, and Japan, when the interest rates set by the Central Bank are essentially at zero and cannot go lower, a cut-back in government spending cannot be offset by a cut in interest rates (interest rates are already as low as they can go), and the multiplier will be relatively high.  The fiscal contraction will lead to a large reduction in GDP.  In contrast, if the fiscal contraction is delayed until the economy is closer to full employment, with interest rates then positive and significant, the impact on GDP of a cut-back in government spending can be offset at that point by the Central Bank lowering interest rates, and output will not then fall.  The multiplier will at that point be close to zero.

This has extremely important implications for the design of fiscal adjustment programs.  There may well be a need eventually to reduce public debt to GDP ratios, by cutting back on government spending or increasing taxes.  But if this is done when there is significant unemployment and the Central Bank controlled interest rates are at or close to the zero lower bound, then the fiscal austerity programs will reduce demand and lead to a large fall in GDP (and consequent further rise in unemployment).  One should instead maintain fiscal demand until the economy has recovered sufficiently that one is close to full employment and interest rates are no longer at or close to zero.  At that point, a cut-back in government spending (or an increase in taxes) can be offset by the Central Bank through its management of interest rates, and GDP need not then fall.

Unfortunately, the US, Europe, and until recently Japan, have been doing the opposite since 2010.

The financial markets are another economic actor which can have an impact.  For example, in economies where the foreign exchange rate floats, the foreign exchange markets might respond to a stimulus program with a devaluation of the foreign exchange rate.  This devaluation would make exports more competitive (thus spurring production of exports), and imports more expensive (thus encouraging production of domestic substitutes for what had been imported), which would be expansionary.  The multiplier in such circumstances would then be relatively high.

7)  The multiplier will vary depending on the time frame:  So far we have not made any note of the time dimension, and have implicitly treated all the responses as taking place simultaneously.  But the time dimension does matter, as it takes time to implement programs, and then time for the multiple round responses to work themselves out.  Hence one should be clear on whether one is referring to the multiplier as the response in, say, the current quarter of a year, or over the next year, or over the next several years, or what.  The multiplier will be relatively low if measured as the impact on GDP in the current quarter, fairly large over the next year, and then begin to diminish thereafter.  And one then needs to be clear if one is referring to the multiplier in terms of the impact on GDP only within a certain period, or the cumulative impacts over a multi-year range.

C.  Conclusion

The multiplier is important, and a good deal of work has been done over the years to try to measure what it might have been in a particular time and place.  But factors such as those listed above have not always been taken into account when economists (including at the IMF) and analysts have sought to apply those results.

It has unfortunately been the case, for example, that estimates of the multiplier found when the economy was close to full employment, were then assumed to be similar when the economies at some later time were in a downturn and far from full employment.  Or cross-country differences have been ignored when the multiplier found for some small economy, say, was assumed to apply equally to a large economy.  Or the multiplier that might apply in an expansion resulting from a stimulus program was then assumed to apply similarly in a contraction resulting from an austerity program.  Or no attention was paid to how the multiplier will differ in a stimulus program depending on whether one is looking at new infrastructure work, or transfer programs, or tax cuts.  Or the multiplier for tax cut programs was treated as the same whether the tax cuts were going to the relatively poor or the relatively rich.

This has not always been the case.  Some economists and analysts have been careful.  But there has also been a lack of attention to these issues.  This does not mean one should ignore the multiplier, but rather that one needs to work with care.

Obama and Prices: The Markets Expect Inflation to Remain Low

US Treasury Bond Yields, TIPS, and Expected Inflation, Jan 2, 2003, to Aug 8, 2013

Conservative critics of Obama argue his policies will inevitably lead to high inflation.  A previous blog post on this site showed that in fact inflation during the four years of Obama’s first term had been the lowest over any presidential four year term going back a half century.  Low inflation during Obama’s first term cannot be denied.

The conservative critics respond that while inflation may have been low so far, it is inevitable that inflation will soon rise.  The blog post cited above provides links to several examples of what they have been saying.  But this assertion can be examined as well.  In particular, the financial markets (which the conservative critics generally take as reflecting a sound view on such matters, as the investment returns of such investors will depend on getting this right) can be used to see what at least the markets believe inflation will be going forward.

Since 1997 the US Treasury has been issuing bonds of varying maturities whose principal is indexed to the US CPI price index.  These bonds, known as TIPS (for Treasury Inflation-Protected Securities), provide a return which will be the same in real terms regardless of what inflation turns out to be.  The yields on such bonds can be compared to the yields on regular US Treasury bonds of similar maturity.  Such regular US Treasury bonds will pay interest and at the end return the principal in certain dollar amounts, with a value in real terms which will vary depending on what inflation turned out to be.

Inflation is normally positive, so the regular bonds will pay rates which are higher than the rates on TIPS bonds.  But whether the higher rates are worthwhile will depend on how high inflation turns out to be.  To illustrate with some simple numbers, suppose the rate on a 10-year regular US Treasury bond is 3% while the rate on a 10-year TIPS is 1%.  If inflation turns out to be 2%, the bonds will be equally valuable.  But if inflation turns out to be 3%, it would have been better to have invested in the TIPS.  The TIPS will still pay out a 1% real return, while the regular US Treasury will yield a real return of only 0% (a 3% nominal return, but with 3% inflation the real yield will be zero).  Alternatively, suppose inflation turns out to be 1%.  The real return on the regular US Treasury will be 2% (equal to 3% minus 1%), while the TIPS will still yield the contracted 1% real return.  In one believes inflation will be just 1% over this period until maturity, it would have been better to have invested in the regular bonds.

The investors will therefore need to determine what they expect inflation to be.  They will bid up the price of one of the bonds (and bid down the price of the other) if they believe inflation over the time to maturity of the bond, will be higher or lower than the current gap in the yields between the two.  Where the prices of the two bonds settle, and therefore what the gap in yields is between the two, therefore reflects what the financial markets as a whole believe will be the rate of CPI inflation over the period until the bonds mature.  Since real money is riding on this, the investors will take it seriously.

The graph above shows the yields on regular 10-year US Treasury bonds (in blue) and on 10-year TIPS (in green), for the period from January 2, 2003, to August 8, 2013.  The data comes from the official US Treasury web site (where the data presented there goes back to January 2, 2003).  The implied 10-year expected rate of inflation (in red) is then calculated based on the difference between the two yields.

As can be seen in the graph, the yields on the regular 10-year US Treasury bond varied a fair amount over the period, from generally between 4 and 5% during the Bush presidency, falling over time to below 2% for much of 2012, and then rising to about 2 1/2% recently.  The 10-year TIPS yield similarly varied from around 2% during the Bush years, to negative levels for 2012 and the first half of 2013, and rising to a still low but positive 1/2% recently (and most recently just 1/3%).

Despite such fluctuations in the yields of the regular 10-year bond and the 10-year TIPS, the implied expected inflation rate (the difference between the two yields) has been relatively constant, at about 2 1/2% during the Bush years and a similar but slightly lower rate (on average) during the Obama presidency.  The one exceptional period, which should be excluded, would be during the period of economic and financial collapse in the final months of the Bush presidency, after Lehman Brothers went bankrupt and the financial markets were in chaos.  The TIPS yields went up while the regular US Treasury bond yields fell sharply, leading to an implied expectation of inflation of close to zero.  But the figures under such chaotic conditions should not be taken as meaningful.  The chaotic markets then stabilized within a short period of Obama taking office in January 2009, with the rates then returning to more normal levels.

The financial markets, which the conservative critics of Obama normally place a good deal of faith in, therefore do not show any indication that they expect inflation over the next decade to rise.  Rather, they expect inflation of around 2% a year to continue, which is consistent also with the rate of inflation the Fed targets.

Finally, the figures on the bond yields in the graph above also show that the US government has been able to borrow, and continues to be able to borrow, at incredibly low rates, whether in real or nominal terms.   The TIPS yield (the borrowing rate in real terms) was indeed negative in for most of 2012 and the first half of 2013, and is still only 1/2% or less.  Even were it not for the still high unemployment in the country, this is the period when the government should be undertaking investments in both new infrastructure and other assets, and in maintenance of existing assets.  Such investments are worthwhile even if they generate returns of only 1/2% in real terms.  Yet such investments, particularly in maintenance, will generate returns that are orders of magnitude greater than that.

It has been incredibly stupid that the Republican insistence on cutting government spending has blocked us from proceeding with such investments at a time when the borrowing costs to fund them have been so low.

Taxes on Corporate Profits – Low, Falling for Decades, And Now Close to a Voluntary Tax

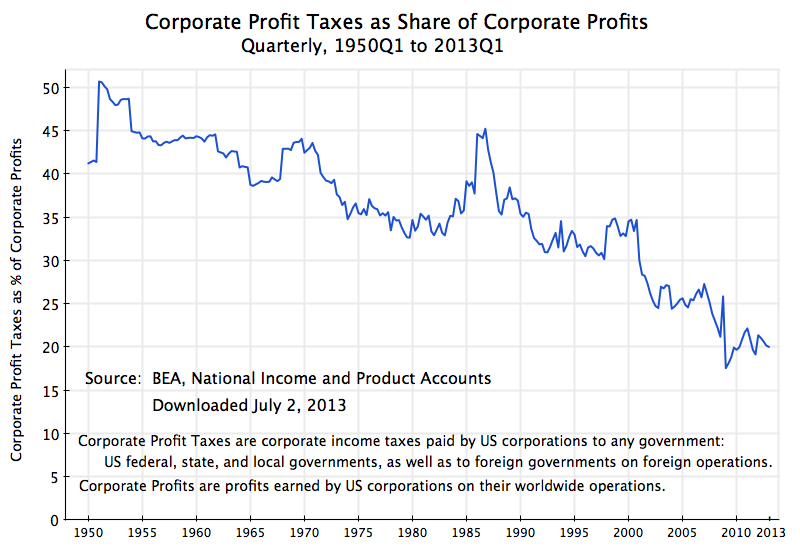
Corporate Profit Taxes as Share of Corp Profits, 1950-2013Q1

Conservatives bemoan the US corporate profit tax rate, which at 35% for the statutory rate  is the highest among OECD members.  They insist the tax, which they consider to be high, is both unfair and harms US competitiveness.  While they acknowledge that the rates the US corporates actually pay are less, due to legal deductions and other mechanisms, what might not be clear is how low US corporate profit taxes have become.

The US Government Accountability Office (GAO, the audit and investigating agency that  works for the US Congress) released on July 1 a report on what US corporations in fact pay in corporate profit taxes.  Using tax return data (but aggregated to preserve confidentiality), the GAO found that profitable US corporations in 2010 paid federal corporate profit (also called income) taxes at a rate of just 13%, despite the statutory rate of 35%.

If one includes corporations that reported a loss in 2010 (and hence had zero or only little profit taxes due, leaving the numerator the same but whose losses then reduce the denominator in the ratio), the average federal tax rate came to only 17%.  Furthermore, the total tax including not just US federal taxes, but also US state and sometimes local taxes as well as profit taxes paid abroad, came to only 17% in 2010 for the corporations reporting profits, and 22% when one includes the loss-makers.

All these rates are far below the statutory federal corporate profit tax rate of 35%, which has been in place since 1993.  There are state and sometimes local corporate profit taxes on top of this, with rates that vary from zero in certain states (such as Nevada), up to 12% for the top marginal rate (in Iowa).  The state taxes average about 6 1/2%.   Taking account of just federal and state taxes, the corporate profit tax rate on average should be over 41%.

The GAO investigation was carefully done, and has raised again the point that while the US corporate profits tax rate might appear to be high, it bears little relationship to what corporations actually pay.  And the trend over time is decidedly downward.  The graph above uses data from the National Income and Product (GDP) Accounts, produced by the BEA of the US Department of Commerce to show what corporate profit taxes have been as a share of corporate profits since 1950.  While these figures will not be exactly the same as what actual tax return data will show (due to definitional differences in what is included in taxes and especially in how corporate profit is defined, as well as due to timing differences arising from the distinction between when tax obligations are accrued and when they are paid), the trend is clear.  Corporate profit taxes as a share of corporate profits have been falling steadily, from over 50% in 1951 to only 20% recently.  These estimates from the GDP accounts are consistent with the recent GAO figures based on tax return data, where one should note that the BEA estimates will include loss-making firms as well as profitable ones in their averages.

The fall in the actual rate paid to just 20% in recent years also undermines the argument that a high US corporate profits tax rate has undermined the incentive to produce.  Economic performance was better when the profits tax rate paid was much higher than now.  The US corporate profits tax rate averaged 44% in the 1950s and 1960s, yet economic growth was strong then.  As an earlier post on this blog discussed, economic growth performance in the US was substantially better in the 30 years before 1980 than in the 30 years after.

Furthermore, there is little support in the figures that the US corporate profits tax rate at 35% puts the US at a competitive disadvantage vis-a-vis the other OECD members.  While the 35% rate is indeed the highest, the second highest is 34.4% and the third is 33.99% (see the OECD source cited above).  Fifteen of the 33 OECD members covered had rates of 25% or above, and a further 10 had rates of 20 to 24.9%.  More importantly, all of these OECD members, other than the US, imposed a value-added tax on top of their corporate profits tax (and other taxes).  These additional value-added taxes were as high as 27%, and 23 of the 33 OECD members (including essentially all of Europe) had value-added tax rates of 18% or more.  Value-added taxes will be taxes on corporate profits (as well as on labor income), and should not be ignored when one is looking at the overall rate of tax on corporate profits.

The ability to avoid taxes on corporate profits has been receiving increasing attention in recent months.  Historically, much of this avoidance has been achieved through explicit provisions written into the tax code by Congress for certain subsidies or other government expenditures, which the Congress did not want to explicitly provide for or acknowledge in the budget.  Examples include credits for investing in certain locations or for certain purposes (such as R&D), or accelerated depreciation allowances as a mechanism to spur investment.  The objectives might well be worthwhile, but by hiding in the tax code what are in reality subsidies, and then keeping them secret due to the privacy of tax return data, such subsidies are likely to be both inefficient and misguided.  If subsidies are warranted, it would be better to provide them openly and transparently through the budget.

More recently, large corporations have learned how to use international operations as a means of hiding profits from jurisdictions where they would be subject to tax.  Some examples of what US firms have done in the UK to avoid paying taxes there have been recently in the news, and provide good examples of what modern firms can do anywhere, including in the US.

Transfer pricing, while technically illegal, has historically been one mechanism to do this.  This appears to have been one of the ways (among others) that Starbucks was able to run highly profitable coffee shops in the UK, but pay nothing in UK profit taxes.  Starbucks of the UK would “purchase” coffee beans from a Starbucks subsidiary legally based in Switzerland, which would in turn purchase the coffee beans from around the world.  Since commodity trading in Switzerland pays very little tax on the corporate profits generated in such trading, Starbucks could pay the international price for coffee beans through its Swiss subsidiary (even though the beans would never pass physically through Switzerland), and then charge the UK subsidiary a higher price for the beans.  This would increase the costs (and hence reduce the profits) of the UK subsidiary, while generating high profits on coffee bean trading in its Swiss subsidiary, where little or no tax was due on such operations.  And this could be done in essentially any jurisdiction which does not tax corporate profits.

There were other mechanisms as well that Starbucks appears to have used, including intra-company loans from one subsidiary (based in a low tax jurisdiction) to a subsidiary in a jurisdiction (such as the UK) where corporate profit taxes would be due.  This is very similar to transfer pricing on supplies, although here it would be for the supply of capital.

Through these and other mechanisms, Starbucks has been able to avoid, probably legally given the tax code as written, most corporate profit taxes on its UK operations, even though it had consistently reported to analysts on Wall Street that its UK operations were highly profitable.  This became such a public relations disaster that in June the company announced that it would voluntarily pay UK profit taxes of £10 million in 2013 and a second £10 million in 2014.  Starbucks has shown how corporate profit taxes have become in reality voluntary taxes, paid only to avoid image problems.

Starbucks provides a good example of what modern corporates can do, even though it operates just a simple business of selling coffee.  High-tech firms such as Apple are more often in the news since they have generated high profits yet have legally been able to avoid paying taxes on these profits at anything close to the 35% statutory rate.  For example, and as reported in a recent Senate investigation, Apple was able to exploit a difference in how corporations are defined in terms of their tax liability in a country, in order to generate profits in an Irish subsidiary which would not be subject to tax in either Ireland or the US.

More generally, US corporates do not have to pay US corporate income tax on profits generated in overseas operations until these profits are brought back to their US companies.  This is unlike the case for US citizens, who must pay each year income taxes on income generated everywhere in the world, and not just the US.  Because of this provision in the US tax code, Apple and other US corporates have kept accumulated profits legally overseas, so as to avoid paying US profit taxes on them.   The total for large US corporates reached an estimated $1.9 trillion as of the end of 2012, with Apple alone accounting for $102 billion.  Republicans have pushed for a tax amnesty on the repatriation of such funds, as was done once during the presidency of George W. Bush.  But such tax amnesties of course then generate the incentive to hold such profits in untaxed offshore accounts again, in the expectation that an administration in the future will once again grant such an amnesty.

And it has now become straightforward to structure a system of corporate subsidiaries so that almost any company can, if it wishes, make it appear that profits in the US (or indeed any other country, where corporate profit taxes would be due) are close to zero, and instead are high in some low tax or even untaxed jurisdiction such as the Cayman Islands.  Transfer pricing is one such mechanism, although technically illegal as prices between corporate subsidiaries are supposed to be “arms-length” market prices.  But these are effectively impossible to enforce.  How does a tax-audit determine what the price should have been for some specialized input (such as a component going into an iPad), for which no market exists?

But there are other means as well.  High tech firms such as Apple can, for example, transfer ownership of some patent to an Apple subsidiary in the Cayman Islands, and then require the Apple US firm to pay a royalty to the Apple Cayman Islands firm.  Or Starbucks can transfer ownership to the Starbucks brand name similarly to a subsidiary in some low tax or no tax off-shore jurisdiction, and then have the US subsidiaries pay that off-shore subsidiary for the use of that brand name.

The legal “technology” for corporate tax avoidance has therefore come to the point where what is in fact paid in corporate profit taxes can be close to voluntary.  Starbucks in the UK is the most clear case so far.  Governments are concerned, as these mechanisms can now undermine, quite legally, collections on what was at one point an important tax.  The OECD now has a working group looking at possible reforms to address the currently legal ability of modern corporates to avoid taxes through their international operations, with a report scheduled to be released in July.  But it remains to be seen whether politically possible changes in the tax code will be able to ensure such loopholes are closed.