Europe GDP Falls Again: Austerity Programs Lead to Contraction

Europe GDP Growth, 2007Q4 to 2012Q4

The European Statistical Agency Eurostat released today its “flash” estimate of GDP growth in the European economies in the fourth quarter of 2012.  The results are terrible.  The initial estimate is that GDP fell at a seasonally adjusted annualized rate of 2.4% in the fourth quarter (or a fall of 0.6% quarter on quarter) in the 17 economies that make up the Eurozone, and that GDP fell at an annualized rate of 2.0% (0.5% quarter on quarter) in the 27 economies in the European Union as a whole.  The 2.4% rate of fall of GDP in the Eurozone, and fall of 2.0% in the EU as a whole, can be contrasted with the recently released estimate that GDP in the US was essentially flat (a 0.1% rate of decline in the initial estimate) in the fourth quarter of 2012.

The flat GDP in the US at the end of 2012 was not a good performance, and has been justly criticized as well below what is needed.  But the fall at a rate of 2.4% in the Eurozone was far worse.  As shown in the graph above, Eurozone GDP has now fallen steadily for five quarters in a row.  Europe is well into a double-dip recession, having never fully recovered from the 2008 downturn, and its GDP is now 3% below what it was in the first quarter of 2008, almost five years ago.

Not only is output falling in Europe as a whole, but it is also falling in each of the major countries.  Especially notable is the fall in GDP at an annualized rate of 2.4% in Germany.  GDP in Germany had been rising at a modest rate since mid-2009, although the recovery slowed in 2011 and has now turned negative.  But in addition to Germany, there were falls in GDP at annualized rates of 1.2% in France and the UK, of 0.8% in the Netherlands, and also of 2.8% in Spain and 3.6% in Italy (not shown in the graph above).

UK output is now even further below the path it followed during the Great Depression in the 1930’s.  As discussed in an earlier posting on this blog, the UK economy is performing worse now than it did during the Great Depression.  The turnaround from what had been a modest but steady recovery occurred in mid-2010, when the newly elected Conservative-led government embarked on an austerity plan similar to what Republicans have called for the US to follow.  But the consequences have been terrible.  By 19 quarters into the downturn (one quarter shy of five years), the UK economy is producing 3% less than it had in early 2008.  At the same point during the Great Depression, the UK economy was producing 4% more than at its previous cyclical peak, and growth was steadily positive.

The fall in German GDP is significant, as it may now induce Germany to agree to steps that would allow Europe as a whole to recover and start to grow.  Germany has been a forceful advocate for austerity in both fiscal and monetary programs, even though (as discussed in an earlier posting on this blog), Germany itself had until 2011 had its government expenditures grow relatively strongly.  But its economy slowed in late 2011 and into 2012, and output has now fallen sharply in the last quarter of 2012.  Germany has strongly resisted measures which would have served to boost European growth, but there may now be a basis for the hope that this will change, now that Germany sees its interests aligned with those of others in Europe.

There are steps that Europe could take to recover from this downturn.  These include:

  1. Reverse the austerity policies, at least among the economies with ready access to the financial markets.  Ten year government borrowing rates are only 1.5% in Germany, 1.7% in the Netherlands, 1.8% in the UK, and 2.2% in France.  These are either below, or close to, the 2% inflation target of the ECB and others.  That is, these governments can borrow ten year funds at essentially zero or even negative real cost.  It is madness not to make use of such funds to pay for investments in infrastructure, education, and other purposes, at a time when resources (both labor and capital) are idle due to lack of demand.  Indeed, it is in times like these when such public investments are best made.  Not only do they boost the recovery, but they do not displace the use of such resources for other purposes.  When the economy is close to full employment, with capital also being fully utilized, using resources for infrastructure and other public investments entails a trade-off, as the resources then used for such public investment have to be drawn from their use for other purposes.  The trade-off might then still be warranted, but it is far better to make such public investments in times like today, when there is no such trade-off.
  2. The European Central Bank should follow the more supportive monetary policies that have been followed by all the other major central banks in the world, including in the US, the UK, and Japan.  The main policy interest rates at all these other central banks have been kept at 25 basis points (0.25%) or below since their economies started crashing in late 2008.  The European Central Bank, in contrast, kept its main policy interest rate at 100 basis points from May 2009 to April 2011.  This relatively high rate at a time of economic weakness led to greater economic weakness, as shown in the graph above.  It then made the mistake of starting to raise the rate, first to 125bp and then to 150bp in the spring and summer of 2011.  The renewed downturn in GDP of the Euro 17 started soon thereafter (see the graph above).  The ECB then started to lower the rate again in late 2011, but it was too little and too late. And the policy rate remains (since mid-2012) at 75bp, well above the rates followed by the other major central banks of the world.  The ECB should lower its rate to 25bp immediately.
  3. Weakness in the commercial banking system in Europe remains a major problem, particularly as financial markets in Europe are far more dependent on their commercial banking systems than is the case in the US (where capital markets are relatively larger).  When the euro was under intense pressure last summer, European leaders agreed to move to some form of a system of more centralized commercial bank regulation and supervision.  But while an important agreement was reached in December 2012, under which the European Central Bank would supervise directly the larger banks in Europe, this agreement did not go as far as had been earlier anticipated.  While it was agreed that the ECB would have direct responsibility for the supervision of the major banks, its authority to deal with failing banks and the resources it could use to do so, were kept limited.  There is also no central system of deposit insurance, but rather still a set of different systems at the national level.  A euro-wide system of bank regulation and supervision, with the power and resources to address failing banks and with a consolidated deposit insurance system, would go far to addressing the weaknesses of a common currency zone.  In a common currency zone, the ability of national authorities to deal with failing banks is constrained.

Europe is now in a double-dip recession.  The austerity programs have failed.  Yet Republicans in the US continue to push for the US to follow similar policies.
GDP Growth in the Fourth Quarter of 2012: Cuts in Government Spending Drove GDP Down

Growth of GDP and Contri of Govt, 2007Q1 to 2012Q4

BEA release of 1/30/13; Seasonally adjusted annualized rates       Percent Growth Contribution to GDP      Growth (% points)
2012Q2 2012Q3 2012Q4 2012Q2 2012Q3 2012Q4
Total GDP 1.3 3.1 -0.1 1.3 3.1 -0.1
A.  Personal Consumption Expenditure 1.5 1.6 2.2 1.06 1.12 1.52
B.  Gross Private Fixed Investment 4.5 0.9 9.7 0.56 0.12 1.19
 1.  Non-Residential Fixed Investment 3.6 -1.8 8.4 0.36 -0.19 0.83
 2.  Residential Fixed Investment 8.5 13.5 15.3 0.19 0.31 0.36
C.  Change in Private Inventories nm* nm* nm* -0.46 0.73 -1.27
D.  Net Exports nm* nm* nm* 0.23 0.38 -0.25
E.  Government -0.7 3.9 -6.6 -0.14 0.75 -1.33
Memo:  Final Sales 1.7 2.4 1.1 1.71 2.37 1.13
    nm* = not meaningful
$ Value of Change in Private Inventories (2005 prices) $41.4b $60.3b $20.0b

The Bureau of Economic Analysis of the US Department of Commerce released on January 30 its initial estimate (what it formally calls its “advance” estimate) of US GDP growth in the fourth quarter of 2012.  The result was terrible:  GDP is estimated to have declined by a slight amount (0.1% at an annual rate).  While it is possible that this estimate will be revised upwards as the second and third revisions are released next month and the month after (there has historically been an upward revision on average of 0.3% points from the advance estimate to the third, and there was a particularly large upward revision in the 2012Q3 figures between the advance and third estimates), fourth quarter growth will still likely be disappointingly low.

The primary cause of the stagnation of GDP in the fourth quarter was a sharp cut in government spending.  As shown in the table above, total government spending on goods and services (federal, state, and local) fell at an annualized 6.6% rate in the quarter.  This had the direct impact of subtracting 1.33% points from what GDP growth would otherwise have been.  But there will also be an indirect impact, as workers who would have been employed producing goods and services for government would in turn buy goods and services themselves with the salaries they would have received.  With a multiplier of just two, the impact of the cut in government spending in the fourth quarter was a subtraction of 2.66% points (2 x 1.33% points) from what growth would have been.

Most of the decline in government spending was due to a large fall in spending at the federal level, although state and local spending fell some as well.  Federal government spending fell at an annualized rate of 15%, all due to a fall in defense spending at an annualized rate of 22%.  These declines more than offset increases of an estimated 9.5% and 13% in total federal and in defense spending respectively in the third quarter, which had contributed to the relatively good GDP growth of 3.1% in that quarter.  The swings were likely due to end of the fiscal year spending (the federal fiscal year ends September 30) which was particularly sharp last year and therefore not picked up in the normal seasonal adjustment calculations.  The fall in the fourth quarter of 2012 (the first quarter of the fiscal year) reflected the continued budget uncertainty, as Congress threatens to slash the current budget drastically, either by design or through the automatic sequester cut-backs dictated as part of the agreement to get out of the debt ceiling debacle in 2011, that might be instituted soon (see below).

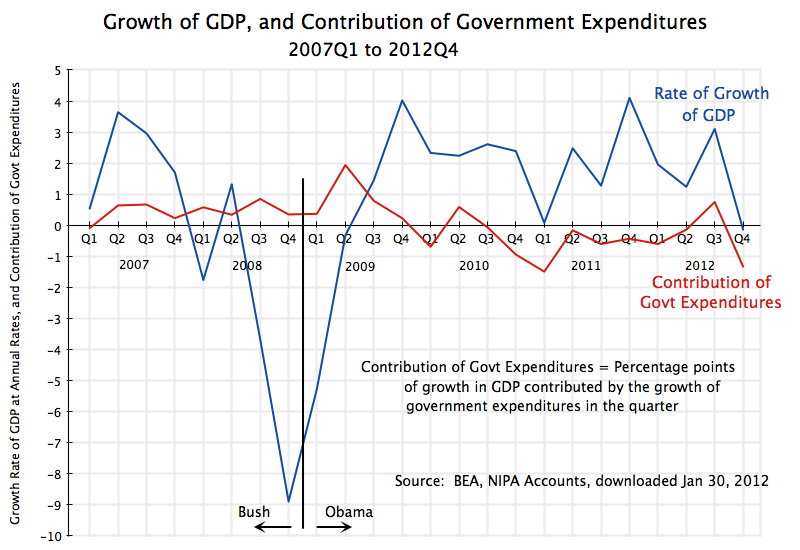
The fall in government spending in the fourth quarter was particularly sharp, but government spending has been falling in each quarter but two since the beginning of 2010.  The resulting fiscal drag has held back growth.  The figures are shown in the graph at the top of this blog.  The graph shows the rate of growth of GDP each quarter (in blue, at annualized rates) since the beginning of 2007, plus the direct contribution to this growth each quarter from government expenditures (in red).

Government spending rose each quarter in 2007 and 2008, the last two years of the Bush Administration, and this continued into 2009 after Obama was inaugurated.  The growth in government expenditures was particularly sharp in the second quarter of 2009 as the stimulus measures started, and this succeeded in turning around GDP.  GDP was falling at an annualized rate of 8.9% in the fourth quarter of 2008, and this carried over into the first quarter of 2009 with an annualized fall of 5.3%.  But then GDP stabilized and began to grow in the third quarter of 2009, and it has grown each quarter since until the fourth quarter of 2012.

But GDP growth since 2010 has been disappointingly modest, at rates of just 2 to 3% a year on average (with some quarterly fluctuation), as it has been dragged down by the falling government expenditures over this period.  As has been noted in earlier postings on this blog (for example here and here), the resulting fiscal drag can explain fully why this recovery has been modest in comparison to the recoveries seen in previous downturns in the US economy over the past four decades.

The other major factor explaining the stagnation of GDP in the fourth quarter was the negative contribution from inventory accumulation.  The change in private inventories led to 1.27% points being subtracted from what GDP growth otherwise would have been.  But as was explained in an Econ 101 posting on this blog, it is the change in the change in private inventory accumulation which acts to contribute to (or subtract from) GDP growth in any given period.

One sees news reports that still get this wrong, with statements such as that inventories fell by $40 billion in the fourth quarter.  This is not correct.  As noted in the table above, inventories actually grew by $20 billion in the fourth quarter.  But they grew by more (by $60 billion) in the third quarter.  That is, the change (the growth) in inventories was $60 billion in the third quarter, while the change (the growth) in inventories was again positive at $20 billion in the fourth quarter.  But while they continued to grow, they did not grow as fast as before, and the change in the change in inventories was a negative $40 billion.  This subtracted 1.27% points from GDP growth.

As was noted a year ago on this blog when the figures for GDP growth in the fourth quarter of 2011 were released, an increase in private inventory accumulation in that quarter largely explained the relatively good growth rate of that quarter.  But I argued this would then likely be reversed, with inventories not growing as fast and perhaps even declining, which would act as a drag on growth in 2012.  The 2012 figures now out show that this in fact happened, with a negative contribution of private inventory accumulation to GDP growth in the first, second, and fourth quarters.

Other than the drag from cuts in government spending and the deceleration of inventory accumulation, the other components of GDP growth in the fourth quarter of 2012 were generally quite good.  Residential fixed investment grew at an annualized rate of 15.3%, continuing the strong growth seen already in the second and third quarters.  But residential fixed investment was only 2.6% of GDP in the fourth quarter, so the rapid growth on this small base only made a contribution of 0.36% points to GDP growth in the quarter.  In contrast, government spending in the fourth quarter was 19.3% of GDP (down from 19.6% of GDP in the third quarter).  [Figures on GDP shares directly from BEA on-line GDP tables.]

Non-residential fixed investment (basically private business investment in capital and structures) also grew at a good rate in the fourth quarter, at 8.4% annualized, reversing a small decline seen in the third quarter.  And personal consumption expenditure rose at a 2.2% rate.  Since personal consumption accounts for 71% of GDP spending, this 2.2% increase contributed 1.52% points to what GDP growth would have been.

The fourth quarter GDP report therefore would have been solid, had it not been for the sharp cuts in government spending in the quarter.  Accumulation of private inventories then responds, as businesses do not want to see inventories mounting up on the shelves when they cannot be sold and scale back production (or in the fourth quarter, still increase their inventories, but not by as much as before).

The danger to the economy now is that government spending will be scaled back even further, as a Republican controlled Congress insists on slashing public expenditures.  If nothing is agreed to, then the sequesters that Congress required in August 2011 as a condition for the debt ceiling increase (so that the US would not then be forced to default) will mandate a sharp scaling back in federal government expenditures.  While the deadline for this was pushed back to March 1 from January 1 as part of the fiscal cliff agreement at the end of 2012, there is still a deadline.  The nonpartisan Center on Budget and Policy Priorities has estimated in a recent report that should the sequester enter into effect on March 1, defense spending would be cut by $42.7 billion, or 7.3%, while non-defense spending would be cut by also $42.7 billion, or 5.1% for programs included other than Medicare (Medicare would be cut by 2.0%).

Such cuts, especially if they suddenly enter into effect on March 1, would be devastating to  the economy.  Note that while federal spending already fell by 15% at an annualized rate in the fourth quarter, this fall at a quarterly rate is just 3.6%.  The sudden cuts under the sequester would be far larger.

Almost all of the participants in this budget process, both Democrat and Republican, agree that the sequester is something to be avoided.  The sequester requirement was in fact set up precisely as something both sides would want to avoid, so that agreement would be reached on some other budget plan.  But Republicans are insisting on similarly large cuts in any budget.  They simply wish that the cuts would fall more on domestic programs affecting the poor and middle classes, and less on the military.  But economically the problem for GDP growth would remain if similarly sized cuts are forced through, and would indeed be worse (in terms of the impact on GDP, even ignoring the distributional consequences) if they are re-focused on programs for the poor and middle classes.

Finally, it is worth noting that the price index figures also released by the BEA on January 30 as part of the GDP accounts still show no indication that inflation is any issue.  While conservatives have been asserting since Obama took office four years ago that high deficits resulting from his policies would lead to high inflation, that has not occurred.  The price deflator for GDP, the most broad-based index measuring inflation, grew by only 1.8% in 2012.  The price deflator for the personal consumption expenditures component of GDP (the price deflator that Alan Greenspan reportedly favored for tracking inflation) grew by a similar 1.7% in 2012.  These are both just below the target of 2% for inflation that the Federal Reserve Board favors.  (Inflation of zero is not desired by the Fed or others as it is then easy for the economy to slip into deflation, which makes management of the economy even more difficult.)

And inflation in the fourth quarter of 2012 was even less, at just 0.6% for the GDP deflator and 1.2% for the personal consumption expenditures deflator.  The prediction of both conservative economists and politicians that high deficits under Obama would lead to high inflation unless government expenditures were slashed drastically, could not have been more wrong.

The Example of Europe: Austerity Programs Are Indeed Contractionary


Europe GDP Growth, 2007Q4 to 2012Q3 - 1A.  Introduction

As the US comes closer to the so-called “fiscal cliff” (actually, more of a “fiscal slope”, as many have noted, as the impact will build over time rather than hit abruptly), it is worth reviewing the experience of Europe with the type of austerity programs that many are now pushing for the US.  The fiscal cliff we are now facing in the US is a manufactured crisis, created at the insistence of Republicans in August 2011 when they finally approved a higher statutory federal government debt limit.  It is a set of measures that will automatically enter into force on January 1, 2013, unless an agreement had been reached before then on actions to drastically cut back the federal deficit.

Unfortunately the debate underway in Washington is not on whether it is wise now (with the still weak economy) to enter into an austerity program of some sort.  Rather, it is solely on how severe that austerity program should be.  Any agreement will lead to a reduction in government spending and to increases in taxes, relative to what they would have been without the measures being negotiated.

The Republican argument is that adoption of such an austerity program is necessary for the US to be able to continue to grow.  Similar arguments were made in Europe.  Much of the continent has now adopted austerity programs, either willingly (such as in the UK) or due to pressure from other EU members and in particular pressure from the German government (such as in the cases of Greece, Spain, and Italy).  Our aim here is not to review in each case the reasons why the different countries may have chosen to adopt these austerity programs, which as noted was sometimes by policy choice and sometimes as a result of outside pressure.  Rather, the aim is to see what the impacts on growth have been since the programs were adopted (for whatever reason).

It is worth recalling what was said when these programs were first being pushed by prominent European authorities.  While critics forecast that such austerity programs would kill the incipient recoveries from the 2008/09 collapse (that started in the US and then spread globally), the European authorities in favor of these austerity programs argued that there was no need to worry.  They argued that such austerity programs would in fact be expansionary rather than contractionary.

The most prominent example is perhaps in the arguments made by the then President of the European Central Bank, Jean-Claude Trichet.  For example, in a June 2010 interview with La Repubblica (the largest circulation newspaper in Italy), Trichet said:

Trichet:  … As regards the economy, the idea that austerity measures could trigger stagnation is incorrect.

La Republicca:  Incorrect?

Trichet:  Yes. In fact, in these circumstances, everything that helps to increase the confidence of households, firms and investors in the sustainability of public finances is good for the consolidation of growth and job creation.  I firmly believe that in the current circumstances confidence-inspiring policies will foster and not hamper economic recovery, because confidence is the key factor today.

Trichet did not mis-speak.  He made a similar statement a month later in an interview with the newspaper Libération of France:

Libération:  Do the austerity plans announced amid monumental disarray by the Member States pose the risk of killing off the first green shoots of growth?

Trichet:  It is an error to think that fiscal austerity is a threat to growth and job creation. … Economies embarking on austerity policies that lend credibility to their fiscal policy strengthen confidence, growth and job creation.

But that has not been the case.

B.  The Larger European Economies, and Europe as a Whole

The figure above shows the paths of real GDP for the US, for several of the larger European economies, and for the Eurozone area as a whole, relative to the fourth quarter of 2007 (the peak before the start of the downturn in the US, and just before the start of the downturn in Europe, which for most was in the first quarter of 2008).  Some points to note:

  • The early path of the downturns were similar between the US and Europe, with a collapse in 2008 and into the first half of 2009, and then a start of a recovery with the stimulus packages adopted in the US as well as in much of Europe in 2009.
  • But then growth faltered in several of the European economies:  in mid-2010 in the UK, in early 2011 in the Netherlands, and more broadly in the 17 countries making up the Eurozone (who use the euro as their currency) in mid-2011.
  • The turnaround in the UK is particularly interesting for the US, as the UK (like the US) has its own currency and central bank, and can follow its own fiscal policy.  The abrupt end to the UK recovery in mid-2010 followed directly from new measures enacted by the then newly elected Conservative-led government (elected in May 2010, with initial emergency measures implemented from June, and a broader program implemented from October).  This was discussed in a previous blog post on this site.  Many of the Conservative government measures are similar to those being pushed by the Republicans in the US, with a sharp-cut back in government expenditures and in particular cuts in expenditures that provide support to the poor, accompanied by cuts in corporate taxes and more recently cuts in the top tax rates on the rich.
  • But while the Conservative Party argument for the UK austerity program was that this would lead to growth and to a reduction in government debt ratios, it is widely acknowledged now that the downturn that resulted from the austerity measures instead means that the program failed in terms of its originally stated objectives.  The austerity measures did not lead to an acceleration of growth, but rather to stagnation.  (And note that while there was an uptick in GDP by one percentage point in the third quarter of 2012, this has been attributed to the stimulus in spending resulting from the staging of the 2012 Olympics in London.  Indeed, the Bank of England in November, in its official forecast for the economy, noted GDP could fall back again in the fourth quarter of 2012 and downgraded its expected growth in 2013 to only 1%.)
  • Germany appears to be an exception, with a path followed for GDP above that of the US, although with a narrowing since mid-2011.  But while Germany has argued most strenuously and forcefully on the need for other European countries to follow austerity policies, its own internal government spending policies have been expansionary.  This is surprising given its rhetoric, and will be reviewed in a separate post on this blog which will be prepared after this one.  And it is also important to note that even with this performance, German GDP was only 2% higher in the third quarter of 2012 than it was in the first quarter of 2008, for a compound growth rate of only 0.4% per annum over four and a half years.
  • Each country has its own story, and it is not possible to review them all here.  But it is clear that for the Eurozone area as a whole, as well as for the UK but with the exception of Germany (which kept to expansionary government spending), the austerity programs launched in 2010 and 2011 have led to stagnation at best and falling output for most.

C.  Southern Europe and Ireland

There are two other groups of European economies where the response to austerity programs is of interest.  The first is the group of mostly Southern European economies were strict austerity policies were imposed as conditions of support programs from the IMF and the rest of Europe.  Funds were lent in these programs to those governments to enable them to continue to repay their creditors (who were in large part banks from Northern Europe).  This is the group affectionately known as the PIIGS, for Portugal, Italy, Ireland, Greece, and Spain.

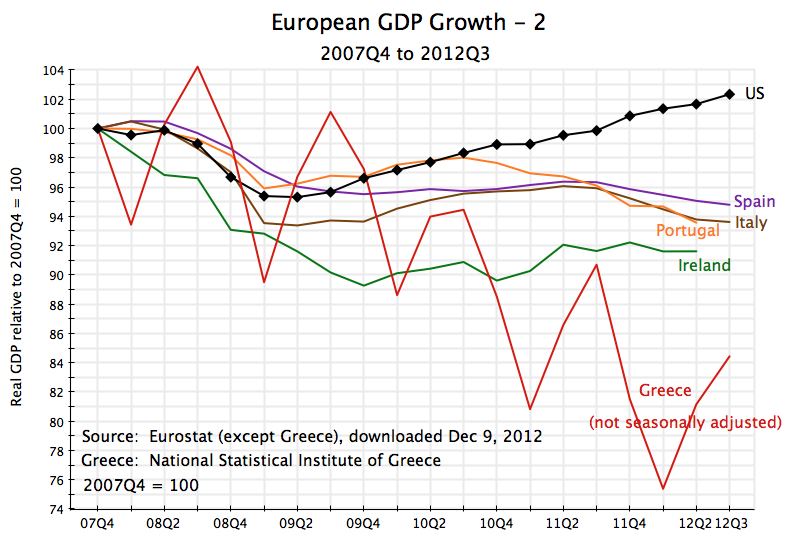
The austerity measures led to collapses in output.  (A seasonally adjusted series is not available for Greece, but its path is clear.):

Europe GDP Growth, 2007Q4 to 2012Q3 - 2

D.  The Baltics

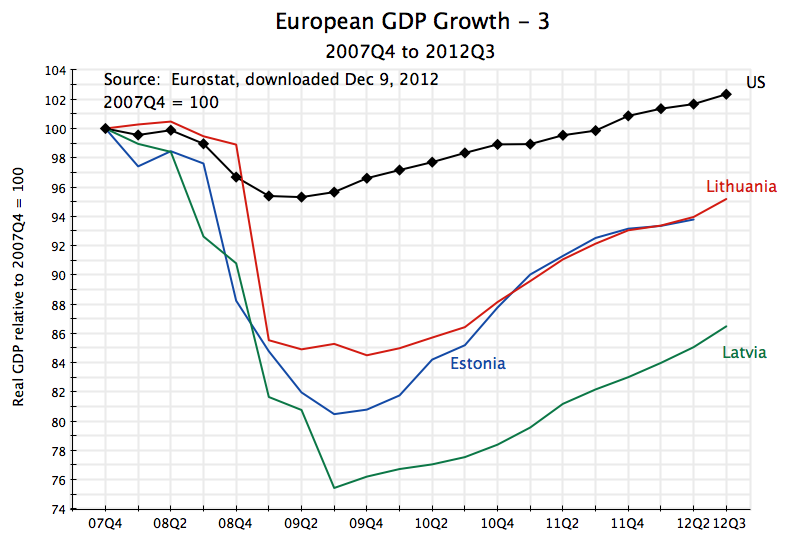
The other group of interest is the three small Baltic countries:  Estonia, Latvia, and Lithuania.  They were each severely impacted by the 2008/09 financial collapse, and each responded with stern austerity programs.  With strong growth over the last three years in each of them, these countries are sometimes held as examples of how austerity programs can lead to growth.  But this ignores the depth of the downturns that resulted from their austerity measures.  From the fourth quarter of 2007 to their troughs in 2009, GDP fell by 15% in Lithuania, by almost 20% in Estonia, and by an astounding 25% in Latvia.  There has been growth since then, but their current output remains far below where it was in 2007:

Europe GDP Growth, 2007Q4 to 2012Q3 - 3

Some have argued that the countries had no choice.  Estonia is a member of the Eurozone, and could not as a result depreciate an independent currency without leaving the Eurozone.  As in the other Eurozone members, monetary policy for Estonia is determined centrally by the European Central Bank, and fiscal policy is constrained by the extent to which the country will be able to borrow in the financial markets to finance any deficits.  But as noted above, the aim here is not to ascertain whether or not the countries had any policy choice on whether to follow some austerity program (or how severe that austerity program should have been), but rather what the impacts on growth have been of the austerity programs followed.  And the impacts have been negative.

Lithuania and Latvia had more scope in terms of policies they could have followed, since their currencies, while tied (by government decision) to some rate vis-a-vis the euro, are still independent currencies.  The governments could have chosen to devalue these currencies, which would have spurred their exports.  However, they decided not to, and instead decided to follow programs of severe fiscal austerity.  Output collapsed.

E.  Unemployment

The fall in output resulting from the austerity measures is bad enough by itself.  The loss in output is a loss in real resources, which could have been used for productive purposes.  But the tragedy is in fact much worse, as the pain from falling output is not spread evenly over the population, but rather is concentrated among a few.  In particular, those who lose their jobs and become unemployed see a drop not only in their current living standards, but for many also a permanent loss in their real standard of living, and for all a psychological burden as well.

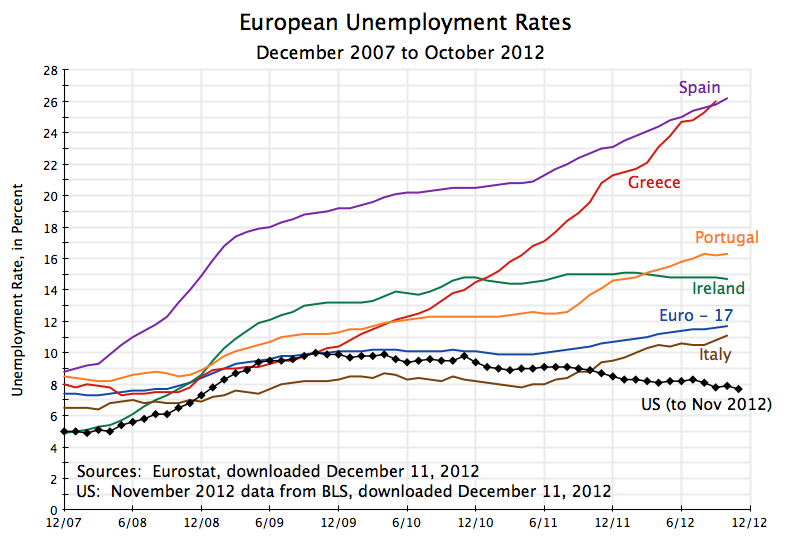
It is therefore tragic to see how unemployment rates have risen, to almost 12% for the Eurozone as a whole, and to 26% in Spain and Greece following their particularly severe austerity programs:

European Unemployment Rates, Dec 2007 to Oct 2012F.  Conclusion

The austerity programs implemented in Europe killed the recoveries which were underway in 2009/2010, and led to double-dip recessions.  Unemployment had started to decline in the Eurozone area as a whole, but then rose following the new austerity programs, reaching a rate of almost 12% recently.  The US economy has so far fared better, with positive growth and a decline in the unemployment rate from a peak of 10.0% to a rate of 7.7% in November 2012.

But there is now the strong danger that if the negotiations under the threat of the fiscal cliff leads to new austerity measures, with expenditure cuts and tax increases starting in 2013 in order to reduce rapidly the federal fiscal deficit, that the consequences in the US will be similar to that which has been seen in Europe.