Inflation in Obama’s First Term: The Lowest in a Half Century

Inflation During Presidential Terms, 1953-2012

One of the most persistent criticisms of Obama and the economic policies followed during his term as president is that they would inevitably lead to high inflation, or indeed hyperinflation according to some.  The argument was that high deficits, driven by high government spending (even though government spending has in fact been coming down, see my previous blog postings here and here), plus the aggressive actions taken by the Fed to help the economy recover from the 2008 collapse, were boosting government debt and the money supply, and this would inevitably lead to soaring inflation.

The arguments have been made not only by conservative politicians and political pundits (see here and here for examples), but also by conservative economists such as John Taylor and Michael Boskin, both full professors at Stanford, who served in high positions in the administrations of Bush, Jr. and Bush, Sr. (respectively), and who also both served as senior advisors to Mitt Romney during his recent presidential campaign.  For examples of some of their non-academic writings on the issue (some co-authored with Congressman Paul Ryan), see here, here, here, and here.  John Taylor has indeed like to joke that the US is heading down the hyperinflationary path of Zimbabwe, and carries around a hundred trillion Zimbabwe dollar note in his wallet (as does Paul Ryan) to show people what may soon happen to the US.  And the forecasts that Obama’s policies will lead to soaring inflation continue.

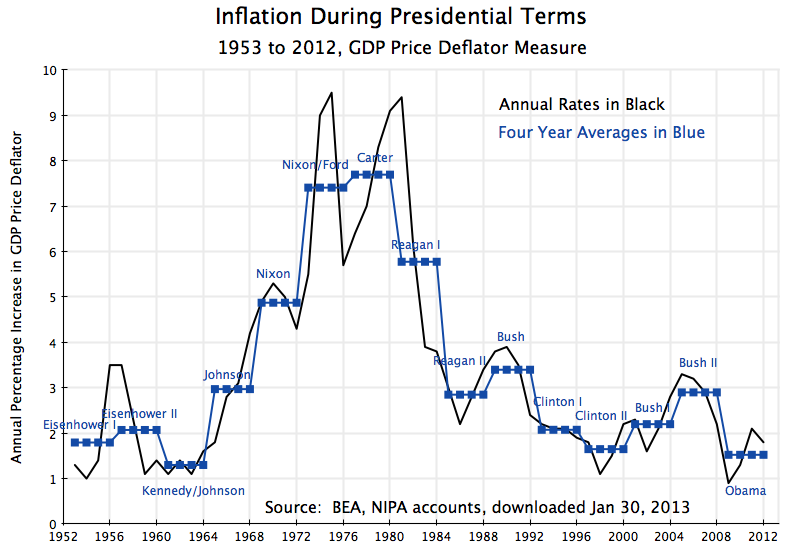
The forecasts were that soaring inflation would soon be upon us.  But nothing could be further from the truth.  We now have data for the full four years of Obama’s first term, and can compare inflation during this period to that of other presidents.  The graph above shows that average inflation over the four years of Obama’s presidency was the lowest of any presidential term going back a half century to the 1961-64 term of Kennedy/Johnson.  It was substantially lower than inflation during Bush’s two terms, was also somewhat below inflation during Clinton’s two terms (when inflation was less than during Bush), and so on back to Kennedy/Johnson.

The inflation measure graphed above is the GDP price deflator.  This is the most broad-based measure of inflation for the economy as all goods or services produced or used in the economy are covered, weighted by the value of what was used.  One could alternatively have used the price deflator from the GDP accounts for just the personal consumption component of GDP, but the results would have been the same:  inflation by this measure was less under Obama than under any presidency going back to Kennedy/Johnson.  And similarly, one could also have used the consumer price index, the common measure of inflation of goods and services used by households, and again have found the same results.

Inflation during Obama’s first term averaged 1.5% a year (as measured by the price deflator for GDP, and also 1.5% a year as measured by the deflator for the personal consumption component of GDP).  Will it stay so low?  Hopefully not.  The Fed indeed now targets inflation to be about 2% a year, so average inflation during Obama’s first term has been below that target (although close to it in 2011 and 2012:  see the graph above).  With the economy still weak, some analysts have indeed argued that moderately higher inflation of perhaps 4 or 5% a year would help the economy to recover more quickly.  Prominent proponents of such a higher target include Professor Paul Krugman (see here and here) and Olivier Blanchard, the chief economist of the IMF (see here).

Inflation can thus be expected to rise above what it has been, and indeed there would be benefits were it to rise to a still modest level such as 4 or 5% for a period.  But inflation over Obama’s presidency up to now has been exceptionally low, and the forecasts by the conservative politicians, pundits, and even some economists that Obama’s policies would quickly lead to soaring inflation could not have been more wrong.

The Job Record in Obama’s First Term: Private Jobs Grew, and Government Jobs Were Cut

Cumul Private Job Growth from Inauguration, to Jan 2013

Cumul Govt Job Growth from Inauguration, to Jan 2013

With the recent release by the Bureau of Labor Statistics of the January job numbers, we can now look at the job record of Obama over his full first term, and compare it to that in the first term of Bush or others.  These new BLS numbers also reflect the impact of the re-benchmarking revisions (done each year at this time), which we noted in a post on this blog in October would likely show a substantial upward revision in the private job estimates in 2012, along with a substantial downward revision in the government job estimates.  The graphs above reflect these new numbers, and show cumulative job growth, private and government, over the full first terms of Obama and Bush.

Mitt Romney and his fellow Republicans repeatedly charged in the recent campaign that private job creation plummeted under Obama, while he boosted government spending and jobs for bureaucrats.  The exact opposite happened.  Private jobs were indeed plummeting when Obama took the oath of office in January 2009, as he inherited the economic crisis that had begun in the last year of Bush.  But through the stimulus package and other measures (including in particular aggressive action by the Fed), he was able to turn this around quickly.  The economy started to grow again six months after he took office, and private jobs began to grow a year after he took office (see the top graph above).  Private job growth has continued at a fairly steady rate since, and by the time Obama took the oath of office for his second term, there were over 1.9 million more workers employed in private sector jobs than when he took the oath of office for his first term.  More significantly, there were 6.1 million more private sector jobs when Obama ended his first term term than there were at the trough a year after he took office.  And as the graph above shows, the pace of new private job creation has not slowed since that trough three years ago.

In contrast to the Obama record, private jobs fell during the first term of George W. Bush.  There were 950,000 fewer workers employed in private jobs when Bush started his second term than when he started his first.  They were also not plummeting when he first took office, as they had been under Obama, but only started to fall a few months later.  They then continued to fall for the first two and a half years of his term before finally starting to rise.  And when they finally started to rise, they grew at a slower pace (102,000 per month) for the last year and a half of Bush’s first term, than they did (at a pace of 170,000 per month) over the final three years of Obama’s first term.

Yet Republicans continue to argue that the policies under Bush, of tax cuts and lax or no proper regulation, are necessary to support the “job creators” and lead them to create private sector jobs.  The record shows that the approach followed under Obama was far more successful.

Government jobs followed a very different pattern.  Government jobs (at all levels of government, including state and local) grew by 900,000 over the four years of Bush’s first term, but they fell by 720,000 over the four years of Obama’s first term.  This is a net difference of 1.62 million jobs.  (The sharp peak in quarter 16 was due to hiring to fill temporary jobs for the decennial census.  Government jobs soon returned to their previous declining path as these census jobs ended.)

With a current labor force in the US of 156 million, the simple direct impact, had one allowed government jobs to have grown during Obama’s term as they had during Bush’s first term (the net difference of 1.62 million jobs), would have been to reduce the unemployment rate by 1.0%.  That is, the direct impact would have been to reduce the unemployment rate to 6.9% from the current 7.9%.

But there would also have been indirect impacts, as the newly employed government workers would have purchased goods and services with their new income, which would have in turn employed workers to produce those goods and services.  With a conservative estimate of this multiplier at two, unemployment would now be at 5.9%, which is within the range of 5 to 6% unemployment which is generally considered to be full employment (unemployment will never be zero).

There would of course also be a budgetary cost to employing more government workers.  But it is not that much.  Using BLS data on the average total compensation costs (including benefits) for government workers, employing an additional 1.62 million public sector workers would cost $140 billion per year.  While significant, this is only 2.5% of the $5.7 trillion that government spends each year (at all government levels) in the US currently.  Furthermore, the net impact on the budget will be a good deal less as there will be increased tax revenues generated as more people are employed (both directly and indirectly).

The still high unemployment in the US can therefore be accounted for by the decline in government employment during Obama’s first term.  Had government jobs been allowed to grow as they had under Bush, we would now be at, or at least close to, full employment.  Furthermore, while the calculations here use the growth of government employment during Bush’s first term as the benchmark, that growth of 900,000 government workers under Bush was not out of the ordinary.  Government employment grew by a bit less during Clinton’s first term (by 690,000), but by more during the term of Bush’s father (by 1,240,000).  Government employment also grew by 850,000 during Bush’s second term.

One would expect government to grow in an economy that is growing with a population that is growing.  The growth in government employment during Bush’s first (and second) terms was not unusual nor was it inappropriate.  Rather, what was unprecedented was the sharp fall during Obama’s first term.  Never before in US history (at least as far back as 1939, when the BLS statistics start) has government employment fallen by so much during a presidential term.  The only instance that can rival it is the fall after World War II during the 1945-49 term, when government employment fell by half as much as it had under Obama (by 360,000 then, vs. by 720,000 under Obama).

The sharp cut-back in government jobs under Obama is therefore historic.  It can account for the still high rate of unemployment.  It would not cost that much to hire back the school teachers, health care workers, policemen and firemen that have lost their jobs or have not been able to get such jobs.  Yet despite such historic cuts, Obama is still seen by conservatives as a socialist presiding over a government exploding in size.

The Recovery of Private Jobs Under Obama, versus the Fall Under Bush. And the Cuts in Government Jobs Under Obama, versus the Rise Under Bush.

Cumulative growth of private jobs, from January 2009 to September 2012 for Obama, and from January 2001 to September 2004 for Bush

Cumulative growth of government jobs, from January 2009 to September 2012 for Obama, and from January 2001 to September 2004 for Bush


[Update on February 2, 2013:  A more recent analysis of these issues, with these charts now covering the full first term of Obama, is available here.]

Private jobs have grown under President Obama while they fell during the similar period of the administration of President Bush.  And government jobs have fallen during Obama’s term while they rose under Bush.  The figures above, prepared from data from the Bureau of Labor Statistics, shows the cumulative change in the number of private and government jobs, respectively, from their inaugurations to September of the fourth year of their administrations.  This updates similar graphs and analysis posted earlier on this blog (here and here), although with a focus now on only Obama and Bush.

Obama has been heavily criticized by Republican nominee Mitt Romney and by Republicans more generally for doing a terrible job on jobs.  Their repeated theme is that the US has to return to the policies of George W. Bush of tax cuts, deregulation, and small government in order to create a “business friendly” environment in which private businessmen will then create jobs.

But as the top graph shows, private jobs have grown under Obama, in contrast to a fall under Bush.  Obama was faced with a collapsing economy when he took office, with private jobs falling by 800,000 a month as he was taking office.  He was able to turn this around within only a few months, as the stimulus package and other measures entered into effect, and jobs growth turned positive after just one year in office.  This was a strong turnaround from the sharpest downturn the US economy had faced since the Great Depression.

Since then, private job growth has continued each and every month, but at an overall pace that has been criticized.  But the pace of recovery has in fact been better than that observed under Bush, where the number of private jobs had fallen steadily for the first two and a half years into his term (and with the fall starting only after he took office, in the Spring of 2001).

Based on the current official numbers, there were about 0.5 million more private jobs in September 2012 than when Obama took office.  This already contradicts the Republican claim that Obama’s policies have been destroying jobs.  And the growth in private jobs has in fact been even higher.  The BLS recently announced their preliminary estimate that in their regular annual re-benchmarking process, the number of private jobs were 453,000 higher in March 2012 than previously estimated.  This would be an increase of 0.4% over the previous BLS estimate for private employment, and such a change is about average.  Over the eleven years of 2002 to 2012, the changes due to the annual benchmark re-estimates have ranged between 0.1% and 0.9% (in absolute terms) – sometimes positive and sometimes negative.  The BLS has not yet revised their job estimates reflecting this new benchmark; this will be done in early February 2013, when the revisions will be announced along with the January 2013 job figures.

Based on the pattern observed in the previous annual re-benchmarking exercises, the March figure is likely to change by about the amount of the benchmark change (it will not be exactly the same for a number of reasons), with changes before that reaching back into 2011 diminishing as one goes back to the previous March 2011 benchmark period, and the changes increasing as one goes forward in 2012 from the March 2012 benchmark.

Until the new analysis is done by the BLS experts and the standard models run, there is no way to say what the changes will be.  For the diagrams above, I have very simplistically simply raised each of the 2012 private job estimates by 453,000, to give one a visual sense of the magnitude of the change.  In reality, the increase will be phased in rather than jump abruptly as depicted, but it is not yet known how it will be phased in so I have not tried to show this.

Based on this simple assumption, private jobs during Obama’s term from his inauguration to September 2012 have increased by about 1.0 million.  During the similar period under Bush, private jobs fell by 1.5 million.  Yet Obama is criticized for his job growth record, while Bush is praised.

Furthermore, since the turnaround in jobs that Obama was able to achieve after just one year in office, private jobs have increased by 4.7 million based on the current official estimates, or by 5.2 million with the adjustment made for the new benchmark

While private jobs have grown under Obama (in contrast to the fall under Bush), government jobs have fallen under Obama (and grew under Bush).  Again, this contradicts the repeated Republican charge that Obama has presided over an explosion of government jobs and government spending, which is simply not true.  (Note that the temporary blip seen in the 16th month after Obama’s inauguration is the temporary hiring for the 2010 census.  After a few months, government jobs returned to their previous path of decline.)

As seen in the figure above, government jobs have fallen by 575,000 during Obama’s term up through September 2012, using the current official BLS estimates.  But the BLS benchmark revision, discussed above, estimates that there were 67,000 fewer government jobs in March 2012 than previously estimated.  Adding this as a simple adjustment, government jobs fell by 642,000 during Obama’s term in office so far.  Keep in mind that these are primarily state and local government jobs, as they account for 87% of government jobs in the US.  But federal jobs have been flat over this period with no sharp increase either, and fell if one excludes an increase in the number of Defense Department employees.

And in contrast to the fall in government jobs during Obama’s tenure, government jobs rose during the similar Bush period.  Between his inauguration in January 2001 and September 2004, government jobs rose by 800,000 under Bush.  There would be over 1.4 million additional jobs (mostly of school teachers, police, and other state and local workers) due to the direct impact alone if government jobs had been allowed to grow as they had under Bush rather than fall as they have under Obama.  With a multiplier of two, there would be 2.8 million more jobs, and unemployment would be 6.0% instead of 7.8%.  Unemployment would then be at the top end of what is generally considered to be the full employment range of unemployment (which will never be zero, due to turnover and other frictions).

The myth is therefore quite different from the reality.  Government jobs have been cut back during Obama’s term, and this has acted as a considerable drag on the economy.  If government jobs had been allowed to increase during Obama’s term by as much as they had under Bush, we would now be at, or close to, full employment  (see some further estimates at this blog posting).  Yet Republicans continue to call for further and drastic cut-backs in government, with no recognition that there have already been sharp cuts and that these cuts have held back the pace of recovery.