

A. Introduction
According to a recent report in the Washington Post, a significant and increasing number of state public officials and politicians are advocating for a change in the tax system the US uses to support highway building and maintenance. The current system is based on a tax on gallons of fuel burned, and the proposed new system would be based on the number of miles a car is driven. At least four East Coast states are proposing pilots on how this might be done, some West Coast states have already launched pilots, and states are applying for federal grants to consider the change. There is indeed even a lobbying group based in Washington now advocating it: The Mileage-Based User Fee Alliance.
There is no question that the current federal gas tax of 18.4 cents per gallon of gasoline is woefully inadequate. It was last changed in 1993, 23 years ago, and has been kept constant in nominal terms ever since. With general prices (based on the CPI) now 65% higher, 18.4 cents now will only buy 11.2 cents at the prices of 1993, a decline of close to 40%. As a result, the Highway Trust Fund is terribly underfunded, and with all the politics involved in trying to find other sources of funding, our highways are in terrible shape. Basic maintenance is simply not being done.
An obvious solution would be simply to raise the gas tax back at least to where it was before in real terms. Based on where the tax was when last set in 1993 and on the CPI for inflation since then, this would be 30.3 cents per gallon now, an increase of 11.9 cents from the current 18.4 cents per gallon. Going back even further, the gasoline tax was set at 4 cents per gallon in 1959, to fund the construction of the then new Interstate Highway system (as well as for general highway maintenance). Adjusting for inflation, that tax would be 32.7 cents per gallon now. Also, looking at what the tax would need to be to fund adequately the Highway Trust Fund, a Congressional Budget Office report issued in 2014 estimated that a 10 to 15 cent increase (hence 28.4 cents to 33.4 cents per gallon) would be needed (based on projections through 2024).
These fuel tax figures are all similar. Note also that while some are arguing that the Highway Trust Fund is underfunded because cars are now more fuel efficient than before, this is not the case. Simply bringing the tax rate back in real terms to where it was before (30.3 cents based on the 1993 level or 32.7 cents based on the 1959 level) would bring the rate to within the 28.4 to 33.4 cents range that the CBO estimates is needed to fully fund the Highway Trust Fund. The problem is not fuel efficiency, but rather the refusal to adjust the per gallon tax rate for inflation.
But Congress has refused to approve any such increase. Anti-tax hardliners simply refuse to consider what they view as an increase in taxes, even though the measure would simply bring them back in real terms to where they were before. And it is not even true that the general population is against an increase in the gas tax. According to a poll sponsored by the Mineta Transportation Institute (a transportation think tank based at San Jose State University in California), 75% of those polled would support an immediate increase in the gas tax of 10 cents a gallon if the funds are dedicated to maintenance of our streets, roads, and highways (see the video clip embedded in the Washington Post article, starting at minute 3:00).
In the face of this refusal by Congress, some officials are advocating for a change in the tax, from a tax per gallon of fuel burned to a new tax per mile each car is driven. While I do not see how this would address the opposition of the anti-tax politicians (this would indeed be a totally new tax, not an adjustment in the old tax to keep it from falling in real terms), there appears to be a belief among some that this would be accepted.
But even if such a new tax were viewed as politically possible, it would be an incredibly bad public policy move to replace the current tax on fuel burned with such a tax on miles driven. It would in essence be a tax on fuel efficiency, with major distributional (as well as other) consequences, favoring those who buy gas guzzlers. And as it would encourage the purchase of heavy gas guzzlers (relative to the policy now in place), it would also lead to more than proportional damage to our roads, meaning that road conditions would deteriorate further rather than improve.
This blog post will discuss why such consequences would follow. To keep things simple, it will focus on the tax on gasoline (which I will sometimes simply referred to as gas, or as fuel). There are similar, but separate taxes, on diesel and other fuels, and their levels should be adjusted proportionally with any adjustment for gasoline. There is also the issue of the appropriate taxes to be paid by trucks and other heavy commercial vehicles. That is an important, but separate, issue, and is not addressed here.
B. The Proposed Switch Would Penalize Fuel Efficient Vehicles
The reports indicate that the policy being considered would impose a tax of perhaps 1.5 cents per mile driven in substitution for the current federal tax of 18.4 cents per gallon of gas burned (states have their own fuel taxes in addition, with these varying across states). For the calculations here I will take the 1.5 cent figure as the basis for the comparisons, even though no specific figure is as yet set.
First of all, it should be noted that at the current miles driven in the country and the average fuel economy of the stock of cars being driven, a tax of 1.5 cents per mile would raise substantially more in taxes than the current 18.4 cents per gallon of gas. That is, at these rates, there would be a substantial tax increase.
Using figures for 2014, the average fuel efficiency (in miles per gallon) of the light duty fleet of motor vehicles in the US was 21.4 miles per gallon, and the average miles driven per driver was 13,476 miles. At a tax of 1.5 cents per mile driven, the average driver would pay $202.14 (= $.015 x 13,476) in such taxes per year. With an average fuel economy of 21.4 mpg, such a driver would burn 629.7 gallons per year, and at the current fuel tax of 18.4 cents per gallon, is now paying $115.87 (= $.184 x 629.7) in gas taxes per year. Hence the tax would rise by almost 75% ($202.14 / $115.87). A 75% increase would be equivalent to raising the fuel tax from the current 18.4 cents to a rate of 32.1 cents per gallon. While higher tax revenues are indeed needed, why a tax on miles driven would be acceptable to tax opponents while an increase in the tax per gallon of fuel burned is not, is not clear.
But the real reason to be opposed to a switch in the tax to miles driven is the impact it would have on incentives. Taxes matter, and affect how people behave. And a tax on miles driven would act, in comparison to the current tax on gallons of fuel burned, as a tax on fuel efficiency.
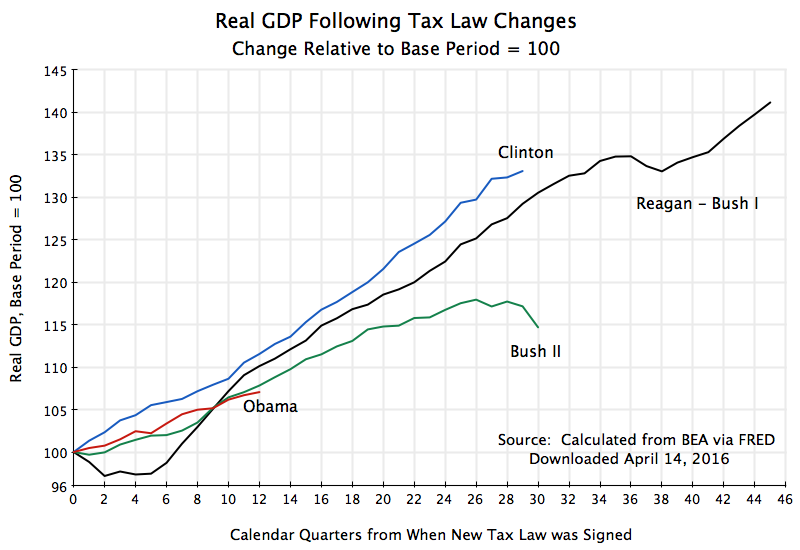
The chart at the top of this post shows how the tax paid would vary across cars of different fuel efficiencies. It would be a simple linear relationship. Assuming a switch from the current 18.4 cents per gallon of fuel burned to a new tax of 1.5 cents per mile driven, a driver of a highly fuel efficient car that gets 50 miles per gallon would see their tax increase by over 300%! A driver of a car getting the average nation-wide fuel efficiency of 21.4 miles per gallon would see their tax increase by 75%, as noted above (and as reflected in the chart). In contrast, someone driving a gas guzzler getting only 12 miles per gallon or less, would see their taxes in fact fall! They would end up paying less under such a new system based on miles driven than they do now based on gallons of fuel burned. Drivers of luxury sports cars or giant SUVs could well end up paying less than before, even with rates set such that taxes on average would rise by 75%.
Changing the tax structure in this way would, with all else equal, encourage drivers to switch from buying fuel efficient cars to cars that burn more gas. There are, of course, many reasons why someone buys the car that they do, and fuel efficiency is only one. But at the margin, changing the basis for the tax to support highway building and maintenance from a tax per gallon to a tax on miles driven would be an incentive to buy less fuel efficient cars.
C. Other Problems
The change to a tax on miles driven from the tax on gallons of fuel burned would have a number of adverse effects:
a) A Tax on Fuel Efficiency: As noted above, this would become basically a tax on fuel efficiency. More fuel efficient cars would pay higher taxes relative to what they do now, and there will be less of an incentive to buy more fuel efficient cars. There would then be less of an incentive for car manufacturers to develop the technology to improve fuel efficiency. This is what economists call a technological externality, and we all would suffer.
b) Heavier Vehicles Cause Far More Damage to the Roads: Heavier cars not only get poorer gas mileage, but also tear up the roads much more, leading to greater maintenance needs and expense. Heavier vehicles also burn more fuel, but there is a critical difference. As a general rule, vehicles burn fuel in proportion with their weight: A vehicle that weighs twice as much will burn approximately twice as much fuel. Hence such a vehicle will pay twice as much in fuel taxes (when such taxes are in cents per gallon) per mile driven.
However, the heavier vehicle also cause more damage to the road over time, leading to greater maintenance needs. And it will not simply be twice as much damage. A careful early study found that the amount of damage from a heavier vehicle increases not in direct proportion to its weight, but rather approximately according to the fourth power of the ratio of the weights. That is, a vehicle that weighs twice as much (for the same number of axles distributing the weight) will cause damage equal to 2 to the fourth power (=16) times as much as the lighter vehicle. Hence if they were to pay taxes proportionate to the damage they do, a vehicle that is twice as heavy should pay 16 times more in taxes, not simply twice as much.
(Note that some now argue that the 2 to the fourth power figure found before might be an over-estimate, and that the relationship might be more like 2 to the third power. But this would still imply that a vehicle that weighs twice as much does 8 times the damage (2 to the third power = 8). The heavier vehicle still accounts for a grossly disproportionate share of damage to the roads.)
A tax that is set based on miles driven would tax heavy and light vehicles the same. This is the opposite of what should be done: Heavy vehicles cause far more damage to the roads than light vehicles do. Encouraging heavy, fuel-thirsty, vehicles by switching from a tax per gallon of fuel burned to a tax per mile driven will lead to more road damage, and proportionately far more cost than what would be collected in highway taxes to pay for repair of that damage.
c) Impact on Greenhouse Gases: One also wants to promote fuel efficiency because of the impact on greenhouse gases, and hence global warming, from the burning of fuels. By basic chemistry, carbon dioxide (CO2) is a direct product of fuel that is burned. The more fuel that is burned, the more CO2 will go up into the air and then trap heat. Economists have long argued that the most efficient way to address the issue of greenhouse gases being emitted would be to tax them in proportion to the damage they do. A tax on gallons of fuel that are burned will do this, while a tax on miles driven (and hence independent of the fuel efficiency of the vehicle) will not.
An interesting question is what level of gasoline tax would do this. That is, what would the level of fuel tax need to be, for that tax to match the damage being done through the associated emission of CO2. The EPA has come up with estimates of what the social cost of such carbon emissions are (and see here for a somewhat more technical discussion of its estimates). Unfortunately, given the uncertainties in any such calculations, as well as uncertainty on what the social discount rate should be (needed to discount costs arising in the future that follow from emitting greenhouse gases today), the cost range is quite broad. Hence the EPA presents figures for the social cost of emitting CO2 using expected values at alternative social discount rates of 2.5%, 3%, and 5%, as well as from a measure of the statistical distribution of one of them (the 95th percentile for the 3% discount rate, meaning there is only an estimated 5% chance that the cost will be higher than this). The resulting costs per metric ton of CO2 emitted then range from a low of $11 for the expected value (the 50th percentile) at the 5% discount rate, $36 at the expected value for the 3% discount rate, and $56 for the expected value for the 2.5% discount rate, to $105 for the 95th percentile at a 3% discount rate (all for 2015).
With such range in social costs, one should be cautious in the interpretation of any one. But it may still be of interest to calculate how this would translate into a tax on gasoline burned by automobiles, to see if the resulting tax is “in the ballpark” of what our fuel taxes are or should be. Every gallon of gasoline burned emits 19.64 pounds of CO2. There are 2,204.62 pounds in a metric ton, so one gallon of gas burned emits 0.00891 metric tons of CO2. At the middle social cost of $36 per metric ton of CO2 emitted (the expected value for the 3% social discount rate scenario), this implies that a fuel tax of 32.1 cents per gallon should be imposed. This is surprisingly almost precisely the fuel tax figure that all the other calculations suggest is warranted.
d) One Could Impose a Similar Tax on Electric Cars: One of the arguments of the advocates of a switch from taxes on fuel burned to miles driven is that as cars have become more fuel efficient, they pay less (per mile driven) in fuel taxes. This is true. But as generally lighter vehicles (one of the main ways to improve fuel economy) they also cause proportionately far less road damage, as discussed above.
There is also an increasing share of electric, battery-powered, cars, which burn no fossil fuel at all. At least they do not burn fossil fuels directly, as the electricity they need to recharge their batteries come from the power grid, where fossil fuels dominate. But this is still close to a non-issue, as the share of electric cars among the vehicles on US roads is still tiny. However, the share will grow over time (at least one hopes). If the share does become significant, how will the cost of building and maintaining roads be covered and fairly shared?
The issue could then be addressed quite simply. And one would want to do this in a way that rewards efficiency (as different electric cars have different efficiencies in the mileage they get for a given charge of electricity) rather than penalize it. One could do this by installing on all electric cars a simple meter that keeps track of how much it receives in power charges (in kilowatt-hours) over say a year. At an annual safety inspection or license renewal, one would then pay a tax based on that measure of power used over the year. Such a meter would likely have a trivial cost, of perhaps a few dollars.
Note that the amounts involved to be collected would not be large. According to the 2016 EPA Automobile Fuel Economy Guide (see page 5), all-electric cars being sold in the US have fuel efficiencies (in miles per gallon equivalent) of over 100 mpg, and as high as 124 mpg. These are on the order of five times the 21.4 average mpg of the US auto stock, for which we calculated that the average tax to be paid would be $202. Even ignoring that the electric cars will likely be driven for fewer miles per year than the average car (due to their shorter range), the tax per year commensurate with their fuel economy would be roughly $40. This is not much. It is also not unreasonable as electric cars are kept quite light (given the limits of battery technology) and hence do little road damage.
e) There Are Even Worse Policies That Have Been Proposed: As discussed above, there are many reasons why a switch from a tax on fuel burned to miles driven would be a bad policy change. But it should be acknowledged that some have proposed even worse. One example is the idea that there should be a fixed annual tax per registered car that would fund what is needed for highway building and maintenance. Some states in fact do this now.
The amounts involved are not huge. As was calculated above, at the current federal gasoline tax of 18.4 cents per gallon, the driver of a car that gets the average mileage (of 21.4 mpg) for the average distance a year (of 13,476 miles) will pay $115.87 a year. If the fuel tax were raised to 32.1 cents per gallon (or equivalently, if there were a tax of 1.5 cents per mile driven), the average tax paid would be still just $202.14 per year. These are not huge amounts. One could pay them as part of an annual license renewal.
But the tax structured in this way would then be the same for a driver who drives a fuel efficient car or a gas guzzler. And it would be the same for a driver who drives only a few miles each year, or who drives far more than the average each year. The driver of a heavy gas guzzler, or one who drives more miles each year than others, does more damage to the roads and should pay more to the fund that repairs such damage and develops new road capacity. The tax should reflect the costs they are imposing on society, and a fixed annual fee does not.
f) The Cost of Tax Collection Needs to be Recognized: Finally, one needs to recognize that it will cost something to collect the taxes. This cost will be especially high for a tax on miles driven.
The current system, of a tax on fuel burned, is efficient and costs next to nothing to collect. It can be charged at the point where the gasoline and other fuels leaves in bulk from the refinery, as all of it will eventually be burned. While the consumer ultimately pays for the tax when they pump their gas, the price being charged at the pump simply reflects the tax that had been charged at an earlier stage.
In contrast, a tax on miles driven would need to be worked out at the level of each individual car. And if the tax is to include shares that are allocating to different states, the equipment will need to keep track of which states the car is being driven in. As the Washington Post article on a possible tax on miles driven describes, experiments are underway on different ways this might be done. All would require special equipment to be installed, with a GPS-based system commonly considered.
Such special equipment would have a cost, both up-front for the initial equipment and then recurrent if there is some regular reporting to the center (perhaps monthly) of miles driven. No one knows right now what such a system might cost if it were in mass use, but one could easily imagine that a GPS tracking and reporting system might cost on the order of $100 up front, and then several dollars a month for reporting. This would be a significant share of a tax collection that would generate an average of just $202 per driver each year.
There is also the concern that any type of GPS system would allow the overseers to spy on where the car was driven. While this might well be too alarmist, and there would certainly be promises that this would not be done, some might not be comforted by such promises.
D. Conclusion
While one should always consider whether given policies can be changed for the better, one needs also to recognize that often the changes proposed would make things worse rather than better. Switching the primary source of funding for highway building and maintenance from a tax on fuel burned to a tax on miles driven is one example. It would be a stupid move.
There is no doubt that the current federal tax on gasoline of 18.4 cents per gallon is too low. The result is insufficient revenues for the Highway Trust Fund, and we end up with insufficient road capacity and roads that are terribly maintained.
What I was surprised by in the research for this blog post was finding that a wide range of signals all pointed to a similar figure for what the gasoline tax should be. Specifically:
- The 1959 gas tax of 4 cents per gallon in terms of current prices would be 32.7 cents per gallon;
- The 1993 gas tax of 18.4 cents per gallon in terms of current prices would be 30.3 cents per gallon;
- The proposal of a 1.5 cent tax per mile driven would be equivalent (given current average car mileage and the average miles driven per year) to 32.1 cents per gallon;
- The tax to offset the social cost of greenhouse gas emissions from burning fuel would be (at a 3% social discount rate) 32.1 cents per gallon.
- The Congressional Budget Office projected that the gasoline tax needed to fully fund the Highway Trust Fund would be in the range of 28.4 to 33.4 cents per gallon.
All these point in the same direction. The tax on gasoline should be adjusted to between 30 and 33 cents per gallon, and then indexed for inflation.


You must be logged in to post a comment.