
Employment Growth: Positive, but Still Sluggish

US employment, monthly change, private and government, December 2005 to September 2012

The Bureau of Labor Statistics released this morning its regular monthly report on employment and unemployment.  There will be one more such report on Friday, November 2, but this will be just a few days prior to the November 6 election.  The current report will likely be more heavily scrutinized, and commented upon, in the period leading up to the election.

The report indicates that while employment growth in the US remains positive, it remains sluggish.  The estimate is that total employment rose by 114,000, of which 104,000 were private jobs, and 10,000 were government jobs.  While positive, this is less than the estimated 200,000 to 250,000 new jobs required each month which this blog has indicated  in an earlier post needs to be sustained for unemployment to fall on a consistent basis.

This estimate of 114,000 new jobs is less than the revised estimates of net new jobs created in July and August.  All the estimates are preliminary for the most recent two months, as the BLS revises the estimates as new numbers come in through the regular reporting system.  The July and August net new jobs estimates were revised upwards to 181,000 in July (from an estimate of 141,000 last month) and to 142,000 in August (from an estimate of 96,000 last month), for a net addition of 86,000 jobs over these two months over what was estimated before.

Almost all of the revisions were in the figures on government jobs, to growth of 18,000 in July (versus a decline of 21,000 estimated before) and growth of 45,000 in August (versus a decline of 7,000 estimated before).  But government jobs remain depressed:  Despite the recent growth, as of September 2012 there were 575,000 fewer government jobs than when Obama took office in January 2009 (mostly at the state and local level, as they account for 87% of government jobs in the US).  As this blog has noted before, if government jobs had been allowed to grow in the downturn following the 2008 collapse as they had in previous downturns (including in particular when Reagan was in office) or as they had when Bush, Jr., was in office, we would now be at, or close to, full employment.

Despite the disappointing growth in total jobs in September (of just 114,000), it is interesting and encouraging that the estimated unemployment rate fell sharply, to 7.8% from the previous 8.1%.  How could this be?  It is important to remember that the estimated employment figure comes from a survey of about 140,000 business establishments (including government agencies and non-profit entities), while the unemployment estimate comes from a separate survey of 60,000 households.  There are significant differences between the two surveys, both statistical and conceptual.  Statistically, they are both estimates taken from samples.  Conceptually, they measure different things:  The household survey asks the household if they (and other household members) are employed, including as self-employed, as unpaid family labor, as private household workers, or in farm work.  The business survey excludes farm workers, and the others (the self-employed, etc.) will be excluded as well as they are not employed in business establishments.  But if a person has two jobs, the business survey will count them as holding two different jobs, while the household survey will merely record them once, as employed.

Bearing this in mind, it is still interesting that the household survey estimated that the number of employed jumped by 873,000 in September (the biggest such jump since 2003), while the business survey only estimated an additional 114,000 were employed.  Analysts generally discount the employment estimate from the household survey, as it is subject to greater statistical fluctuation (due not only to the smaller sample size, but more importantly since the business establishments surveyed will have many workers generally, while households will generally have only one or two workers).  The household estimates bounce around a good deal more.

But still, a jump of 873,000 employed in one month is a lot.  In part, this was a bounce back from estimated negative growth in the number employed in the household survey in July and August (of -195,000 in July and -119,000 in August).  It also suggests that the creeping up of the unemployment rate in recent months (from 8.1% in April, rising to 8.3% in July) may have been an aberration.  The 7.8% rate of September indicates a return to the previous trend.  And the 7.8% figure may have some political significance as that was the unemployment rate in January 2009 when Obama took office, although rising rapidly at that time until the stimulus program and other measures were able to turn it around.

There are also indications that the recent employment estimates from the business establishment survey may have been low.  First, there was a BLS announcement on September 27 that the preliminary estimate in its regular annual re-benchmarking analysis was that employment in March 2012 was 386,000 higher than previously estimated.  This will be further analyzed still, and the employment figures shown above do not yet reflect this new estimate for the benchmark.  Re-estimated figures for 2011 and 2012 will be provided, as they always are, when the January 2013 employment report is issued on the first Friday of February.  With the new benchmark estimate, they will show that employment levels, as well as employment growth, has been considerably higher in the latter part of 2011 and into 2012 than is being currently estimated.

Second, one can compare the estimates on the growth in the number of employed from the household survey to the number of employed from the business survey.  As noted above, the two surveys measure slightly different concepts.  But over time one would expect that they will move together, with the ratio of one to the other close to constant, although with month to month volatility.

A reasonable time span to look at would be the averages over a year, such as between September 2011 and September 2012.  Over this time period, the household survey indicated employment grew by an average of 238,900 per month, while the business survey indicated employment growth of just 150,500 per month.  Once the new, higher, benchmark is incorporated into the business survey employment figures, the employment growth estimate from the business survey will move towards the higher figure suggested by the household survey.

One can also calculate what employment growth as measured in the business survey would have been in September 2012, if the ratio of employment as estimated in the household survey to employment as estimated in the business survey (keeping in mind they are measuring somewhat different things), was the same in September 2012 as it had been in September 2011.  If it were, one can calculate that employment growth as estimated by the business survey would have been an average of 223,400 per month over that period.

There are therefore indications that employment growth over the past year has been stronger than the current estimates from the business survey indicate.  It looks like employment growth over the last year might have averaged between 200,000 and 250,000 per month.  As noted above, growth in such a range is consistent with a falling (although slowly falling) rate of unemployment.  And the unemployment rate did indeed fall slowly over this period, from 9.0% in September 2011 to 7.8% in September 2012, or an average of 0.1% point per month.

There is therefore some evidence that employment growth in 2011 and so far in 2012 has been somewhat higher than currently estimated.  It has been high enough to lead to a fall in the unemployment rate to the current 7.8%.  But this progress is still disappointingly slow, as drag from cuts in fiscal expenditures (including for government employment) has held back the economy.
Employment Growth: Better, but Still Too Slow

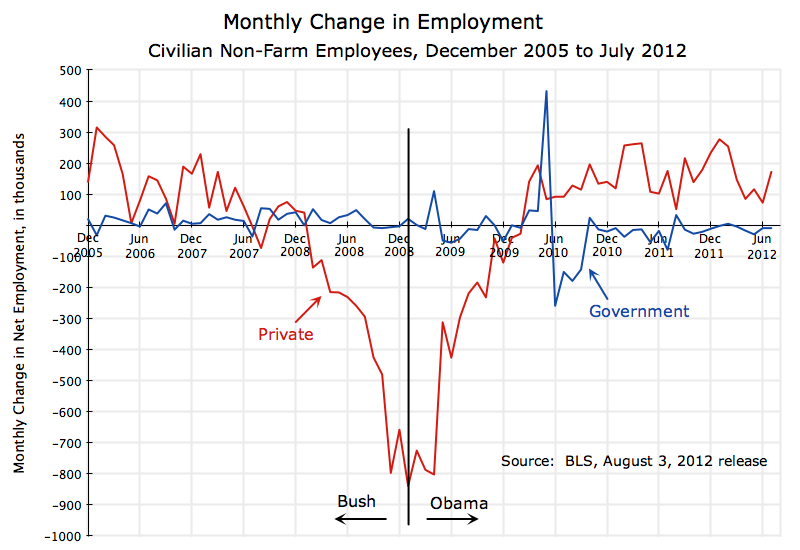
US employment, December 2005 to July 2012, monthly change, private sector and government

The Bureau of Labor Statistics released yesterday its initial estimates for unemployment and for employment growth in July (along with the normal updated estimates for earlier figures).  While generally an improvement over the numbers for the last few months, the results were still not as good as they need to be.

The unemployment rate was essentially unchanged, even though the headline number rose from 8.2% in June to 8.3% in July.  This appearance of a rise was largely due to the way the rounding off worked.  In the raw, unrounded, numbers, the calculated unemployment rate would have been 8.217% in June and 8.254% in July.  But such accuracy is spurious.  The figures come from surveys, and it is generally taken that changes of 0.1% points are not statistically significant in any case, even aside from round-off.

The growth in total net employment was 163,000.  This is a good deal better than the figures of 68,000, 87,000, and 64,000 of the previous three months (April, May, and June, respectively).  But while better than the previous abysmal numbers, growth of 163,000 jobs per month is still not sufficient to bring down unemployment on a sustainable basis.  As has been noted previously in this blog, the US needs to add between 200,000 and 250,000 jobs per month for the unemployment rate to start to fall on a consistent basis, given the US population and growth of its labor force.  At 163,000, we are short of that.

Still, it is positive growth, and is all due to growth in private employment as government continues to cut back.  The graph above shows the monthly figures on employment growth in the private sector and in government, going back to December 2005.  Private employment began to fall with the bursting of the housing bubble in early 2006, and was plummeting in 2008 at the end of the Bush Administration as the economy collapsed.  This turned around quickly under Obama, soon after the passage of the fiscal stimulus package (and supported as well by an aggressive response by the US Fed and by other actions).  The monthly loss of private jobs at first slowed and then turned to net gains by early 2010.  Since then the private sector has been consistently adding jobs.

But the growth in jobs have not been enough to bring down unemployment by enough.  While the unemployment rate has come down from its peak of 10.0% to its current 8.3%, the unemployment rate at what is considered full employment would be between 5 and 6% (5 to 6% as there is always job turnover, with some people out of jobs even at what is considered full employment).

As has been noted before in this blog, this disappointing growth in total jobs can be attributed to fiscal drag, as government has been steadily cutting back the number of government workers during the term Obama has been in office.  Most of this has been at the state and local level (as state and local government accounts for 87% of government employment in the US), but has happened at the federal level as well.

This cut back in government employment during the Obama term is in sharp contrast to the growth in government employment during the Bush terms.  We are now close enough to the end of Obama’s first term that a reasonable projection for his full first term is possible.  Using the actual numbers through July 2012, and then projecting August 2012 to January 2013 to continue at the same pace as that observed so far in 2012, one can arrive at the following estimates:

Net Job Growth Government Private
Bush:   January 2001 to January 2005 +900,000 -913,000
Obama:  January 2009 to January 2013* -711,000 +1,179,000
* August 2012 to January 2013 projected at monthly pace of January 2012 to July 2012

Government employment grew by 900,000 during Bush’s first term (it grew by a similar and further 841,000 in his second term).  In sharp contrast, at the current pace government employment will have been cut back by 711,000 in Obama’s first term.  Yet Mitt Romney and other Republicans repeatedly assert that government exploded under Obama, while they avow support for the small government conservatism of Bush.

Romney and his follow Republicans also repeatedly assert that the tax cut and deregulation policies of Bush are what is needed to restore private job growth.  Yet private jobs fell by 913,000 during Bush’s first term, while on the current pace, they will have risen by 1,179,000 during Obama’s first term.

Had government been allowed to grow during Obama’s first term at the same pace as it had during Bush’s, there would be an additional 1.6 million (900,000 + about 700,000) school teachers, policemen, firemen, and others directly employed.  The country could certainly use their services.  And by itself, employing 1.6 million more would bring down the unemployment rate to 7.2%.  With a conservative multiplier of two, the unemployment rate would be brought down to 6.2%, or close to full employment.

Obama may well lose the election due to the still high unemployment.  Romney and his fellow Republicans have repeatedly and loudly charged that this has been due to an explosion of government during Obama’s term in office.  But the truth is that government has been cut back sharply during Obama’s term.  And the great irony is that had government been allowed to grow as it had under the previous Republican administration of Bush, Obama would now be certain of re-election.

Employment in Manufacturing: Parties Do Matter

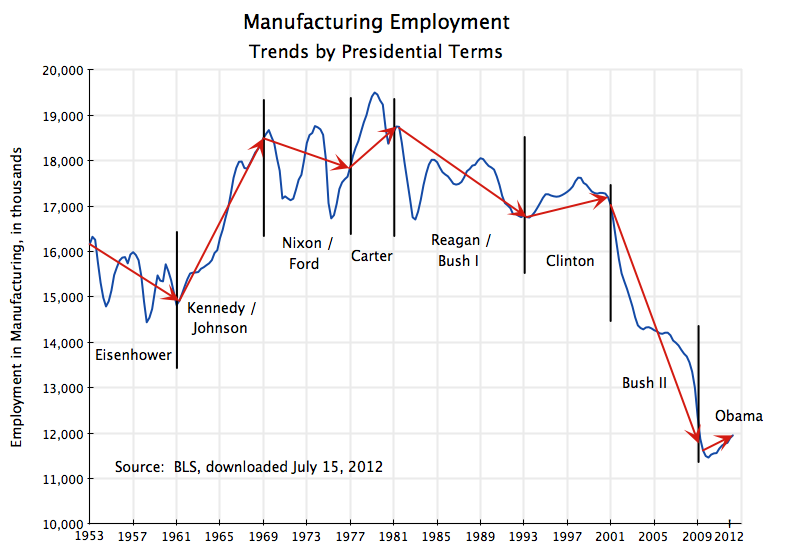
US manufacturing employment, 1953Q1 to 2012Q2, trends by Presidential terms

Manufacturing employment in the US plummeted during the term of George W. Bush, and has started to recover under Obama.  There were 27% fewer manufacturing jobs in the US when Bush left office than when he took the oath of office in January 2001, an overall loss of 4.6 million jobs in the sector.  The fall was often rapid, but what is striking is that they fell in each and every year of his administration.  And this collapse in manufacturing took place during a period when the economy grew overall.

Economists debate whether manufacturing jobs are inherently better for the economy than jobs outside manufacturing at the same wage (where the arguments center on the linkages to the rest of the economy, and on whether manufacturing experience leads to more rapid growth in technology and hence productivity or not).  But regardless of the position taken on this debate, economists agree that the sharp fall of manufacturing jobs during the Bush period was unhealthy.  Economic imbalances built up during the eight years Bush was president:  The housing bubble developed, there was an excess of consumption (and hence a fall in savings) spurred by the Bush tax cuts and by financial deregulation (easy loans), and there were the large fiscal deficits under Bush due to these tax cuts as well as spending on two major wars that were not paid for except by borrowing.  This led to record high trade deficits, appreciation of the dollar, and a manufacturing sector that could not then compete with imports.

Manufacturing jobs have begun to recover under Obama.  Such jobs were plummeting and at an accelerating pace when he took office, falling by 297,000 in January 2009 alone.  This started to turn around almost immediately after he took office (along with total employment), due to the stimulus package and other measures.  The loss of manufacturing jobs immediately started to slow, and by early 2010 started to grow for the first time since Clinton.  It is still early, but the change in trend is clear.

It is also interesting to go back further.  The figure above shows the number of jobs in manufacturing in the US going back to Eisenhower (the data is from the Bureau of Labor Statistics).  I have broken up the figure by presidential terms.  Excluding Obama (as his term is not yet complete), there have been seven presidential periods (combining terms with presidents of the same political party):  four Republican and three Democratic.  Manufacturing jobs fell in each of the Republican periods, while they rose in each of the Democratic periods.

And the pattern indeed goes back further.  Manufacturing jobs rose under Roosevelt and under Truman (even if one treats Truman as a separate period, and despite Truman taking office when war time manufacturing employment was still high).  They fell under Hoover.  One has to go back all the way to Calvin Coolidge, President from 1925 to 1929, for a Republican during whose term manufacturing jobs rose.

Much has of course varied over so many decades, plus there have been wars and other such factors affecting the numbers.  But there has also been a certain degree of consistency of policies within each party, with changes that are generally gradual (reflecting evolution over time) rather than abrupt.  Senior officials in each new administration will have generally served in some capacity in a prior administration of the same party.

It is nevertheless striking that there has been this 100% consistency in performance between the two parties when it comes to jobs in manufacturing:  The number of jobs have always improved under the Democrats, and have always (since Coolidge) deteriorated under the Republicans.  If you are interested in seeing such jobs grow, vote Democratic, not Republican.