Strong Employment Growth Has Continued, But Must Eventually Level Off

Cumul Private Job Growth from Inauguration to June 2016

Cumul Govt Job Growth from Inauguration to June 2016

A.  Introduction

A pair of recent news releases on the job market underscore what has been a strong record on job growth during Obama’s tenure as president.  On July 8, the Bureau of Labor Statistics released its monthly employment report, while on July 14, the Department of Labor issued its regular weekly report on initial claims for unemployment insurance.  The reports show continued strong growth in employment, an unemployment rate that remains below 5%, and initial claims for unemployment insurance that are at a record low as a ratio to total employment.

This blog post will review these developments, with comparisons to the outcomes seen under recent Republican presidents.  Obama’s policies have been criticized as harmful to labor by “killing” jobs through over-regulation or by the extension of health insurance under the Affordable Care Act (Obamacare), but this is simply not true.  Employment growth has been strong, and the unemployment rate is now at a level which is at, or close to, full employment levels.  It might be able to go a bit lower, but not by much.

And because unemployment cannot go much lower, job growth going forward will necessarily slow down.  When one is at full employment, job growth cannot be greater than growth in the labor force, and growth in the labor force is primarily determined by demographic factors.  While there can be month to month fluctuations, as the number choosing to enter or remain in the labor force can fluctuate (and there will be statistical variation as well, as these figures are all based on surveys), these fluctuations will even out over time as they are fluctuations around a relatively steady long-term trend (see this earlier blog post for a discussion).

This blog post will review these figures on employment growth during Obama’s tenure, and what might now be expected going forward.

B.  Job Growth, the Unemployment Rate, and Initial Claims for Unemployment Insurance

The charts at the top of this post show growth in the number of jobs, separately for private jobs and for government jobs, cumulatively from the month of inauguration for Obama and similarly for George W. Bush.

Private job growth has been strong and remarkably steady under Obama since the trough reached at start of 2010, one year after he took office.  During his first year in office, Obama’s stimulus program plus aggressive Fed actions succeeded in turning around an economy that was in full collapse as he took office.  There have been 14.8 million new private jobs gained since that turnaround.  The contrast with Bush is stark.  Private job growth under Bush was not only less in absolute amount, but also collapsed in his final year in office as the economy went into free fall following the bursting of the housing bubble.

Also in contrast to Bush (and every other recent president), government jobs have fallen during Obama’s tenure, with 460,000 less now than when he took office.  Total jobs have not grown because of additions to the public sector payroll:  There are fewer government jobs now than when Obama was inaugurated.

With the overall job growth, unemployment has fallen steadily, from a peak of 10.0% in October 2009 to just 4.9% now:

Unemployment Rates - Obama vs Reagan, up to June 2016
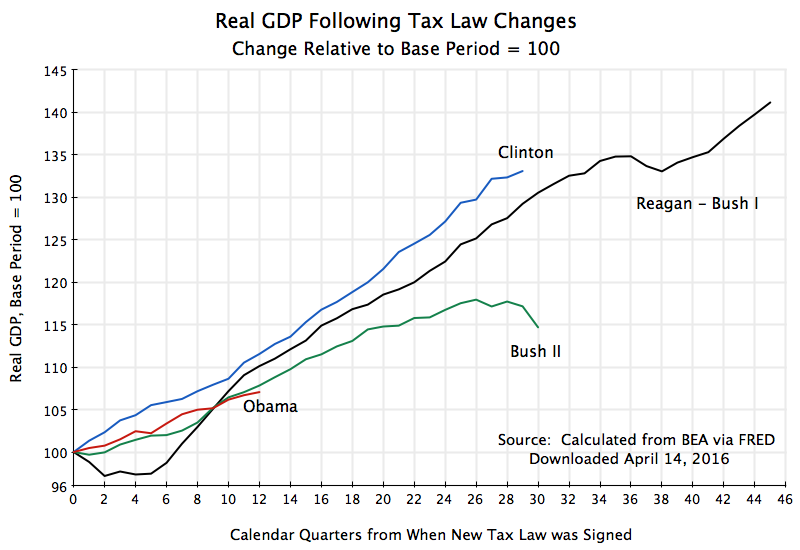
Furthermore the unemployment rate has been at 5.0% or below since October 2015. With full employment traditionally viewed as an unemployment rate of around 5% (there is always some friction in the market), the unemployment rate cannot go much below where it is now.  And the unemployment rate is well below what it was when Reagan was in office, at the same point in their respective administrations.

Finally, the weekly report on initial claims for unemployment insurance (issued by a different unit within the Department of Labor) shows claims are now at a record low level when measured as a ratio to number employed:

Weekly Initial Claims for Unemployment Insurance as a Ratio to Employment, January 1967 to June 2016

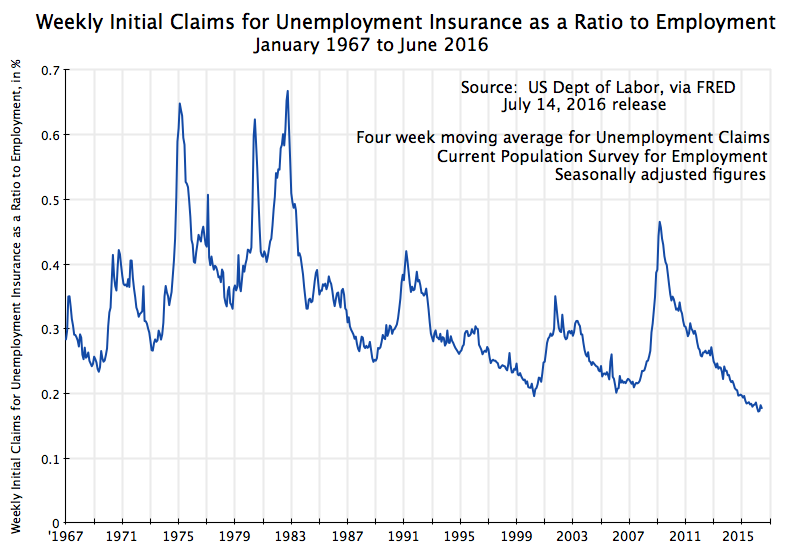
Initial claims for unemployment insurance as a ratio to employment has never been so low since at least 1967, when the data series first began to be collected.  Indeed, it has been at a record low since late 2014.  Workers are not being laid off.

This employment record is therefore strong.  Had Mitt Romney been elected president in 2012, one can imagine what he and his party would now be saying of such a record.  In May 2012 during the campaign, Romney said that his policies would get unemployment down to 6% by the end of his first term (i.e. by January 2017).  And this was viewed as a stretch.  But it was achieved under Obama by September 2014, less than half way through his term.  And unemployment under Obama has now been at 5.0% or less since October 2015.

C.  What to Expect Going Forward

While job growth has been strong under Obama, one must also be aware that this cannot go on forever.  A slowdown has to occur.  While jobs can be (and should be) added quickly when unemployment is high, so that the unemployed can gain jobs, once one is at or close to full employment, this has to slow down.  When this happens, it should not be a surprise.

When an economy is at full employment, the growth in the number of those employed can only rise with growth in the labor force.  And this depends primarily on demographic factors.  While there can be short term fluctuations (including fluctuations in the figures arising from the statistical estimates, as they are based on surveys of households), these will even out over time.

Since the trough reached in February 2010, total employment has increased by 14.4 million, while private employment has increased by 14.8 million (government jobs have been reduced).  The average increase per month over this period was 190,000 for total employment and close to 195,000 per month for private employment.  These are also not far different for the monthly averages of just the past 12 months, of 204,000 for total employment and 194,000 for private employment.

But this cannot continue.  The labor force is growing at a pace of only 0.5% per year, based on the growth over the decade of June 2006 (when unemployment was 4.6%) to June 2016 (when unemployment was 4.9%).  Applied to the current labor force of 158.9 million, growth of 0.5% per year comes to 66,200 additional workers per month.  The pace of job growth will have to fall at some point in the not too distant future to about one-third the pace it has averaged over the last year.

A couple of caveats should be noted.  First, the rate of unemployment compatible with full employment is not known with certainty, and may well have varied over time.  The unemployment rate might fall below 5%, and was indeed in the range of 3.8 to 4.1% during the last year of the Clinton administration.  Should it be possible to bring the “full employment” rate of unemployment down by a further 1% point over the course of, say, one year (i.e. from the current 4.9% to 3.9%), then monthly job growth over that year could average 200,000 per month.  An additional 1% of the current labor force of 159 million would obtain jobs (1% of 159 million equals 1.6 million, or 133,333 per month over 12 months, plus the trend growth of the labor force of 0.5% per year adds 66,200).  But there is still a limit, and while it might not be reached immediately, it is not far off.

Separately, the number in the population that choose to participate in the labor force has varied over time, and could conceivably go higher.  Some analysts have indeed argued that it is exceptionally low right now, and can be expected to go higher as the economy returns to full employment and “discouraged workers” start again to seek jobs.  But again, there are limits to this, and as I argued in an earlier blog post, I do not see that one should expect a sharp increase.  Indeed, the long term trend has followed a steady and predictable path in recent decades (when one separates out the male and female rates), and the male and female rates have both been going downward since the late 1990s.  On top of this, the aging of the baby boomers into their normal retirement age means one should expect even slower growth in the labor force over the next ten years than over the last ten years.

Finally, this slowdown in the pace of job growth is what one should expect under ideal conditions, of an economy that is at, and then remains at, full employment levels.  Under such conditions, the pace of job growth could average only around 66,000 per month. But the economic expansion under Obama has now been underway for seven full years.  Only three other business cycle expansions have lasted so long in US history.  Eventually, every expansion has come to an end, and when it does, jobs will decline.  The expansion under Obama has continued, but who knows what will happen once a new president takes office next January.

D.  Conclusion

The jobs record under Obama has been exceptionally strong.  There is no basis for the assertions made by political opponents that his regulatory and other policies have harmed job growth.  Faced with an economy in free fall when he took office, Obama was able to engineer a stabilization and then recovery that has brought employment back to full employment levels.

This is not to deny that there are important economic issues.  Most importantly, wages have been flat and income distribution has continued to worsen.  Furthermore, with the economy now at or close to full employment, the pace of job growth up to now will have to slow in the not too distant future.  When it does, one should not be surprised.

Don’t Blame a Lack of Job Growth on the Free Trade Agreements

Jobs in the Motor Vehicle Sector, 1967 to 2014, ver 2


June 20, 2016:  This is a slightly revised version of the original post, where the blue curve on the chart above has now been drawn to show solely the impact of productivity growth, rather than productivity growth and net import growth combined.  This is simply for clarity, and the points made all remain the same.  There was then minor editing of the text to reflect this new presentation. 

Summarizing the main result:  Productivity growth over the period 1967 to 2014 was almost 19 times more important to the number of jobs in the auto sector in 2014 than would have been the case had net imports somehow been driven to zero.

A.  Introduction

It has been repeatedly said in the current US presidential campaign that the various free trade agreements the US has signed in recent decades have led to a decimation of jobs in manufacturing.  And it has been largely left unchallenged.  The assertion has come not only from Donald Trump on the right (the expected Republican nominee, as the other candidates have dropped out), but also from Senator Bernie Sanders on the left.  And it has been made so often, and without a response from others, that many might well believe it to be true.  It is presented as something obvious and spoken of as “everyone knows …”.

But it is not true.  First of all, the assertion itself is confused on many levels.  If it were true that never negotiating a free trade agreement would have led to millions of more jobs than would have been the case without the trade agreements, who would have filled those jobs if the economy is at, or close to, full employment?  Second, the whole point of trading is that there will be shifts across sectors.  There may be a decline in production in a sector where imports will rise, but there will then also be a rise in production in a sector where exports will grow.  While this might not be fully off-setting, to leave out any such offset is a mistake.

But if one ignores such higher level issues, what might have happened to jobs in just one sector if imports were somehow cut off by raising trade barriers?  The prime example most often cited is the US auto industry.  This blog post will look at what has in fact happened to jobs in the sector in recent decades, what the impact would have been had there been no imports, and what happened as a result of productivity growth.

The bottom line is that even under generous assumptions of what would have happened if imports had been restricted, such cuts in imports would not have had a very big impact on jobs in the sector.  Rather, jobs in the auto industry have been largely flat over the past half century not because of imports, but because productivity has increased.  And productivity growth is a good thing.

B.  Jobs in the US Motor Vehicle Sector, and the Impact of Imports

The chart at the top of this post shows (as the curve in black) what has happened to US jobs in the motor vehicle sector since 1967.  The data comes from the US Bureau of Economic Analysis, as part of its National Income and Product Accounts (NIPA), and covers the period from 1967 (the first year in this data series) to 2014 (the most recent year with job figures).  “Jobs” are defined as the number of persons engaged in production in the sector, counted in terms of full time equivalent employees and including any self-employed in the sector.  The sector is Motor Vehicles, and includes vehicle bodies, trailers, and parts.

The number of jobs in the sector was largely flat over much of the period, fluctuating generally in the range of 0.9 to 1.3 million, but somewhat less over the last decade (a consequence of the 2008 collapse of the economy and then slow recovery).  The number of jobs in the sector fell from 1,057,000 in 1967 to 872,000 in 2014, a fall of 17%.

[Technical note on the jobs data:  The BEA changed its categorization of jobs in this sector in 2000, and only provided overlapping data for the three years 1998 to 2000 for both the new and old definitions.  For the period prior to 1998, I rescaled the jobs figures to reflect the average proportional change shown in the 1998 to 2000 figures.  Strictly speaking, the earlier data is not directly comparable to the figures from 1998 onwards, but for the purposes here, the approximation is adequate.]

What would the number of jobs have been had imports been cut off?  While many things would likely change as a result of policy measures that somehow ended all imports (and would depend on precisely what measures were taken), a generous set of assumptions to make would be that all that was previously imported would now be made domestically, and that despite what would likely be higher costs, total sales from the sector would nonetheless remain unchanged.  We will make those assumptions, and also assume that average productivity would remain unchanged.  And imports will be measured by net imports, i.e. gross imports minus gross exports of the sector, as cutting off all imports would likely lead to exports from the sector being similarly cut.

Under such assumptions, the number of jobs in the sector would be as shown in the red curve on the chart at the top of this post.  By construction, there would be more jobs in the sector, as sales and productivity would be unchanged but all the production would now be domestic.  But not only would the result be a relatively modest increase in jobs in any given year, the absolute number of jobs would also be flat over the period as a whole. The number of jobs in the sector would be 1.1 million after rounding in 1967 and still 1.1 million in 2014 (although with fluctuations in the intervening years).

Cutting off imports would not have led to a big growth in jobs in the auto sector over this period.  It would not even have led to a modest growth over the period as a whole.

C.  The Impact of Productivity Growth

If not imports, why then has employment in the sector largely been unchanged for most of this close to half century, and indeed declined by 17% from the start to end points? Output grew by a lot.  Motor vehicle sector domestic output in 2014 was 4.5 times higher than what it was in 1967 (in real terms).  Yet employment was less.

The reason, of course, is productivity growth.  One needs far fewer workers now to build a car than what was needed in 1967.  There has been widespread growth in the use of robotics to substitute for many in the traditional production line, as well as other measures to reduce the number of workers needed to make each car.  The result is that output per worker (productivity) was 5.4 times higher in 2014 than what it was in 1967 (in real terms), based on the BEA figures.  Hence the number of workers needed and employed fell from the 1,057,000 in 1967 to 872,000 in 2014 (the same ratio, within roundoff, as the ratio of 5.4 to 4.5).

What if this productivity growth had not occurred?  If costs and sales had remained the same as otherwise (not likely, but assume that for the purposes here), one would then have needed a sharp increase in the number of workers to produce in 2014 what could be produced with the productivity of 1967.  The number of workers that would then have been needed is shown as the blue curve (the top one) in the chart above.

With no productivity growth, but all else the same as otherwise, one would have had to employ far more workers in the sector to produce the autos and other motor vehicles sold. Put another way, the reason there has been no growth in the number of jobs in the sector over the last half century is not because of imports, but because of productivity growth. The impact of imports, even under generous assumptions, has been minor in comparison.

And productivity growth is a good thing, not a bad.  For real incomes to improve, productivity must go up, not stagnate.  There are, however and most certainly, important issues with how the gains to that productivity growth is being distributed.  As earlier posts on this blog have discussed, median real wages have been basically stagnant since around 1980, and the gains to growth since around 1980 have gone fully to the extremely rich.

What might be done about this maldistribution of the gains to productivity growth is an extremely important, but separate, issue.  That is where the policy debate should focus.  A set of measures that might be taken to address the sharp increase in inequality in the decades since Reagan was president was discussed in this earlier post on this blog. Limiting imports is not one of them.  The most important measure for the issues here would be active fiscal policy to keep the demand for labor at close to full employment levels.  Only then will labor have the bargaining power needed to ensure wages rise in line with productivity growth.

D.  Conclusion

Free trade agreements signed by the US in recent decades have been harshly criticized in this year’s presidential campaign, by candidates both on the right (Donald Trump) and on the left (Bernie Sanders).  They take as a given that the agreements have led to a huge loss of jobs in the sectors where trade is possible.  But that is simply not the case.  The auto sector is often taken as the pre-eminent example of how American industry has been harmed by exposure to competition from imports.  But as discussed above, even under extreme assumptions on what would follow if imports were cut off, the impact on jobs would be small.  Rather, the reason there are not more jobs in the sector now than there were in 1967 is because the productivity per worker is now much higher.  And higher productivity is a good thing.

This is not to say that there are are no possible issues with the trade agreements.  There are.  But the concern I have is not with measures that move towards free (or at least freer) trade, but rather with measures that will do the opposite.  For example, a problem with the Trans-Pacific Partnership (negotiated between the US and 11 other Pacific rim countries, but which is still to be ratified or not by Congress), is the provision that would extend the patent protection enjoyed by US pharmaceutical companies to the 11 other countries, thus constraining their access to generic drugs.  This is the creation of a trade impediment, not a move towards freer trade.

But it is incorrect to blame the free trade agreements signed in recent decades for the lack of job growth in sectors such as autos.  Jobs in that sector have been flat or declining because worker productivity is now much higher than it was before.  One needs fewer workers to make each car.  There are certainly issues, extremely important issues, with how the gains to that productivity growth have been distributed, but restricting imports would not address them.

The Impact of the Reagan and Bush Tax Cuts: Not a Boost to Employment, nor to Growth, nor to the Fiscal Accounts

Private Employment Following Tax Law Changes

A.  Introduction

The belief that tax cuts will spur growth and new jobs, and indeed even lead to an improvement in the fiscal accounts, remains a firm part of Republican dogma.  The tax plans released by the main Republican presidential candidates this year all presume, for example, that a spectacular jump in growth will keep fiscal deficits from increasing, despite sharp cuts in tax rates.  And conversely, Republican dogma also holds that tax increases will kill growth and thus then lead to a worsening in the fiscal accounts.  The “evidence” cited for these beliefs is the supposed strong recovery of the economy in the 1980s under Reagan.

But the facts do not back this up.  There have been four major rounds of changes in the tax code since Reagan, and one can look at what happened after each.  While it is overly simplistic to assign all of what followed solely to the changes in tax rates, looking at what actually happened will at least allow us to examine the assertion underlying these claims that the Reagan tax cuts led to spectacular growth.

The four major changes in the tax code were the following.  While each of the laws made numerous changes in the tax code, I will focus here on the changes made in the highest marginal rate of tax on income.  The so-called “supply-siders” treat the highest marginal rate to be of fundamental importance since, under their view, this will determine whether individuals will make the effort to work or not, and by how much.  The four episodes were:

a)  The Reagan tax cuts signed into law in August 1981, which took effect starting in 1982. The highest marginal income tax rate was reduced from 70% before to 50% from 1982 onwards.  There was an additional round of tax cuts under a separate law passed in 1986, which brought this rate down further to 38.5% in 1987 and to 28% from 1988 onwards. While this could have been treated as a separate tax change episode, I have left this here as part of the Reagan legacy.  Under the Republican dogma, this should have led to an additional stimulant to growth.  We will see if that was the case.  There was also a more minor change under George H.W. Bush as part of a 1990 budget compromise, which brought the top rate partially back from 28.0% to 31.0% effective in 1991.  While famous as it went against Bush’s “read my lips” pledge, the change was relatively small.

b)  The tax rate increases in the first year of the Clinton presidency.  This was signed into law in August 1993, with the tax rate increases applying in that year.  The top marginal income tax rate was raised to 39.6%.

c)  The tax cuts in the George W. Bush presidency that brought the top rate down from 39.6% to 38.6% in 2002 and to 35.0% in 2003.  The initial law was signed in June 2001, and then an additional act passed in 2003 made further tax cuts and brought forward in time tax cuts being phased in under the 2001 law.

d)  The tax rate increases for those with very high incomes signed into law in December 2012, just after Obama was re-elected, that brought the marginal rate for the highest income earners back to 39.6%.

We therefore have four episodes to look at:  two of tax cuts and two of tax increases.  For each, I will trace what happened from when the tax law changes were signed up to the end of the administration responsible (treating Reagan and Bush I as one).  The questions to address are whether the tax cut episodes led to exceptionally good job growth and GDP growth, while the the tax increases led to exceptionally poor job and GDP growth. We will then look at what happened to the fiscal accounts.

B.  Jobs and GDP Growth Following the Changes in Tax Law

The chart at the top of this post shows what happened to private employment, by calendar quarter relative to a base = 100 for the quarter when the new law was signed. The data is from the Bureau of Labor Statistics (downloaded, for convenience, from FRED).  A chart using total employment would look almost exactly the same (but one could argue that government employment should be excluded as it is driven by other factors).

As the chart shows, private job growth was best following the Clinton and Obama tax increases, was worse under Reagan-Bush I, and abysmal under Bush II.  There is absolutely no indication that big tax cuts, such as those under Reagan and then Bush II, are good for job growth.  I would emphasize that one should not then jump to the conclusion that tax increases are therefore good for job growth.  That would be overly simplistic.  But what the chart does show is that the oft-stated claim by Republican pundits that the Reagan tax cuts were wonderful for job growth simply has no basis in fact.

How about the possible impact on GDP growth?  A similar chart shows (based on BEA data on the GDP accounts):

Real GDP Following Tax Law Changes

Once again, growth was best following the Clinton tax increases.  Under Reagan, GDP growth first fell following the tax cuts being signed into law (as the economy moved down into a recession, which by NBER dating began almost exactly as the Reagan tax cut law was being signed), and then recovered.  But the path never catches up with that followed during the Clinton years.  Indeed after a partial catch-up over the initial three years (12 calendar quarters), the GDP path began to fall steadily behind the pace enjoyed under Clinton.  Higher taxes under Clinton were clearly not a hindrance to growth.

The Bush II and Obama paths are quite similar, even though growth during these Obama years has had to go up against the strong headwinds of fiscal drag from government spending cuts.  Federal government spending on goods and services (from the GDP accounts, with the figures in real, inflation-adjusted, terms) rose at a 4.4% per annum pace during the eight years of the Bush II administration, and rose at a 5.6% rate during Bush’s first term.  Federal government spending since the late 2012 tax increases were signed under Obama have fallen, in contrast, at a 2.8% per annum rate.

There is therefore also no evidence here that tax cuts are especially good for growth and tax increases especially bad for growth.  If anything, the data points the other way.

C.  The Impact on the Fiscal Accounts

The argument of those favoring tax cuts goes beyond the assertion that they will be good for growth in jobs and in GDP.  Some indeed go so far as to assert that the resulting stimulus to growth will be so strong that tax revenues will actually rise as a result, since while the tax rates will be lower, they will be applied against resulting higher incomes and hence “pay for themselves”.  This would be nice, if true.  Something for nothing. Unfortunately, it is a fairy tale.

What happened to federal income taxes following the changes in the tax rates?  Using CBO data on the historical fiscal accounts:

Real Federal Income Tax Revenues Following Tax Law Changes

Federal income tax revenues (in real terms) either fell or at best stagnated following the Reagan and then the Bush II tax cuts.  The revenues rose following the Clinton and Obama tax increases.  The impact is clear.

While one would think this should be obvious, the supply-siders who continue to dominate Republican thinking on these issues assert the opposite has been the case (and would be, going forward).  Indeed, in what must be one of the worst economic forecasts ever made in recent decades by economists (and there have been many bad forecasts), analysts at the Center for Data Analysis at the conservative Heritage Foundation concluded in 2001 that the Bush II tax cuts would lead government to “effectively pay off the publicly held federal debt by FY 2010”.  Publicly held federal debt would fall below 5% of GDP by FY2011 they said, and could not go any lower as some federal debt is needed for purposes such as monetary operations.  But actual publicly held federal debt reached 66% of GDP that year.  That is not a small difference.

Higher tax revenues help then make it possible to bring down the fiscal deficit.  While the deficit will also depend on public spending, a higher revenue base, all else being equal, will lead to a lower deficit.

So what happened to the fiscal deficit following these four episodes of major tax rate changes?  (Note to reader:  A reduction in the fiscal deficit is shown as a positive change in the figure.)

Change in Fiscal Deficit Relative to Base Year Following Tax Law Changes

The deficit as a share of GDP was sharply reduced under Clinton and even more so under Obama.  Indeed, under Clinton the fiscal accounts moved from a deficit of 4.5% of GDP in FY1992 to a surplus of 2.3% of GDP in FY2000, an improvement of close to 7% points of GDP.  And in the period since the tax increases under Obama, the deficit has been reduced by over 4% points of GDP, in just three years.  This has been a very rapid base, faster than that seen even during the Clinton years.  Indeed, the pace of fiscal deficit reduction has been too fast, a consequence of the federal government spending cuts discussed above.  This fiscal drag held back the pace of recovery from the downturn Obama inherited in 2009, but at least the economy has recovered.

In contrast, the fiscal deficit deteriorated sharply following the Reagan tax cuts, and got especially worse following the Bush II tax cuts.  The federal fiscal deficit was 2.5% of GDP in FY1981, when Reagan took office, went as high as 5.9% of GDP in FY1983, and was 4.5% of GDP in FY1992, the last year of Bush I (it was 2.5% of GDP in FY2015 under Obama).  Bush II inherited the Clinton surplus when he took office, but brought this down quickly (on a path initially similar to that seen under Reagan).  The deficit was then 3.1% of GDP in FY2008, the last full year when Bush II was in office, and hit 9.8% of GDP in FY2009 due largely to the collapsing economy (with Bush II in office for the first third of this fiscal year).

Republicans continue to complain of high fiscal deficits under the Democrats.  But the deficits were cut sharply under the Democrats, moving all the way to a substantial surplus under Clinton.  And the FY2015 deficit of 2.5% of GDP under Obama is not only far below the 9.8% deficit of FY2009, the year he took office, but is indeed lower than the deficit was in any year under Reagan and Bush I.  The tax increases signed into law by Clinton and Obama certainly helped this to be achieved.

D.  Conclusion

The still widespread belief among Republicans that tax cuts will spur growth in jobs and in GDP is simply not borne out be the facts.  Growth was better following the tax increases of recent decades than it was following the tax cuts.

I would not conclude from this, however, that tax increases are therefore necessarily good for growth.  The truth is that tax changes such as those examined here simply will not have much of an impact in one direction or the other on jobs and output, especially when a period of several years is considered.  Job and output growth largely depends on other factors.  Changes in marginal income tax rates simply will not matter much if at all. Economic performance was much better under the Clinton and Obama administrations not because they raised income taxes (even though they did), but because these administrations managed better a whole host of factors affecting the economy than was done under Reagan, Bush I, or Bush II.

Where the income tax rates do matter is in how much is collected in income taxes.  When tax rates are raised, more is collected, and when tax rates are cut, less is collected.  This, along with the management of other factors, then led to sharp reductions in the fiscal deficit under Clinton and Obama (and indeed to a significant surplus by the end of the Clinton administration), while fiscal deficits increased under Reagan, Bush I, and Bush II.

Higher tax collections when tax rates go up and lower collections when they go down should not be a surprising finding.  Indeed, it should be obvious.  Yet one still sees, for example in the tax plans issued by the Republican presidential candidates this year, reliance on the belief that a miraculous jump in growth will keep deficits from growing.

There is no evidence that such miracles happen.