 A. Introduction
The January jobs report (more properly the “Employment Situation” report) released by the Bureau of Labor Statistics (BLS) on February 3, was extraordinarily – and surprisingly – strong. The unemployment rate fell to 3.4% – the lowest it has been since May 1969 more than a half-century ago. And despite the low unemployment rate, the number of “new jobs created” (also a misnomer – it is actually the net increase in non-farm payroll employment) was a surprising 517,000. But it was not only this. The regular annual revisions undertaken each January to reflect revised population controls and weights for the employment estimates led this year to significantly higher labor force and employment estimates. With the new industry weights, the increase in the estimated number of those employed in 2022 (the number of `”new jobs”) rose to 4.8 million. The earlier estimate had been 4.5 million.
All this is an extraordinarily strong jobs report. However, one should not go too far. It is important to understand what lies behind these estimates, as well as some of the implications. For example, strong growth in the total number employed while GDP growth is more modest implies that productivity (GDP per person employed) went down. That could be a concern, except that when viewed in the context of the last several years we will see that productivity growth has in fact been rather good.
This post will first examine the new figures on unemployment and then on employment growth. We will then look at the change in productivity – both in the recent past and from a longer-term perspective.
B. The Unemployment Rate and Its (Non)-Impact on Inflation
The unemployment rate in January fell to 3.4%. This is the lowest it has been since May 1969. And if it falls a notch further to 3.3% in some upcoming month, it will have fallen to the lowest since 1953.
A 3.4% unemployment rate is certainly low. But what is more significant is that the unemployment rate has been almost as low for most of the past year. It fell to just 3.6% in March 2022, and until last month varied within the narrow range of 3.5 to 3.7% – hitting the 3.5% rate several times. It is now at 3.4%, but what is most significant is that it has been at 3.7% or less for almost a year.
One needs to recognize that the unemployment rate is derived from a survey of a sample of households (implemented by the Census Bureau) called the Current Population Survey (CPS). The CPS sample includes approximately 60,000 households each month, in a rotating panel, and from this they derive estimates on the labor force participation rate, the unemployment rate, and much more. It complements the Current Employment Statistics (CES) survey, which covers a much larger sample of 122,000 businesses and government agencies representing 666,000 individual worksites (with each employing many workers). Hence employment figures are generally taken from the CES as there will be less statistical noise. But the employers surveyed for the CES cannot know how many workers are unemployed (they will only know how many workers are employed by them), so the smaller CPS needs to be used for that. (A brief explanation of the CPS and CES is provided by the BLS as a “Technical Note” included in each of the monthly Employment Situation reports.)
Due to the size of the sample, the estimated unemployment rate is actually only known within an error limit of +/- 0.2 percentage points, using a 90% confidence interval. That is, simply due to the statistical noise a change in the unemployment rate of 0.1 percentage point from one month to the next should not be considered statistically significant, and 10% of the time even a 0.2 percentage point change may have just been a consequence of the statistical variation. However, repeated observations over several months in a row of an unemployment rate at some level will be a measurement one can have much more confidence in. That can no longer be a consequence of simply statistical noise. Thus one should not place too much weight on the January change in the unemployment rate to 3.4% from 3.5% the month before. But the fact that the unemployment rate has consistently been within the relatively narrow – and extremely low – range of 3.4 to 3.7% since March 2022 is highly significant.
An unemployment rate anywhere close to a range of 3.4 to 3.7% is also far below the rate at which economists used to believe would be possible without the rate of inflation accelerating – i.e. without inflation going higher and higher. This was given the acronym name of “NAIRU” (for Non-Accelerating Inflation Rate of Unemployment). It was held that at an unemployment rate of less than the NAIRU rate, the rate of inflation would rise from whatever pace it was at to something higher. This was viewed as unsustainable, and hence the proper goal of economic policy was, in this view, to manage macro conditions so that the unemployment rate would never fall below the NAIRU rate. That rate was also sometimes called the “full employment rate of unemployment”.
The question then is what the NAIRU rate might be. While different economists came up with different estimates, estimates generally fell within the range of 5 to 6%. An unemployment rate of less than this would then (under this theory) lead to a rise in inflation.
But that did not happen. The unemployment rate fell to below 5% in 2016, and inflation remained low. It fell to below 4% in 2018 and inflation remained low. It fell to 3.5% in 2019 and into early 2020 and inflation remained low.
With the once again very strong labor market – with unemployment hitting 3.4% – has this now changed? The rate of inflation did rise in 2021 and into 2022. But if one looks at this chart, one sees that the timing is wrong: Inflation rose earlier – in 2021 – when the unemployment rate was still well over 6% early in the year. Furthermore, nominal wages only rose later:

Inflation (measured here by the consumer price index – the CPI – for all goods and services) can be volatile, but the upward trend began already in the second half of 2020 (although in part this was initially due to a recovery in prices from depressed levels earlier in 2020 due to the Covid crisis). The chart shows the rates in terms of 3-month rolling averages (at annual equivalent rates and in arrears, so the figure for a January, say, would be for the months of November through January). The pace of change in nominal wages (also as 3-month rolling averages and at annual rates) did not start to rise until mid-2021. The increase in nominal wages appears to be more in response to the prior increase in prices – as firms found it profitable to employ more workers in an economy that grew strongly in 2021 – rather than a cause of those higher prices. This is consistent with the view that the inflation was primarily due to demand-pull, rather than cost-push, factors.
[Technical Note: The figures on changes in the nominal wage come from data assembled by the Federal Reserve Bank of Atlanta, drawing on data that can be obtained in the underlying micro-data files of the CPS. The rotating panel of households in the CPS are interviewed for four months, not interviewed for the next eight months, and then interviewed again for four months. New households are added each month and then removed after month 16 for them. This allows the researchers to match individuals with their reported wages to what they had earned 12 months before. It also allows them to examine the wage changes broken down by individual characteristics – such as age, gender, race, education level, occupation, where they are in the income distribution, and more – as these are all recorded in the CPS. It is all very interesting, and worth visiting their website where they make it easy to see the impact on the measured changes in wages of many of these different factors.
The matching of wage changes by individuals also provides a much more reliable index than the commonly cited changes in average wages provided in the monthly Employment Situation report. The latter comes from what employers report in the CES survey on the average wages they are paying. Those averages will be affected by compositional effects. For example, the reported average wages will often jump at the start of an economic downturn – such as it did in 2020 – as the less experienced and lower-wage workers are generally laid off first. This leaves a greater share of more highly paid workers, which will lead the reported average wage to rise even though the economy had entered into a downturn.]
Not only did the rise in inflation precede the more modest increase in the pace at which nominal wages rose, but since mid-2022 the rate of inflation has come down while the job market has, if anything, become tighter. The unemployment rate, as noted above, has been in the 3.4 to 3.7% range since March 2022, and is now at 3.4%. Despite this, the three-month average increase in the seasonally adjusted CPI fell from 11.0% (at an annual rate) in the three months ending in June 2022, to just 1.8% in the three months ending in December. If a tight labor market was driving inflation, one would have expected inflation to have kept going up rather than fall – and certainly not to fall by such a degree.
Furthermore, growth in nominal wages fell slightly from a peak of over 6.7% in the three months ending in June and also July 2022 (at an annual rate), to 6.1% as of December. One would have expected the pace of change in wages to have continued to go up, rather than start to ease.
It is still early to be definitive on any of this. Trends could change again. Importantly, a significant part of the sharp fall in inflation in the second half of 2022 (when measured by the full CPI) was due to a fall in the prices of oil and other energy products. However, while more recent, there are also early indications that core inflation (where food and energy prices are left out) is also falling. In terms of the core CPI (again the seasonally adjusted index), the pace of inflation fell from a peak of 7.9% (at an annual rate) in the three months ending in June 2022, to just 3.1% in the three months ending in December.
That measure of inflation – the core CPI, which is often taken to be a better measure of underlying inflationary trends than the overall CPI as food and energy prices are volatile and go down as well as up – is now falling despite unemployment at the lowest rate it has been in more than a half-century. If a tight labor market was driving inflation, then one would expect the pace of inflation to be rising, not falling.
C. Employment Growth
The January jobs report was also noteworthy for its figures on employment growth. Nonfarm payroll employment rose by 517,000 – far higher than most expected. It is not that an increase in employment of a half million in a month is unprecedented. It is rather that there was such an increase even though the unemployment rate was already at an extremely low 3.5% in the prior month. (And while nonfarm payroll employment excludes those working in agriculture, that number is now small at only 1.4% of the labor force – based on estimates from the CPS and including those in agriculture who are self-employed. It also excludes the self-employed outside of agriculture – a more substantial 5.6% of the labor force according to the CPS – but still not that large. In terms of changes in the numbers from one period to the next, the impact on the employment estimates will be small.)
In addition, the January report also reflected revisions – undertaken every January – where new weights are used to generalize from what is found in the sample in the CES of firms and other entities (such as government agencies) that employ workers to what is estimated for the economy as a whole. The re-weighting is based on a comprehensive count of payroll jobs in March of the year, with this then used to revise the estimates for all of the year (2022 in this case).
Due to the new weights, the increase in the number of jobs in the economy rose from the earlier estimate of 4.5 million in 2022 (i.e. from December 2021 to December 2022) to 4.8 million. Between January 2022 and January 2023 the increase was an estimated 5.0 million additional jobs. That is, between January 2022 and January 2023, the number employed increased by an average of 414,000 per month.
The 4.8 million growth in the number employed in 2022 was remarkable not only because it is a big number, but also because it came after the even stronger growth in employment in 2021. Employment grew by 7.3 million in 2021. In absolute terms, the 4.8 million figure in 2022 is higher than that of any year (other than 2021) in the statistics going back to when they started to be collected in the present form in 1939 (using BLS data). Such a comparison is more than a bit unfair, of course, as the US economy has been growing and there are far more people employed now than decades ago. But taking 2021 and 2022 together, the percentage growth over the two years – at 8.5% – was exceeded since 1951 only by greater increases in 1977-78 (10.2%), in 1965-66 (9.7%), and in 1964-65 (8.7% – that is, there was strong growth in the three straight years of 1964, 1965, and 1966). Joe Biden was right when he said job growth in the first two years of his presidency (of 12.1 million) was greater than that of any other president, but it is not really a fair comparison as the economy is now larger. But even in percentage terms, his record is excellent.
But such growth in the number employed cannot continue much longer. To put this in perspective, the total adult population in the US (as reflected in the CPS, and with the new population controls) rose by only 1.8 million between January 2022 and January 2023, or 150,000 per month on average. And the labor force figure, as estimated in the CPS, grew by only 1.3 million over that period, or 111,000 per month. One cannot keep adding 414,000 per month to the number employed (as we saw in the year to January 2022) when the labor force is only growing by 111,000 per month, when the unemployment rate is already at a historical low of 3.4%.
[Note that one cannot simply subtract the January 2022 figures reported from the new January 2023 figures, since in the CPS they do not go back and revise the previous year figures to reflect the new population controls. But they do show what the impact would have been on the December 2022 figures, and I assumed that they would have had the same impact on the January 2023 numbers. The impacts should be similar. One can then do the subtractions on a consistent basis.]
An increase in the number employed of an estimated 414,000 per month when the labor force was growing by only an estimated 111,000 per month was possible in 2022 in part because the unemployment rate came down (from 4.0% in January 2022 to 3.4% in January 2023), and in part because the labor force participation rate went up slightly (from 62.2% in January 2022 to 62.4% in January 2023).
But also a factor is that these are surveys from two different sources (households for the CPS and firms and other employers for the CES), and the sample estimates will not always be fully consistent with each other. As was discussed in an earlier post on this blog, the estimates can differ from each other sometimes for significant periods of time. However and importantly, over the long term the two estimates will eventually have to approach each other. The population estimates used for the CPS will yield (for a given labor force participation rate) figures on the labor force, and hence growth in the adult population will yield figures on growth in the labor force. For a given unemployment rate, the number employed – within the bounds of the statistical estimates – cannot grow faster than this.
With the unemployment rate now at 3.4%, one should not expect much if any further fall. Indeed, the general expectation (and the more or less openly stated hope of the Fed) is that it will start to rise. It is possible that the labor force participation rate will rise, but changes in this are generally pretty slow, driven mostly by demographics and social factors (the share of people aging into the normal age of retirement; the share of the young entering into the labor force given their decisions on whether and for how long to enroll in colleges and universities; decisions by households on whether one or both spouses will work; and similarly).
While there will be uncertainty in what will happen to the unemployment rate and the labor force participation rate, for given levels of each of these, employment cannot grow any faster than the labor force does. (Indeed it is slightly less: At an unemployment rate of 3.4%, employment will only grow at 96.6% of what the labor force grows by.) With the labor force growing by 111,000 per month in the year ending in January 2023 (with this already reflecting a small increase in the labor force participation rate from 62.2% to 62.4%), it will not be possible for the monthly increase in employment to grow by much more than this.
Looking forward, one should not, therefore, expect growth in the number employed to be sustained at a level that is anywhere close to the 517,000 we had in January. There will be month to month fluctuations, but one should not expect an average increase over several months that would be much in excess of the 111,000 figure for the growth in the labor force seen in the year ending in January 2023.
D. Productivity
Politicians like strong job growth. It is indeed popular. But the flip side of this is that while the number employed grew rapidly in 2021 (by 3.2% December to December), GDP growth was less (1.0% from the fourth quarter of 2021 to the fourth quarter of 2022, based on the most recent estimates). With the number employed growing faster than GDP, the mathematical consequence is that GDP per person employed went down. That is: Productivity fell in the year.
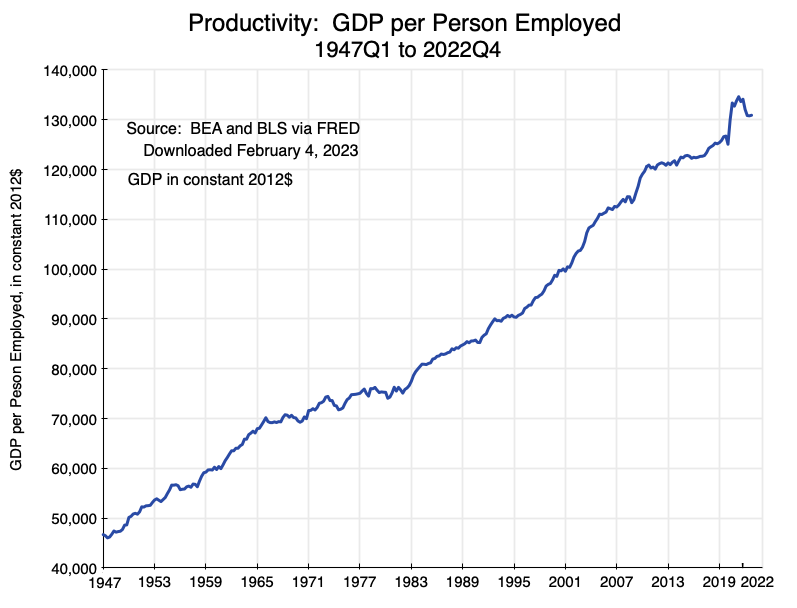
Higher productivity is ultimately what allows for higher living standards. Falling productivity would thus be a problem. However, in the context of the last several years, productivity growth has in fact been pretty good:

We are once again seeing the consequences of the highly unusual circumstances surrounding the Covid crisis. With the onset of a downturn, firms will lay off workers. But they may often lay off more workers than their output falls. This might be because of uncertainty on how much the demand for whatever they make will fall in the downturn (and they will wish to be careful and if anything to overcompensate, given the difficulty of obtaining finance in a downturn and the very real possibility of bankruptcy); or because special government programs during the downturn reduce the cost to them and their workers of these layoffs (for example through the common response of extending unemployment benefits and making them more generous); or because the first workers being laid off are the least productive ones (possibly because they are relatively new and do not yet have as much experience as others working there) so that they end up with a workforce which is on average more productive. Or, and very likely, it could be a combination of all three factors. It looks very much like Schumpeter’s “creative destruction”.
The consequence is that productivity can in fact jump up in a downturn. One sees such a clear jump in the chart in 2020, at the time of the sharp collapse due to the Covid crisis. One also sees it in 2008-09, with the financial and economic collapse in the last year of the Bush administration and then the turnaround that began in mid-2009. In terms of the numbers: Real GDP fell by 1.3% between the first quarter of 2020 and the third quarter of 2020 (in absolute terms – not annualized). But employment over this period fell by 7.4%. As a result, productivity (real GDP per person employed) jumped by 6.6% in this half year. In 2008/2009, real GDP was basically flat between the last quarter of 2008 and the last quarter of 2009 – rising by just 0.1% But employment over this period fell by 4.1%, leading to an increase in productivity of 4.4%.
Following these brief periods where businesses are scrambling to survive the downturn by producing more (or perhaps not too much less) with many fewer workers, firms then enter into a more normal period where, as the economy recovers, they are able to sell more of their product. They hire additional workers who are, by definition, less experienced in the work of that firm than their existing workforce. The new workers might also be less capable or have a less applicable skill mix. Productivity may then level off or even go down. The latter situation is in particular likely when the economy recovers quickly and firms scramble to keep up with the increased demand for their product.
The latter fits well with what we saw in 2021. GDP in 2021 rose by 5.9%, the highest of any year since 1984. And the Personal Consumption component of GDP rose by 8.3% in 2021, the highest of any year since 1946. This was spurred by the series of Covid relief packages passed in 2020 (under Trump) and in 2021 (under Biden), which totaled $5.7 trillion in the two years, or 12.8% of GDP of 2020 and 2021 together. Personal savings rose to an unprecedented level as a share of GDP (other than during World War II, with data that go back to 1929), which then supported the strong growth in personal consumption in 2021. This is consistent with a demand-led inflation that got underway in late 2020 or early 2021 (discussed above) – a risk of inflation that Larry Summers had warned of in early February 2021 when Biden’s $1.9 trillion Covid package was first proposed (and eventually passed, largely as proposed).
But what matters to long-term living standards is not so much the changes in average productivity in the periods surrounding economic downturns, but rather the trends in productivity growth over time. A ten-year moving average is a useful metric:

The chart shows rolling ten-year averages starting from 1947/57 through to 2012/22 of the growth in GDP, in employment, and in productivity (GDP per person employed). Productivity growth was relatively high at about 2% per annum in the 1950s and through most of the 1960s. But it then started to fall in the 1970s to less than 1% a year before recovering and returning to about 2% a year in the ten-year period ending in 2004. It then fell to roughly 0.8% a year since about 2017 (in terms of the ten-year averages), with some sharp fluctuations around that rate associated with the 2020 Covid crisis. As of the end of 2022, the most recent ten-year average growth rate for productivity was 0.80%.
This has important implications for GDP growth might be going forward. The labor force grew by 0.8% in 2022 (the adult population grew by 0.7%). With unemployment close to a record low, employment will not be able to grow faster than the labor force – as discussed above. And the labor force cannot grow faster than the adult population unless labor force participation rates increase. But while there major disruptions in labor force participation in 2020 and 2021 surrounding the Covid crisis – with its lockdowns, economic collapse and then recovery, as well as health concerns affecting many – labor force participation largely returned to previous patterns in 2022. Labor force participation rates have been slowly trending downwards since the late 1990s, and while it is possible this pattern might be reversed, it is difficult to see why it would. There might well be short-term fluctuations for a period of a few years, but longer-term patterns are driven mostly by demographics (the age structure of the population) and social customs (e.g. whether women decide to enter into the paid labor force).
What follows from this is that if the labor force continues to grow at 0.8% a year (as it did in 2022 – and it grew only at a lower rate of 0.6% a year in the ten-year period ending in 2022), and productivity grows at 0.8% a year (as it did in the ten-year period ending in 2022), then GDP can at most grow at 1.6% a year on average. This would be disappointing to many. While there certainly can be and will be significant year to year variation around such a trend, faster growth would require either higher productivity growth or more entering into the labor force.
E. Summary and Conclusion
The January jobs report was strong. The unemployment rate is now at the lowest it has been in more than a half-century, and the number employed grew by more than a half million – a very high figure when the unemployment rate is so low. While these are still preliminary figures and are subject to change as additional data become available, they present a picture of an extremely strong labor market.
The fall in the unemployment rate by one notch to 3.4% from the previous 3.5% should not, in itself, be taken too seriously. That is well within the normal statistical error for this figure. But what is indeed significant is that the unemployment rate has been within the narrow range of just 3.4 to 3.7% since March 2022. That is low. And it was in this low range during a period (in the second half of 2022) when inflation was coming down. While changes in the price of oil have been a major factor in driving the inflation rate in 2022, the core rate of inflation (which excludes energy prices as well as those for food) has also started to come down. The rate of change in nominal wages did start to grow in mid-2021, but this appears more to be a consequence of the rising prices rather than a cause of them. And there has been a slight reduction in the pace of change in wages in recent months.
One does not see in this any evidence that a tight labor market with extremely low unemployment (the lowest in more than a half-century), has led to higher inflation. The opposite has happened. Inflation has come down at precisely the time the labor market has been the tightest.
GDP grew rapidly in 2021, but then slowed to a more modest 1.0% rate in 2022 (from fourth quarter to fourth quarter). Coupled with rapid employment growth in the year, productivity (as measured by GDP per employed person) fell. However, this appears more to be a continued reaction to changes surrounding the disruptions resulting from the 2020 Covid crisis. During that crisis, GDP fell but employment fell by much more, leading to a jump in productivity despite the downturn. As the economy recovered and the situation normalized, workers were hired to bring workforces back to desired levels. Viewed in a longer timeframe, productivity growth has been similar to what it has now been since the mid-2010s.
That productivity growth is not especially high. It was 0.8% at an annual rate in the most recent ten-year average. Coupled with a labor force that grew at 0.8% in 2022, and going forward might grow by even less (it grew at 0.6% a year in the ten-year period ending in 2022), the ceiling on GDP growth would be 1.6% a year, or less. That is not high, but expectations need to adjust.
That is also a ceiling on what GDP growth might be. Many expect that there very well could be a recession either later in 2023 or in 2024. Much will depend on whether the government will be able to respond appropriately if the economy appears to be heading into a downturn. But with Republicans now in control of the House of Representatives, and threatening to force the US Treasury into default on the nation’s public debt if their demands for drastic spending cuts are not met, one cannot be optimistic that the government will be allowed to respond appropriately.

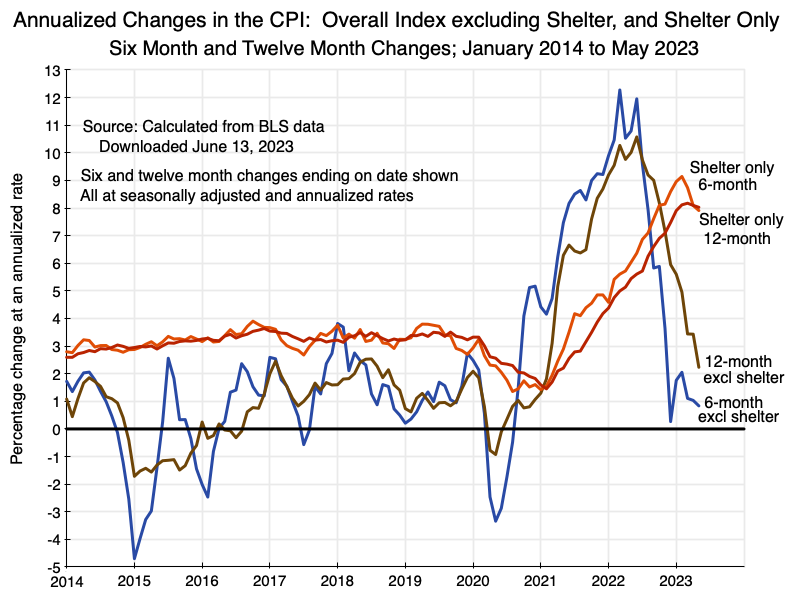 This is just a short update to my May 10 post on this blog to reflect newly released data. The Bureau of Labor Statistics released today its estimates for the Consumer Price Index for May 2023. I noted in the May 10 blog post (that had data through April 2023) that the pace of inflation when one excludes the shelter component had come down sharply over the past year. One sees this most clearly when one focuses on the change over rolling 6-month periods (annualized). The rolling 6-month change in the CPI excluding the shelter component peaked in early 2022 at an annualized rate of over 12%. But since late 2022, the 6-month rate has fluctuated in the range of just 0.3 to 2.0% (annualized), and it remains there. The May 2023 6-month figure was just 0.8%. The Fed’s target is to keep inflation at around 2%. These have been below that for half a year now.


You must be logged in to post a comment.