Private Job Growth Under Obama: Recovery, in Contrast to the Fall Under Bush

Cumulative Private sector employment growth by months from inaugurations, Obama, Bush II, Clinton, Bush I

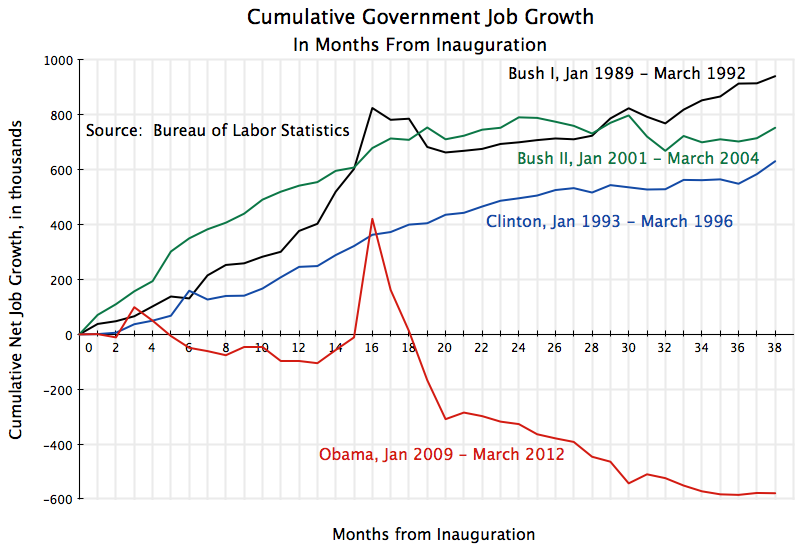
Cumulative Government sector employment growth by months from inaugurations, Obama, Bush II, Clinton, Bush I

[Update on February 2, 2013:  A more recent analysis of these issues, with these charts now covering the full first term of Obama, is available here.]

A.  Introduction

Mitt Romney and Republican Party leaders have repeatedly and emphatically asserted that Obama and the policies of his administration have been terrible for private sector job growth, and that voters should therefore bring back the Republicans and their policies.  Indeed, Romney has said his campaign is all about jobs.  At the same time, they’ve asserted that government and its bureaucrats have exploded during the Obama years, with this holding back private sector job growth.

But as the figures above show, private sector jobs have recovered under Obama, reversing the freefall that was underway as he was taking the oath of office, while government employment has contracted sharply.  In contrast, private jobs were stable when George W. Bush took office, but then started to fall and fall sharply, while government jobs rose.  By 38 months into his first term, there were 2.4 million fewer private sector jobs in the US economy than on the day Bush was inaugurated.  Yet Romney repeatedly lambasts Obama for his jobs record, while he argues for bringing back the policies of Bush.

They figures show the cumulative change in private and in government jobs between January of the year the Presidents were inaugurated, to the March that was 38 months (a little over three years) later.  The March date 38 months later was chosen as that is the most recent date for which data is available for Obama.  The data all come from the Bureau of Labor Statistics.  The graph on government jobs is similar in presentation to that used by Paul Krugman in a posting on his blog yesterday.  The government jobs issue was also reviewed in a posting on this blog site over four months ago, which noted the collapse in government jobs during the Obama years (while they grew under Bush), and discussed how this has hurt overall job growth in the economy.

B.  Private Sector Jobs

Private sector jobs were falling rapidly in the period leading up to Obama’s inauguration in January 2009, as has been discussed before in this blog (see in particular the figure at this posting).  While the pace of decline was turned around almost immediately (within three months of Obama taking office), the number of private sector jobs continued to decline in Obama’s first year.  But jobs in the private sector then began to grow, and by March 2012 (the most recent figure available) they are almost back to where they were when he took office.  While this represents a growth of over 4 million private jobs over the past two years, the hole was a deep one.  The economy was hemorrhaging 800,000 jobs per month at the end of the Bush administration.  One would have of course wanted a more rapid recovery from this deep hole, but Republican opposition in Congress has blocked the measures that would have been needed to get this done (such as further stimulus).

But while one would have wanted a more rapid recovery from the 2008 economic collapse, contrast the record of Obama with that of George W. Bush in the first term of his administration.  Private jobs were growing in the final months of the Clinton administration, and were flat in the first two months of the Bush administration.   But they then began to fall (with the fall well underway before the September 11 attacks, so one cannot blame them).  The steady decline in private sector jobs continued for two and a half years, and at the trough there were 3.4 million fewer private jobs than when Bush took office.  They then began a slow recovery, but by 38 months into his term there were still 2.4 million fewer private jobs than when Bush took the oath of office.   Yet Romney and his economic advisors (most of whom held high positions in the Bush administration) advocate bringing back the policies of Bush.

The graph also shows private job growth for similar periods in the Clinton administration and in the administration of the elder George Bush.  Under the Democratic administration of Clinton, there was steady and strong private sector job growth throughout the period being followed here (and indeed throughout his two terms).  Under the Republican administration of the elder George Bush, there was some, but weak, private job growth in his first year and a half in office, but then private jobs fell, so that by 38 months into his term they were close to where they had been when he started.  Put another way, after one year in office up to the point 38 months into their respective terms, private jobs rose by over 4 million under Obama, but fell by 1.4 million under the elder Bush.

C.  Government Jobs

The story commonly told about growth in government jobs under the different Democratic and Republican administrations is also a false one.  Total government jobs have fallen during the Obama term, but grew sharply during the terms of both Bush administrations.  They also grew during the Clinton period, although by less than in either of the two Bush terms.  (Note that the sharp spike, and then after a few months a reversion to the previous trend, at a little over a year into both the Obama and first Bush administrations, is due to temporary hiring for the decennial census.)  Keep in mind that government employment in the US is mostly state and local government employment, with federal employment only a small share (13% currently).  But under Obama, non-defense federal employment has fallen as well (discussed in this blog posting).

Positive government job growth during the Obama period, similar to that seen during the two Bush administrations, would have helped spur the recovery.  But federal support which would have saved the jobs of teachers, police, and others has been blocked by Republican opposition, while cuts at the state and local level have been driven not only by deficit concerns but also by ideology.  Indeed, prominent Republican governors such as Scott Walker in Wisconsin, Chris Christie in New Jersey, John Kasich of Ohio, Rick Perry of Texas, Rick Scott of Florida, and others, have celebrated their slashing of state and local government employment, often while cutting taxes at the same time.  The job cuts have been unprecedented.

D.  Conclusion

The Republican stories on jobs are myths, and not consistent with the facts.  Private sector jobs have recovered under Obama, and have grown by over 4 million jobs once the downturn Obama inherited was stopped.  One would have hoped for a faster recovery, but further efforts to spur the recovery have been blocked by Republican opposition in Congress.  And the story should be compared to that in the first term of George W. Bush, where there were 2.4 million fewer private sector jobs than when he took office, at the comparable point in his term.

The story told about government job growth under the different administrations is also false.  Government jobs have been slashed sharply (mostly at the state and local level) during the Obama period, which has hurt the economic recovery.  In contrast, government jobs grew significantly under both Bush administrations, and grew but by somewhat less during the comparable Clinton period.  Positive government job growth during the Obama period, had it happened, would have helped spur the economic recovery.

Employment Growth in January: Better, but Sustainability is a Concern

The employment report for January, released this morning by the Bureau of Labor Statistics, is a positive report.  But while employment growth is now improving, it is still not rapid enough, and its sustainability is a concern.

As I had noted in a posting on December 5 in this blog, monthly employment growth in the US needs to be in a range of roughly 200 to 250,000 per month for unemployment to fall on a sustainable basis.  One is now starting to see that, with overall employment growth of 203,000 in December and 243,000 in January.  With such growth, the unemployment rate fell from 8.9% in October to 8.7% in November to 8.5% in December and to 8.3% in January.  This is certainly welcome.  But unemployment at 8.3% is still far too high.  In a more robust recovery, one would be seeing monthly employment growth figures of over 300,000.

And the overall employment figures are still being held back by falling employment in government (mostly state and local government, which accounts for 87% of government employment in the US, but there have also been falls in federal employment).  In January, total government employment fell by 14,000, thus partly offsetting the rise in private employment of 257,000, to produce the overall gain of 243,000.

For the past year (January 2011 to January 2012), government employment fell by 276,000.  This has been a significant factor in holding down overall employment growth.  And government employment fell by 230,000 in the year before that (January 2010 to January 2011), and fell by 97,000 in the year before that (January 2009, when Obama was inaugurated, to January 2010), for a total fall in government employment of 603,000 over the three years.  In the three years before Obama took office, government employment rose by 248,000 in 2006, rose by 281,000 in 2007, and rose by 200,000 in 2008, for a total increase of 729,000.

Yet Obama has been repeatedly accused of creating an explosion of government.  (For a more detailed review of what has happened to Federal Government employment alone, see this blog.)  Had total government employment risen by 600,000 rather than fallen by 600,000 since Obama took office, one would have had an extra 1.2 million jobs directly.  Even ignoring any multiplier impact, this by itself would have led to an unemployment rate now of 7.5% rather than 8.3%.  And assuming, conservatively, a multiplier of just two (so that one additional government job leads to one additional private job, to supply the goods to cover the increased personal spending of the now employed government workers), the unemployment rate would now be a more respectable 6.7%.

While the January employment report was positive, one should keep in mind that there are threats on the horizon.  Two to consider:

1)  As noted in a January 27 blog, GDP growth in the fourth quarter of 2011 was only 2.8%, and 70% of this came from the change in the change in private inventories.  Without this inventory change, GDP would have grown by just 0.8%.  For the first quarter of 2012, it is unlikely that private inventories will again go up by so much.  And note that because it is the change in the change in private inventories that is the contribution to GDP growth (see this blog), then should private inventories once again increase by as much as they did in the fourth quarter of 2011, the growth in GDP in the current quarter would only be 0.8% (everything else being equal as in the fourth quarter of 2011, which of course it won’t be).  That is, inventories would have to continue to rise by as much as they did in the fourth quarter of 2011 simply to keep GDP growth at 0.8%.  They are likely to rise by far less, and quite possibly might fall if the high level of inventory accumulation in late 2011 was more than suppliers wanted.  This could then significantly hold back production and GDP growth, and hence employment growth, over the next several months.

2)  Europe continues to be problematic, with the focus on policies (fiscal austerity) which will make the situation worse rather than better.  Europe will certainly be in recession in 2012, and probably already is, and this will hurt the US recovery.

And there are of course other risks, such as, for example, an escalation in tensions with Iran leading to disruption of shipping through the Strait of Hormuz, that could cause oil prices to skyrocket.  There are many such scenarios that one can imagine, so a US recovery is anything but certain.  So while the January employment report was a positive one, there are still reasons to be concerned.

The Dynamics of the Job Market: The Decline Started in 2006, with a Partial Recovery Under Obama

The most closely watched jobs number reported each month, aside from perhaps the unemployment rate, is the figure normally referred to as “new jobs created”.   For example, on January 6, news reports on the Bureau of Labor Statistics release that day stated that “200,000 new jobs were created” in December.  But many people may not fully realize that that number is a net figure, and the news reports often speak as if it is all new hiring.  Actually, around 4 million people are being hired each month right now in the US, while close to that number are also leaving their jobs for various reasons (mostly quits to take some job elsewhere).  It is the net figure between these two that is the 200,000.

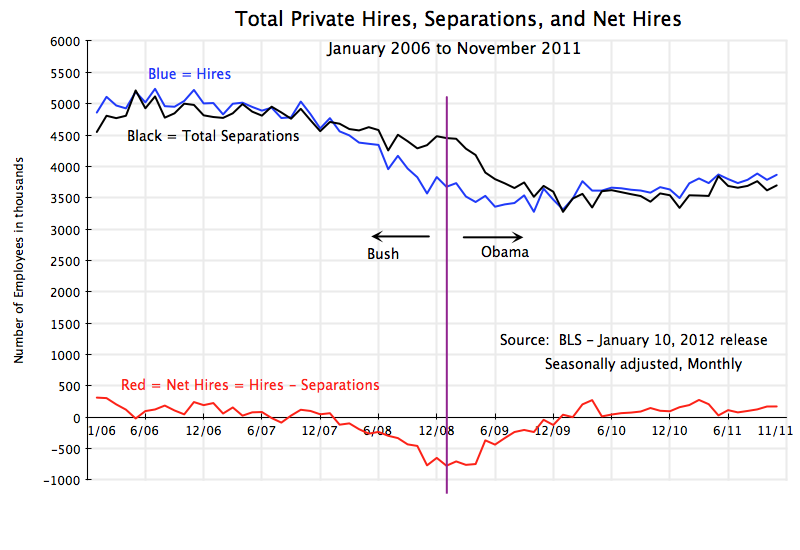
To understand what is going on in the labor market, it is important to disentangle the figures.  The graph above shows the numbers since January 2006 (and up to November 2011, the most recent figure available) on total private sector hires each month, total private sector separations for whatever reason (this will be broken down below in this post), and the net between the two.  One could also include government employment, but I have left it out to focus on the private sector labor market dynamics.  Government employment is much smaller (government employment is less than 17% of total employment in the US, and 87% of government employment is with state and local governments).  It is also generally more stable and has been, other than a blip due to temporary hiring at the time of the 2010 census.  And government employment has been trending downward during the Obama period (mostly due to falls in state and local government employment, as I discussed in a December 6 post).

The first interesting point to note is how much churn there is in the labor market.  This is not commonly appreciated in the discussion surrounding the monthly figure on “new jobs”.  Hiring is always going on, and people are always leaving their jobs for various reasons (whether quitting to take a new job elsewhere, or retiring, or being laid off, in both good times and bad – this will be reviewed below).  This churn is high.  For example, over the twelve months leading to November 2011, 48.6 million people were hired, while 47.2 million left their job for whatever reason, leaving a net job growth of 1.4 million (these figures include government).

And such hiring continues in both good times and bad.  Hiring fell from around 5 million a month before the downturn, only to around 3 1/2 million per month in the worst of the economic collapse in 2008 / 2009.  The unemployment rate peaked at over 10%, but even in this period, new hiring was being done at around two-thirds the rate it was before.  Yet many Republican critics asserted that “no one” was being hired due to Obama’s regulatory policies.  In fact, the fall in hiring largely came before Obama entered office, stabilized within a few months of his inaugeration, and since has risen, although not by enough.

With this break-down, it is also interesting to see that the deterioration in the labor market began as early as 2006, when private new hiring began to slow.  Housing prices had also reached their peak in 2006, and then began to fall.  While the collapse in the economy was in full swing only in 2008, in the last year of the Bush Administration, the deterioration in conditions had in fact started two years earlier.

With new hiring starting to slow from 2006, the number of people leaving their jobs for whatever reason (“total separations” in the graph) started to slow in 2007.  As labor market conditions deteriorated in 2007 with the lower new hiring, fewer people would choose to quit.  They did not have a new job to go to.  With both hiring and quits down together, net jobs (hiring less separations) generally remained positive in 2007.  But by 2008, new hiring was falling fast, and while total separations also fell, hiring was now less than separations, so net jobs fell fast.

Things then began to turn around within a few months of Obama taking office, due to his stimulus and other policies.  New hiring stabilized at about 3 1/2 million per month, while total separations continued to fall.  Fewer people were being laid off than they were when Obama took office (see below).  Net job losses stabilized (the trough was March 2009) and then began to improve.  While Republicans continue to assert that Obama’s policies have harmed job creation, the turnaround occurred exactly as soon as his policies could start to have an effect.  And the job situation has continued to improve since then, although not by enough given the depth of the hole the economy was in when Obama took office.

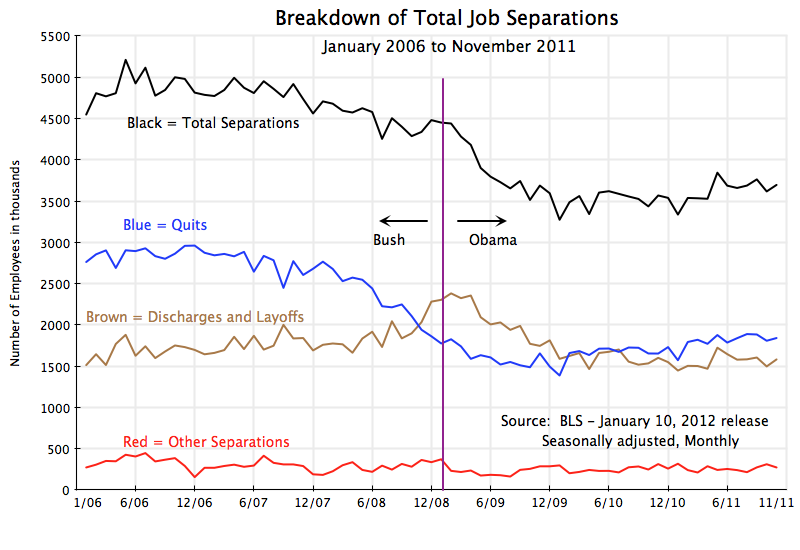
As noted above, the Total Separations figure is the total separations due to people quitting voluntarily (normally to take a better job elsewhere), people being involuntarily discharged either due to layoffs or due to poor performance, and other separations (mostly due to retirement).  The figures since 2006 are shown below:

It is interesting that while involuntary discharges and layoffs rose with the 2008 economic collapse, the increase was all in the second half of 2008, and was from 1.7 million per month in “normal” times, to a peak of just 2.4 million per month.  That is, there are always involuntary discharges and layoffs for various reasons, but in the worst economic downturn since the Great Depression it increased by less than half.  And since the end of 2009, monthly discharges and layoffs have been lower than they were prior to the downturn in 2006 and 2007.  One cannot say that Obama’s policies have led to more workers being laid off.

As noted above, quits started to fall in 2007, as labor market conditions started to deteriorate with the fall in new hiring.  They reached a trough in late 2009 / early 2010, and since have risen a bit, as labor market conditions began to improve.  But they remain well below what they were in 2006, as labor market conditions, while better than in 2008/2009, still remain poor, with 8 1/2% unemployment.  But people still do quit, at a rate of about 1.8 million per month, vs. quits of close to 3 million per month at the peak of the housing bubble.

Labor market conditions remain weak, with unemployment far too high.  It is unfortunate that political pressures are keeping the Obama administration from doing more to bring unemployment down, and indeed are forcing measures (such as cuts in fiscal spending) which are making the situation worse than it would otherwise be.  But the labor market turned around within a few months of Obama taking office, and has improved since.  There is still much more that needs to be done to bring down unemployment, but the charge that Obama’s policies are the cause of the high unemployment, is simply not backed by the facts.