| BEA release of 1/30/13; Seasonally adjusted annualized rates |
Percent Growth |
Contribution to GDP Growth (% points) |
|
2012Q2 |
2012Q3 |
2012Q4 |
2012Q2 |
2012Q3 |
2012Q4 |
| Total GDP |
1.3 |
3.1 |
-0.1 |
1.3 |
3.1 |
-0.1 |
| A. Personal Consumption Expenditure |
1.5 |
1.6 |
2.2 |
1.06 |
1.12 |
1.52 |
| B. Gross Private Fixed Investment |
4.5 |
0.9 |
9.7 |
0.56 |
0.12 |
1.19 |
| 1. Non-Residential Fixed Investment |
3.6 |
-1.8 |
8.4 |
0.36 |
-0.19 |
0.83 |
| 2. Residential Fixed Investment |
8.5 |
13.5 |
15.3 |
0.19 |
0.31 |
0.36 |
| C. Change in Private Inventories |
nm* |
nm* |
nm* |
-0.46 |
0.73 |
-1.27 |
| D. Net Exports |
nm* |
nm* |
nm* |
0.23 |
0.38 |
-0.25 |
| E. Government |
-0.7 |
3.9 |
-6.6 |
-0.14 |
0.75 |
-1.33 |
| Memo: Final Sales |
1.7 |
2.4 |
1.1 |
1.71 |
2.37 |
1.13 |
| nm* = not meaningful |
|
|
|
|
|
|
| $ Value of Change in Private Inventories (2005 prices) |
$41.4b |
$60.3b |
$20.0b |
|
|
|
The Bureau of Economic Analysis of the US Department of Commerce released on January 30 its initial estimate (what it formally calls its “advance” estimate) of US GDP growth in the fourth quarter of 2012. The result was terrible: GDP is estimated to have declined by a slight amount (0.1% at an annual rate). While it is possible that this estimate will be revised upwards as the second and third revisions are released next month and the month after (there has historically been an upward revision on average of 0.3% points from the advance estimate to the third, and there was a particularly large upward revision in the 2012Q3 figures between the advance and third estimates), fourth quarter growth will still likely be disappointingly low.
The primary cause of the stagnation of GDP in the fourth quarter was a sharp cut in government spending. As shown in the table above, total government spending on goods and services (federal, state, and local) fell at an annualized 6.6% rate in the quarter. This had the direct impact of subtracting 1.33% points from what GDP growth would otherwise have been. But there will also be an indirect impact, as workers who would have been employed producing goods and services for government would in turn buy goods and services themselves with the salaries they would have received. With a multiplier of just two, the impact of the cut in government spending in the fourth quarter was a subtraction of 2.66% points (2 x 1.33% points) from what growth would have been.
Most of the decline in government spending was due to a large fall in spending at the federal level, although state and local spending fell some as well. Federal government spending fell at an annualized rate of 15%, all due to a fall in defense spending at an annualized rate of 22%. These declines more than offset increases of an estimated 9.5% and 13% in total federal and in defense spending respectively in the third quarter, which had contributed to the relatively good GDP growth of 3.1% in that quarter. The swings were likely due to end of the fiscal year spending (the federal fiscal year ends September 30) which was particularly sharp last year and therefore not picked up in the normal seasonal adjustment calculations. The fall in the fourth quarter of 2012 (the first quarter of the fiscal year) reflected the continued budget uncertainty, as Congress threatens to slash the current budget drastically, either by design or through the automatic sequester cut-backs dictated as part of the agreement to get out of the debt ceiling debacle in 2011, that might be instituted soon (see below).
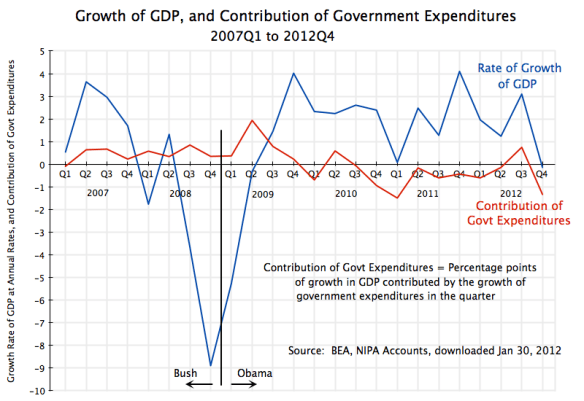
The fall in government spending in the fourth quarter was particularly sharp, but government spending has been falling in each quarter but two since the beginning of 2010. The resulting fiscal drag has held back growth. The figures are shown in the graph at the top of this blog. The graph shows the rate of growth of GDP each quarter (in blue, at annualized rates) since the beginning of 2007, plus the direct contribution to this growth each quarter from government expenditures (in red).
Government spending rose each quarter in 2007 and 2008, the last two years of the Bush Administration, and this continued into 2009 after Obama was inaugurated. The growth in government expenditures was particularly sharp in the second quarter of 2009 as the stimulus measures started, and this succeeded in turning around GDP. GDP was falling at an annualized rate of 8.9% in the fourth quarter of 2008, and this carried over into the first quarter of 2009 with an annualized fall of 5.3%. But then GDP stabilized and began to grow in the third quarter of 2009, and it has grown each quarter since until the fourth quarter of 2012.
But GDP growth since 2010 has been disappointingly modest, at rates of just 2 to 3% a year on average (with some quarterly fluctuation), as it has been dragged down by the falling government expenditures over this period. As has been noted in earlier postings on this blog (for example here and here), the resulting fiscal drag can explain fully why this recovery has been modest in comparison to the recoveries seen in previous downturns in the US economy over the past four decades.
The other major factor explaining the stagnation of GDP in the fourth quarter was the negative contribution from inventory accumulation. The change in private inventories led to 1.27% points being subtracted from what GDP growth otherwise would have been. But as was explained in an Econ 101 posting on this blog, it is the change in the change in private inventory accumulation which acts to contribute to (or subtract from) GDP growth in any given period.
One sees news reports that still get this wrong, with statements such as that inventories fell by $40 billion in the fourth quarter. This is not correct. As noted in the table above, inventories actually grew by $20 billion in the fourth quarter. But they grew by more (by $60 billion) in the third quarter. That is, the change (the growth) in inventories was $60 billion in the third quarter, while the change (the growth) in inventories was again positive at $20 billion in the fourth quarter. But while they continued to grow, they did not grow as fast as before, and the change in the change in inventories was a negative $40 billion. This subtracted 1.27% points from GDP growth.
As was noted a year ago on this blog when the figures for GDP growth in the fourth quarter of 2011 were released, an increase in private inventory accumulation in that quarter largely explained the relatively good growth rate of that quarter. But I argued this would then likely be reversed, with inventories not growing as fast and perhaps even declining, which would act as a drag on growth in 2012. The 2012 figures now out show that this in fact happened, with a negative contribution of private inventory accumulation to GDP growth in the first, second, and fourth quarters.
Other than the drag from cuts in government spending and the deceleration of inventory accumulation, the other components of GDP growth in the fourth quarter of 2012 were generally quite good. Residential fixed investment grew at an annualized rate of 15.3%, continuing the strong growth seen already in the second and third quarters. But residential fixed investment was only 2.6% of GDP in the fourth quarter, so the rapid growth on this small base only made a contribution of 0.36% points to GDP growth in the quarter. In contrast, government spending in the fourth quarter was 19.3% of GDP (down from 19.6% of GDP in the third quarter). [Figures on GDP shares directly from BEA on-line GDP tables.]
Non-residential fixed investment (basically private business investment in capital and structures) also grew at a good rate in the fourth quarter, at 8.4% annualized, reversing a small decline seen in the third quarter. And personal consumption expenditure rose at a 2.2% rate. Since personal consumption accounts for 71% of GDP spending, this 2.2% increase contributed 1.52% points to what GDP growth would have been.
The fourth quarter GDP report therefore would have been solid, had it not been for the sharp cuts in government spending in the quarter. Accumulation of private inventories then responds, as businesses do not want to see inventories mounting up on the shelves when they cannot be sold and scale back production (or in the fourth quarter, still increase their inventories, but not by as much as before).
The danger to the economy now is that government spending will be scaled back even further, as a Republican controlled Congress insists on slashing public expenditures. If nothing is agreed to, then the sequesters that Congress required in August 2011 as a condition for the debt ceiling increase (so that the US would not then be forced to default) will mandate a sharp scaling back in federal government expenditures. While the deadline for this was pushed back to March 1 from January 1 as part of the fiscal cliff agreement at the end of 2012, there is still a deadline. The nonpartisan Center on Budget and Policy Priorities has estimated in a recent report that should the sequester enter into effect on March 1, defense spending would be cut by $42.7 billion, or 7.3%, while non-defense spending would be cut by also $42.7 billion, or 5.1% for programs included other than Medicare (Medicare would be cut by 2.0%).
Such cuts, especially if they suddenly enter into effect on March 1, would be devastating to the economy. Note that while federal spending already fell by 15% at an annualized rate in the fourth quarter, this fall at a quarterly rate is just 3.6%. The sudden cuts under the sequester would be far larger.
Almost all of the participants in this budget process, both Democrat and Republican, agree that the sequester is something to be avoided. The sequester requirement was in fact set up precisely as something both sides would want to avoid, so that agreement would be reached on some other budget plan. But Republicans are insisting on similarly large cuts in any budget. They simply wish that the cuts would fall more on domestic programs affecting the poor and middle classes, and less on the military. But economically the problem for GDP growth would remain if similarly sized cuts are forced through, and would indeed be worse (in terms of the impact on GDP, even ignoring the distributional consequences) if they are re-focused on programs for the poor and middle classes.
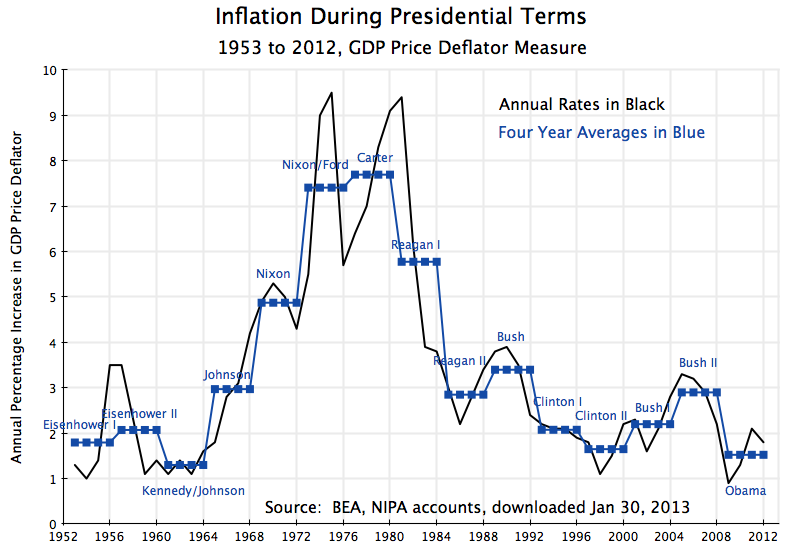
Finally, it is worth noting that the price index figures also released by the BEA on January 30 as part of the GDP accounts still show no indication that inflation is any issue. While conservatives have been asserting since Obama took office four years ago that high deficits resulting from his policies would lead to high inflation, that has not occurred. The price deflator for GDP, the most broad-based index measuring inflation, grew by only 1.8% in 2012. The price deflator for the personal consumption expenditures component of GDP (the price deflator that Alan Greenspan reportedly favored for tracking inflation) grew by a similar 1.7% in 2012. These are both just below the target of 2% for inflation that the Federal Reserve Board favors. (Inflation of zero is not desired by the Fed or others as it is then easy for the economy to slip into deflation, which makes management of the economy even more difficult.)
And inflation in the fourth quarter of 2012 was even less, at just 0.6% for the GDP deflator and 1.2% for the personal consumption expenditures deflator. The prediction of both conservative economists and politicians that high deficits under Obama would lead to high inflation unless government expenditures were slashed drastically, could not have been more wrong.

 An Economic Sense
You must be logged in to post a comment.